Cite this as: Graham, S. 2015 Mapping the Structure of the Archaeological Web, Internet Archaeology 39. http://dx.doi.org/10.11141/ia.39.1
'Omnia disce; postea videbis nihil esse superfluum' said Hugh of St Victor in the 12th century. 'Learn everything; later it will all be useful somehow'. The irony, of course, is that I would in all probability have never come across this epigram (not being a medievalist) if it hadn't been for the magic of the Internet and John Osborne's blog (Osborne 2011). Hugh goes on to say, 'coartata scientia iucunda non est', 'narrow knowledge is not pleasant' (Didascalicon VI, 3 ).That phrase fits neatly with one of the stereotypical criticisms of blogging, that blogs are narrowly focused, shrill, and often an echo-chamber for their (and their readers') own views.
In a final neat connection, this phrase of Hugh's is the epitaph on the tomb of Father Leonard Boyle. Father Boyle is buried at San Clemente in Rome, in the ruins of the 4th-century church. This 'lower church' was found in the mid-19th century underneath the present basilica that dates from the 12th century. Father Boyle was the archivist and historian to the Irish Dominicans (who manage the site), and it is indeed a moving testament to his life's work that he should be buried in the ancient basilica. The epigram then is very much an archaeological sentiment, both in its context of display, and how it implores us to learn everything: for what else is archaeological research but the careful and systematic contextualization of everything (linking, if you will) on the chance that it will answer not just questions now, but new questions later? But it is also directly useful to us who blog archaeology, who take on the mantle of digital public archaeology.
It could, in a sense, be a motto for Google, who try to 'learn everything' by focusing on interlinkages, with no idea of what will be useful to whom or in what way. But that is the problem right there – deciding what is useful, and finding it. 'Narrow knowledge is not pleasant', I think neatly describes the results of search engines in that first phase of the Internet, when the world wide web had just been created and people were still trying to produce human-curated guides to the web. Google of course changed everything with the invention of 'PageRank' (Brin and Page 1998). In essence, PageRank considers each link on a page as a kind of vote on the relative importance of the page to which it links. It also considers the relative importance of the pages being linked out from as well, and so it is a recursive process. This was Google's original insight: that the importance of a page depends on the kind and quality and number of its relations to all other pages on the web. Meaning depends on context. The 'knowledge graph' (Google 2014) is to Google as the Harris Matrix is to archaeologists.
Studies of web structure have existed for almost as long as the web itself. By 1997, Michele H. Jackson was proposing that 'network analysis' might be a suitable method for exploring the web. Jackson makes an important distinction in that early work, explaining that the web 'does not use hypertext'. She reminds us of Vannevar Bush's ideas of 'the Memex' (1945), a structure for organising information, and contrasts with Nelson's ideas of hypertext (1967) where the 'paths through these ideas are followed and created by the reader who also becomes author. A hypertext document, therefore, cannot be re-created on a conventional page of linear text.' (Nor can it, for that matter, on a screen full of text). Jackson goes on to say, 'An important point […] is the transformed position of the reader or the user. Such a transformation is possible only if the user has the true ability to move completely about the material in paths that have not been determined prior to the user's journey.' Such freedom does not in fact exist. The paths have already been predetermined by the behaviour of Google's algorithms, which in turn depend upon measuring the aggregate behaviour of web users and the specific individual user.
It also matters, from a methodology standpoint, how we conceptualise who, or what, is doing the acting here (cf. Lusher and Ackland 2011). Most studies of web structures do not explicitly use social network analysis, but rather focus on statistical distributions of links themselves to suggest macroscopic phenomena to account for the distribution (such as power laws, preferential attachment, small worlds, and other measures derived from statistical physics and complexity theory, cf. Barabási and Albert 1999; Hindman et al. 2003) or webmetrics derived from citation studies (cf. for instance Thelwall et al. 2005). Lusher and Ackland explicitly argue that when web structures are considered from a social network analysis perspective (what they cast as 'relational hyperlink analysis), where the sites themselves are social actors, one arrives at 'fundamentally different conclusions about the social processes underpinning hyperlinking behaviour' than what perspectives based on statistical physics imply (2011).
In this current study, which is only a preliminary exploration of the landscape in anticipation of a more robust programme of research into the networks that underpin the construction of cultural heritage knowledge more generally on the web, I make no a priori assumptions about the structure of the web links that I analyse but rather make assumptions about the person who might wish to know more about Roman archaeology. This ideal user knows nothing about the topic other than a few key search phrases, and proceeds to plod through every link systematically on every page encountered. Thus, my ideal user is armed with nothing more than a web-browser and unlimited patience (and not with tools such as VOSON for studying macroscopic hyperlink structures, as discussed in Ackland 2010). My ideal user is very similar to the one Brin and Page imagine in their original paper (1998) describing the PageRank algorithm upon which Google's fortunes rest.
This ideal user, as it was for Brin and Page, is very much an analytical convenience. Developing a 'smarter' ideal user, an algorithm to mimic an explicitly behavioural model of how archaeological knowledge is found (and where – not everyone might begin with Google, for instance, but turn to sites like Reddit or Boing Boing) would require combing through the traces users leave within search engine databases themselves. It would involve unearthing the traces of search themselves rather than looking at possible paths through the morass (as I am proposing here). Work by Shawn Anctil at Carleton University is explicitly tackling this issue of the intentionality of search and its relationship with historical consciousness online (Anctil 2015). Anctil's work is tremendously important in this regard, since Google's algorithm has long incorporated intentionality into how it adjudicates a site's importance and hence position in search results (see below). For my purposes here, let us deal only with the possible paths, acknowledging that a simpler ideal user is analytically more tractable for the moment and whose mapped paths are a necessary preliminary step.
In measuring the resulting maps, I use metrics from social network analysis that are appropriate for understanding a few key ideas. One, PageRank itself: at which web pages will my ideal user most probably arrive? Two, eigenvector centrality, a structural measure of that map indicating the pages that are crucial to the cohesiveness of the overall global structure. In short, eigenvector notes which sites hold this network together. Three, betweenness centrality, which is a measurement of flow or passage through nodes (the number of shortest paths between every pair of nodes in a network that pass through a particular node). Typically this is conceived as information flow, but we might imagine it here as the sequence of browsing through interconnected pages.
By measuring the way the web looks to my ideal user, and considering the social practices of blogging, the business of search and search engine optimisation, I arrive at tentative conclusions (pending deeper research) for ways in which the discipline might increase our visibility on the web. These suggestions also have implications for how we publish archaeology more generally.
Learn everything: but that's only half the battle. The other part is determining what is useful, of extracting the signal from the noise of not only the search query, but of all those millions of pages of information. Search engines are not neutral platforms (Van Dijck 2010). In the original paper describing 'the anatomy of a large-scale hypertextual Web search engine' Brin and Page wrote,
'PageRank can be thought of as a model of user behavior. We assume there is a 'random surfer' who is given a Web page at random and keeps clicking on links, never hitting 'back' but eventually gets bored and starts on another random page. The probability that the random surfer visits a page is its PageRank'. (1998, 110).
Since then, in a red-Queen effect with those who would game the system, Google has developed a suite of signals (a closely guarded industrial secret) for tailoring search results not just to the user's search terms, but also their browsing behaviour. Indeed, the seeds for this evolution were there in the beginning in Brin and Page's assumption of the 'random surfer', but the evolution of web technologies have allowed them to move from imagining the behaviour of hypothetical users to watching the behaviour of actual users. When we interact with Google search, we are teaching the machine what is useful when we skip over the first few results, looking for the one that really seems to match what we were looking for. The same search terms entered into a Google search bar will produce differing results depending on whether the machine used is a work computer (connecting from an academic domain), a home computer, an Internet cafe computer, a mobile device, and whether just one person uses that machine or whether it has multiple users (Pariser 2011; Levy 2010). Google builds up a profile of a user based on these searches, which can be monetised, and used to provide tracking advertisements wherever a user goes on the web. With the introduction of the 'autocomplete' function in Google, we can perceive –dimly- some of these behaviour profiles at work. The autocomplete suggests typical search queries based on what others have searched for; selecting one of those queries then becomes a 'vote' for that search string (Baker and Potts 2013, 189; see also Google Poetics). Given the billions of searches completed every week, Google is not a search engine, or a catalogue, or an index: it's a massive experiment in prediction.
This system can be gamed. In November 2010, the New York Times published a story about DecorMyEyes.com, an online seller of glasses and eyewear, run by one Vitaly Borker (Segal 2010). Borker discovered that if he offered poor service to some of his customers, those customers would complain on the Internet (especially in forums), linking to his site while warning others. One would think this would be poison to his business but, on the contrary, Borker discovered that it made his site's listing on Google search results improve. That is, all publicity is good publicity, as the algorithm powering the search did not consider the semantic meaning of those mentions. Apparently, Borker would go out of his way to aggravate a certain number of his customers to such a degree that they would be moved to complain online, thus generating more web traffic to his store. Once the New York Times broke the story, Google made some changes to its algorithm. Google did not reveal what changes it had made in order to prevent other unscrupulous individuals from similarly gaming the system. Borker's website dropped from its number one position to somewhere deep on the twentieth page of results in the immediate aftermath of the changes.
The story about Borker illustrates the way human interaction and Google search are linked. Google looks for actively updated materials; materials that are semantically tight; and materials that people link to. People link to the materials that Google serves up in its top five (typically), which we can imagine creates a positive feedback loop. Wikipedia and Google were made for one another. Wikipedia is simultaneously the product of enormous human energy, and enormous human laziness. Wikipedia produces strong signals – whether good or bad, Google does not care. Google returns a Wikipedia page, and many humans read it, a fraction edit it, and another fraction link to it whether to praise, disparage, or simply use as a kind of glossary of terms, thus creating signals that Google picks up.
However, it will do us no good for me to provide you with the list of results that my searches based on autocomplete suggestions return, since Google already has a very strong signal from my work computer related to my identity as a scholar. The machine to search from (more accurately, the IP address) should be representative of an 'ordinary' member of the public. (Indeed, one should perhaps use a random sample of computers representative of the population as a whole, a perspective to be explored in future work.)
Mapping the structure of the archaeological web from the perspective of an 'ordinary' interested member of the public requires doing three things. One, deciding on a starting point. Two, crawling the list of results to a predetermined depth of links (since the web is, in day-to-day practice, infinite). Three, keeping track of that structure. I will explain each of these in turn.
Deciding on a starting point means deciding whether or not to begin with a search engine or an actual site. The structure of the Internet depends on who is doing the looking. That is to say, the starting place for our mapping matters as much as the content we wish to map. Wherever we start, the resulting network is as true as any other. Thus, we need to map from a variety of perspectives, and contrast the pictures we develop, looking for similar relative patterns, or patterns of relatively similar differences. While there are some total crawls of the Internet and/or world wide web (for instance, Common Crawl 2014 contains approximately 2.8 billion web pages; the Internet Archive has a crawl of similar size conducted in 2011), they are not useful for our purposes. This is precisely because the signal that we are searching for would be drowned out by all the noise. We actually do need Google to make sense.
This study first began in 2011 and used a combination of programs and browser plug-ins to map the web. I used the network visualization program Gephi (Bastian et al. 2009) to keep track of a crawl, and the Navicrawler plug-in (Webatlas 2011) for the Firefox browser to automate that crawl. In essence, Navicrawler goes through all of the links on a page, following the linkages to a set number of steps away from the start page, passing all of the structural data that connects the pages through Gephi, which visualises these links. Once the crawl is complete, Gephi can be used to manipulate, analyse, and visualise the data.
As of 2014, the Navicrawler plug-in is no longer being supported. Updates to the Firefox browser now render it unusable, unless one installs an older instance of Firefox. Detailed instructions for using the Navicrawler with an older instance of Firefox may be found at http://electricarchaeology.ca/2014/03/10/mapping-the-web-in-real-time/
Navicrawler can export a graph file (or map) of its crawl without us having to eavesdrop with Gephi. The key difference is that the output from Navicrawler's 'export' function will give you the host-to-host links, while listening in via Gephi will collect the complete plumbing of the web (all of the ancillary services, the ad revenue generators, the calls to Google tracking analytics, the use of software libraries etc.). In a sense, the contrast is the same as the one where you, the human user of the web, see that my blog Electric Archaeology has a link to my university domain (carleton.ca), whereas Gephi will also see that electricarchaeology.ca calls to gravatar.com, to disquus.com, to various advertising services, and to a number of ad service trackers. All these are loaded by your browser while you flip from my blog's 'About' page to my faculty profile page. Both perspectives are valuable, since they offer complementary views on how the web constructs knowledge.
In 2011, the Navicrawler plug-in worked quite well, and I used both perspectives offered (the human perspective of links, and the machine perspective of all the plumbing) to map the way knowledge of 'Roman archaeology' played out across the web. In 2014, even with an older version of Firefox installed, Navicrawler does not work as it once did, typically crashing after 1000 nodes (webpages, URIs, and other bits pieces of the Internet). I supplemented my 2014 crawls with a plug-in for the Chrome browser called 'Site Spider II' (Kilby 2013) (Site Spider II will crawl from a designated starting page, systematically loading each hyperlink on that start page, and then each link in each subsequent page. It is possible to restrict its crawling to URLs that match a particular pattern (thus limiting it to the English language Wikipedia, for instance). Its output then is rather more like Navicrawler's native export, but it too can be echoed through Gephi's 'http graph generator' plug-in if so desired).
All of the resulting networks (also called graphs) discussed below may be downloaded from the data-sharing service Figshare. I have included both .gephi and .graphml versions.
| "Blogging Archaeology" | "Roman Archaeology" | |||
| 2011 | 2014 | 2011 | 2014 | |
| number of nodes | 8532 | 3912 | 6240 | 1372 |
| number of edges | 8949 | 5491 | 13216 | 8638 |
| diameter | 8 | 6 | 10 | 4 |
| average path length | 3 | 3 | 6 | 3 |
| average degree (connections per node) | 7 | 2 | 2 | 6 |
| number of modules when filtered to average degree | 5 | 12 | 14 | 4 |
In 2011, I searched, crawled, and mapped the results of a Google search for 'blogging archaeology' as part of the run up to the session of the same name at that year's Society for American Archaeology conference, organised by Colleen Morgan. Morgan had organised a 'blogging carnival', where bloggers each week responded to a set question, and the responses become fodder for the next round of discussion, collated on Morgan's blog. I began with Google.com, crawled the results, and imported them into Gephi. I let the crawl run for about 20 minutes, recovering 8532 nodes (web pages or resources) linked together by 8949 edges, or links (20 minutes was about how long this method would work on my machine before the memory demands of all of the page-loading overwhelmed the capabilities of my machine. 8500 unique webpages does represent quite a lot of data, if we pitch that in the human time it would take to read and follow those links manually. Ian Milligan of the University of Waterloo is looking at structural aspects of entire top-level domains, and has to use a machine with 64GB Ram and 8 cores to handle the analysis). This network has a diameter (the maximum distance between the two furthest nodes) of 8 – that is, 8 steps from one side to the other (Table 1). On average, to get from any node to any other node takes roughly 3 steps, which makes a rather tight network (this file is '2011 blogging archaeology on internet.gephi'.)
There are many possible algorithms for discovering substructures within a network; Gephi uses one called 'modularity' (Blondel et al. 2008). Modularity looks at patterns of linkages and identifies, with a degree of probability, areas of self-similarity within the overall patterning of links. It calls these areas 'modules'. (Other routines look at patternings of non-linkages, or holes, which is an area to be explored in a further study.) The nodes and links may be coloured by module in order to enhance the visual perception of these patterns, but with 9000 links, it is still too dense to be useful. The average number of connections per node in this graph is 7. If we filter the graph to visualise only those nodes with 7 or more connections, and re-run the modularity, we find 5 modules, or 5 broad communities, determined by the similarity of their linkages. (Strictly speaking, 'visualisation' per se of networks is rarely ever useful; it is the metrics and the rankings of the results that prove most helpful.)
Module 0 is a suite of Google subpages. Module 1 comprises mostly US newspapers and news sites. Module 2 is our first encounter with the blogosphere, especially blogs hosted at Blogspot.com. Module 3 betrays Google's monitoring behaviour, and comprises Canadian media websites in the CTV.ca domain, as is module 4, Canadian newspaper chains (see Crymble 2009 on Google's geographic bias). Module 5 contains blogs mostly hosted on Wordpress.com, as well as Flickr pages and Twitter accounts.
PageRank can be calculated in Gephi, and the top five results are:
Twitter.com, googleads.g.doublick.net, and wordpress.org are in sixth, seventh, and eighth places. In terms of overall structure (as indicated by the Eigenvector centrality measure), Facebook, Google, Youtube, Doubleclick, and Wordpress are the top five, which seems to illustrate the importance of the advertising ecosystem in the construction of the web. The structure of the web, entered into by the search term 'blogging archaeology', in 2011, would naturally funnel the browser quite quickly into the archaeological blogosphere. Betweenness centrality, a measure for each node of the total number of paths between every pair of nodes in the graph, has Colleen Morgan's 'Middle Savagery' as the top node, followed by new.googles.ca, timescolonist.com, montrealgazette.com, qmackie.wordpress.com, publishingarchaeology.blogspot.com.
In 2014, I ran the same search again, once more in the run up to the 2014 Society for American Archaeology conference, where Doug Rocks-Macqueen organised another session on blogging archaeology, with pre-conference blogging carnival (this file is '2014 blogging archaeology on the internet.gephi'.)
Navicrawler (running on an earlier version of Firefox) tended to crash before the 20 minutes was up, returning a usable dataset of 3912 nodes and 5491 links (Table 1). The network diameter is 6, and the average distance between any two nodes is 3. Filtering this graph by the average number of connections (2), and then running communities, we find 12 modules. The largest such module (module 8) contains a few archaeological blogs, but also a lot of the sites that connect the web together — google, googleadservices, flickr, youtube, facebook, pinterest. The next largest module (module 1), is almost entirely archaeological blogs and the occasional department website. The next one (module 4) is again mostly archaeological blogs and department sites, along with Wikipedia and some academic journals.
PageRank returns the following list of pages as the most probable destination of our random browser:
Doug's Archaeology, the locus for the 2014 blogging carnival, appears in 14th place. The 2014 blogging carnival was certainly a longer, more active, and larger group of people than in 2011, which partly explains the prominence of Doug's Archaeology in this list. Eigenvector centrality puts Doug's Archaeology in the top four, after wordpress.com, theme.wordpress.com, and twitter, and just before facebook.com.
Finally, if we consider betweenness centrality, or the likelihood that a page would be traversed by that random user, Doug's Archaeology comes first, followed by thesebonesofmine.wordpress.com (by David Mennear; interestingly, Mennear has a list on his 'about' page that itemises every time his blog has been mentioned in journals and reviews), google.com, rcnnolly.wordpress.com (Robert Connolly).
These are good results: they suggest that if a person knows to search for 'blogging archaeology', they will most likely encounter sets of high-quality materials mostly written by archaeologists. The linking, however, suggests that it is mostly other archaeologists who are doing the reading, which is not ideal if we frame 'blogging archaeology' as a practice of public archaeology. The plumbing of the Internet appears indirectly: Google's algorithms recognise my IP address's location in Ottawa, Canada, thus all of the news media pages have a distinctly Canadian bias and Canadian media (naturally enough) are interested in Canadian stories. In a sense, these results are not surprising, since I 'gamed' the system by looking for a term that I knew was active and heavily represented in the archaeological blogosphere. What is interesting is how much structure a blogging carnival imposes on the web of links: provided we have the keys to the kingdom in the first place (in this case, knowing to search for 'blogging archaeology').
Given my background in Roman archaeology, let us search and map 'Roman archaeology'.
In 2011, I searched, and crawled using Navicrawler, for 20 minutes. I found 6240 nodes and 13,216 edges, making this a more dense network already (Table 1). The diameter of this network was 10, and the average path length was 6. A longer path length suggests more disconnection, despite the overall greater number of links (this file is '2011 roman archaeology on the internet.gephi').
Filtering by average degree again (2; so showing only those nodes with 2 links or more), the modularity routine finds 14 modules (with the three largest containing 54% of the network). Module 3, the largest, is composed entirely of sites within the Wikipedia ecosystem (thus, wikibooks.org, wikimediafoundation.org, and all the non-English Wikipedias). Module 0, the next largest, is almost entirely sites within the Google ecosystem, and some news media sites. The third largest, 13, are sites tied to Duke University. The next module, 12, has sites from dartmouth.edu, and northwestern.edu.
Moving to the perspective of individual nodes,
Nothing that is overtly about Roman archaeology appears. But there is a lot of noise in this picture, even though we filtered out the nodes with less than the average degree. All those Wikipedia pages appear important to these algorithms, but someone who searches for 'Roman archaeology' in English is not going to be swayed by the other-language Wikipedias. If we take the average degree of this filtered graph (5), and filter again to show only nodes with 5 links or more, we are now looking at a network with 580 nodes and 6069 edges. Modularity now finds 9 communities. The only major change in the node level metrics here are that duke.edu, harvard.edu, cornell.edu, columbia.edu, and dartmouth.edu now appear in the top 15 by betweenness centrality: Wikipedia and Google still dominate. The first blog, romanarch.blogspot.com, breaks the top 40. That is not a bad result, for a blog; structurally, blogs appear wedged between the mass of Wikipedia pages and the plumbing of the net, Google, and the academic sites. But it does seem to fit the idea of bloggers merely shouting into the void, or at best, to other bloggers, even if they do help pull the network together.
2011 was some time ago; in Internet terms, it might as well be an aeon. What does 2014 'Roman archaeology' look like, and what do the changes imply? If these crawls are re-run in 2014, stopping after roughly the same amount of time, I find 1372 nodes and 8638 edges (Table 1) (this file is '2014 roman archaeology on the internet.gephi'.). The diameter of this network is 4. I filter the network to display only those nodes with the average degree of this network (6) or higher, and run the modularity algorithm, which finds 4 communities. All these communities are dominated by various parts of the Wikipedia enterprise:
The result was so startling that I wondered if the vast amounts of ancillary resources that get loaded during the crawl, the ones that help make Google and these other sites run, were getting in the way, if the apparatus of surveillance on the Google search engine (and the way that Google and Wikipedia feed each other) were distorting my results.
I took the 10 links suggested in a search for 'Roman archaeology', and made a simple html page with those 10 links. I did the same using the DuckDuckGo.com search engine (which does not track its users, and so should provide results that are not distorted by the advertising ecology of Google or its user surveillance). I re-started the crawl from those two plain pages, each with 10 results (the first page of results from the search engine) instead. (The two start pages for the crawl were: http://graeworks.net/transfer/romanarchongoogle.html and http://graeworks.net/transfer/romanarchonduckduckgo.html By creating a page without all of the background search engine stuff, I've created a new node on the Internet, with out-degree of 10 in both cases.)
| DuckDuckGo | ||
| number of nodes | 1315 | 1415 |
| number of edges | 6924 | 2288 |
| diameter | 4 | 7 |
| average path length | 2 | 3 |
| average degree (connections per node) | 5 | 2 |
| number of modules when filtered to average degree | 3 | 6 |
The crawl ran in both cases until it encountered the Knutsford Guardian website, which demanded the reader register, breaking the crawl. The results show just how much 'cruft' (extraneous code, or generally anything superfluous, in digital media) pollutes the web that is not displayed to the user.
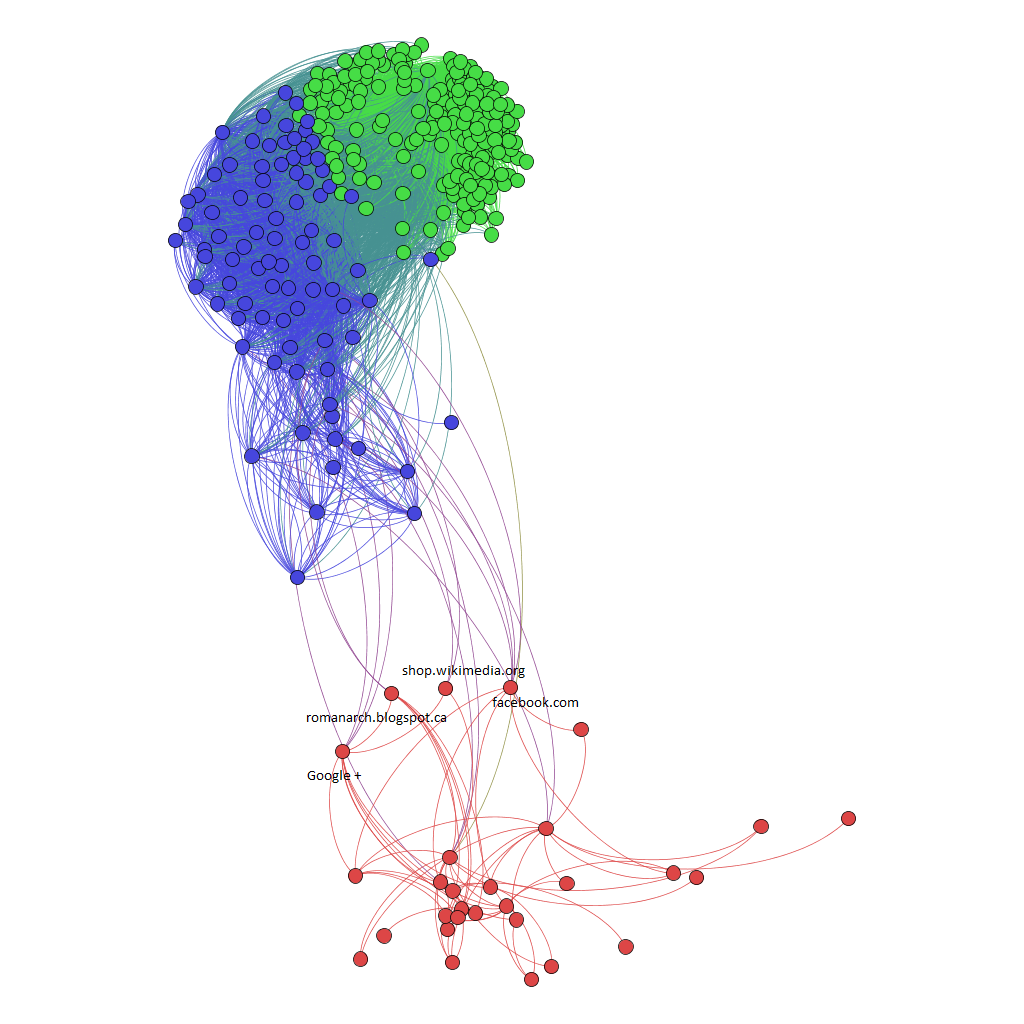
From the search results provided by Google, the crawl found 1315 nodes and 6924 links (this file is 'vanilla-search-from-google-roman-archaeology-april25.gephi'). The diameter of this network was again 4, with the average number of links being 5 (Table 2). I filtered to show only nodes with 5 or more links, and ran the modularity routine again. Figure 1 shows the resulting network. Wikipedia and its sites are the two modules at the top, while the red module at the bottom contains pages from Google, news outlets, and blogs. Interestingly, it is Google Plus and romanarch.blogspot.com that connect the two modules together.
The results from DuckDuckGo are broadly similar with important differences, resulting in a graph with 1415 nodes and 2288 links (Table 2). (This file is 'vanilla-search-from-duckduckgo-roman-archaeology-april25.gephi'.)
Searching from DuckDuckGo, it is apparent how much the ecosystem of advertising, of tuning search results to the individual, is actually preventing our hypothetical browser from finding our archaeological blogs (and our formal department websites or projects). The betweenness centrality scores, from the DuckDuckGo perspective, do hold out some hope for our blogging. When the infrastructure that supports Google's behavioural monitoring is stripped away (as in the DuckDuckGo.com search), we start to see blogs emerging again.
It does seem clear: blogging works insofar as we talk to other bloggers. But for run-of-the-mill searching using the world's most popular and powerful service, over the period 2011 to 2014, Wikipedia has become incredibly important to the lay person's understanding of our subject on structural grounds alone. It is not just that people will turn to Wikipedia for lack of a better resource, it is the signal that Wikipedia puts out, and the resulting changes in the structural patterns of hyperlinking, that have overwhelmed our blogging entirely.
This is diametrically opposed to what I concluded in 2011, where I suggested that blogs fit into the ecosystem as knowledgeable intermediaries between Google and Wikipedia. (The differences are due I think to the increasing efforts of digital media giants to construct walled gardens, the better to keep their users contained so that advertisements may be better served, and so-called 'big data' metrics about their behaviour better gathered, all the better to serve advertisements with, more on which below.)
In the short term these results imply that, we should also crawl the web of links that is Wikipedia, to see what we find, and to see whether there is still a role for archaeological blogging, or if we need to move en masse and become Wikipedia editors. In this final section, I consider what we might learn from a crawl of Wikipedia for 'archaeology', and what it implies for our practice of blogging-as-digital-public-archaeology.
Site Spider II was set to crawl the pages of Wikipedia three times, beginning on the 'Archaeology' page, the 'Classical archaeology' page, and the 'Roman archaeology' category page (three logical start sites for someone interested in Roman archaeology). The results were collated together into a single graph (See file 'archaeology-roman-arch-classical-arch-on-wikipedia.gephi').
| Wikipedia Archaeology | |
| number of nodes | 16615 |
| number of edges | 17041 |
| diameter | 4 |
| average path length | 2 |
| average degree (connections per node) | 1 |
| number of modules when filtered to average degree | 91 |
The resulting network has 16,615 nodes (i.e. pages or articles) connected by 17,041 links (Table 3). The diameter of this network is 4. If we think of Wikipedia as a branching narrative, and we ignore the three starting points, we see some interesting patterns.
Remembering that PageRank implies the probability of a random user reaching a particular node in a network, and that the highest ranked nodes by PageRank are almost entirely about meta-issues concerning the articles themselves, the picture of archaeology that emerges on Wikipedia is one where things are still in a state of flux and evolution. Wikipedia is the font of knowledge on the world wide web, but the knowledge that Wikipedia represents is not settled (elsewhere, I have written about the ways that the writing of a single page in Wikipedia seem to follow a kind of path dependence, where the development and expansion of the article follows in large part the themes present in the very first sentences; Graham 2013).
It is also worth considering the implication of the Amazon product page appearing in the results of nodes with high eigenvector centrality. It seems to me to imply that citing works with a digital presence can be used to provide better structure to the shape of knowledge on Wikipedia. Citation, then, is not just something morally right; it has actual structural consequences.
It is worth pointing out one more way in which all of this system is under pressure to evolve, in ways that hamper our signals from getting through. In recent months, I have noticed a number of clearly automated, clearly false, 'followers' signing up to Electric Archaeology, my blog. These fake users do not seem to do anything other than sign up to be notified whenever I post something new. It turns out that these fake users may be part of organised 'crowd-frauding', as Eric Hellman puts it (2014), or traffic-generation. These simple robots click on links, register for accounts, reload pages, all for the purpose of creating inflated 'impressions', the metric by which advertising dollars are apportioned and earned online. Hellman argues that this fraud, and the massive computational resources necessary to counteract it, will push more and more advertising monies (hence power) to the digital giants (Google, Apple, Facebook), since they are the only ones who have the technological prowess that can guarantee that 'real' people are clicking on real advertisements. The small independents will get swallowed up: 'Ad networks will become less and less efficient because of the expense of dealing with click-fraud. The rest of the internet will become fake as collateral damage' (Hellman 2014).
In the crawls from 2011 and 2014, we can see this process at work as the infrastructure of the web funnels more and more through the largest entities. As we plan our strategies to engage in digital public archaeology, we should think carefully about these issues.
It is also worth thinking about whether or not such network mappings could be useful in terms of assessing impact in the sense that the UK's Economic and Social Research Council suggest – of instrumental, conceptual, or capacity building. While it is outside the remit of this article, one could imagine building a study that takes a representative sample of academic blogs from various niches – the junior scholar; the post-doctoral researcher; the graduate student; the alt-ac employed; the tenured professor; the sessional adjunct – and maps the average positioning of these to establish baselines, comingled with other indicators (citation metrics and so on). That is, it might be possible to identify the structural signature of a 'typical' individual at various career stages, and then to measure an individual against that signature (Kjellberg 2014 takes a similar approach to understading the stylistic genre implications of blogging). Wang et al. (2015) found that the intersection of social media with open access publications increased citations; Peters et al. (2013) found that blogs themselves did not seem to generate much traction. These studies strike me as perhaps pointing to the importance of a holistic approach that considers not just what is on the blog, but also who is running the blog, and the fact that the impactful (if that is a word) conversations happen across multiple channels and streams. Any incorporation of this kind of analysis into formal considerations of impact would of course be open to the same kinds of gaming we have already discussed.
Academic blogging, despite its increasing structural marginalisation over the last three years (a result of increasing personalisation of results based on prior browsing habits, and the aggregated habits of millions of users), still has a role to play. Shema et al. (2014) found that blog citations of journal articles seem to correspond with greater subsequent journal citations for those same articles. In 2011, in my presentation to the SAA, I felt that
'Academic blogs tend to have a very tight focus. They are updated fairly regularly, as the academic incorporates them into his or her work cycles. The anchor text for linking tends to be rather unique combinations of words, what Amazon would call 'statistically improbable phrases', and thus provide more signal to Google's robots … A consistent presence then by an academic blogger can perform magic. It begins to tell Google what's important.'
Unfortunately, the signals that blogs make in the noise of the Internet are only apparent if you already know what that signal should be (a search for 'archaeological blogging', for instance). This has the pernicious effect of making our blogs ever more a conversation amongst insiders. I did conclude, in 2011
'We need to create the strongest signal in the noise that we can: and blogging is a crucial part of that. 'Omnia disce; postea videbis nihil esse superfluum'. Google learns everything, but it still needs to be taught.
That's our job.'
However, we need to change our strategy. Blogging is not enough. The world wide web of 2014 is ever more of a closed garden, walled off into different zones of control. If we hope that our blogging, our digital public archaeology, makes an impact and reaches our public, then we need to shout together and engage with Wikipedia. The key, I think, is to present our blogging in such a way that our work can be cited in Wikipedia articles, abiding by Wikipedia's 'neutral point of view' provisions. The prime directive, as it were, for this is that a Wikipedia article ought to cite a secondary source.
We need to professionalise our blogging output and the ways by which it might be known.
A model for how we might do this is presented by Digital Humanities Now and the Journal of Digital Humanities. Digital Humanities Now 'is an experimental, edited publication that highlights and distributes informally published digital humanities scholarship and resources from the open web'. DHNow maintains a list of blogs to which any researcher might submit their own blog. Each week, community editors-at-large review the latest posts, nominating the best/most interesting/most important for discussion. An Editor-in-Chief (a revolving position) then curates the best of the best for publication on the DHNow site, and rebroadcasts it through Twitter, Facebook, and other social media platforms. From these 'editor's choices', the Journal of Digital Humanities solicits fuller pieces each quarter for a thematic issue. The entire process thus surfaces the best work, amplifies its message and signal, and provides a way that this work can be embedded into the crowdsourced articles of Wikipedia without violating Wikipedia's editorial policies, as a peer-reviewed article.
We need to create a similar 'Digital Archaeology Now' to surface the best work of blogging archaeologists. In addition, we also need to be editing, expanding, and improving the ways 'archaeology' is presented on Wikipedia. We need to be providing citations, linkages, and otherwise expanding the structure of academic knowledge in this evolving ecosystem. We are too powerless to stop the emerging walled gardens on the web; but if we understand the contexts in which our blogging might be found, we can devise strategies to use these new architectures to our advantage. We can still generate strong signals in the noise.
I wish to thank Colleen Morgan for her continuing leadership in digital public archaeology, and for inviting me to participate in this issue. I also owe a debt of gratitude to Ian Milligan, Lorna Richardson, Terry Brock, Ethan Watrall, Andrew Bevan and others too numerous to name who have commented and conversed with me over things digital since Electric Archaeology first went live in 2006, and trust that they have all found it useful, engaging, and sometimes even entertaining.
Errors are my own. In fact, I would be delighted beyond measure if readers download my data files, run their own analyses, and offer better interpretations.