The pendant was investigated for any trace microscopic residues that might indicate how it had been made and used, with a particular focus on whether coloured materials, such as ochre, charcoal, or resin had been used to emphasise the lines. Four residues were identified: brown staining, gold-coloured crystals, biological structures, and white crystals. In addition, two soil samples from the same context as the pendant were tested as controls for contamination from the surrounding burial environment.
The pendant was first analysed using reflected light microscopy (Leica DM1750 M), using objectives ranging from 5x to 100x, and an eyepiece magnification of 16x. Each engraved line on the pendant was systematically examined and the locations of microscopic residues were mapped. A series of z-stacked micrographs were taken for each microscopic residue to make a composite image, using Leica Montage software. Soil sample controls were prepared by direct mounting on glass slides with double-sided tape and examined with reflected light microscopy. Secondly, located residues were investigated with a variable pressure SEM (Hitachi TM3030Plus), as outlined in section 4.1.
Residues were further analysed with microscopic confocal Raman spectroscopy (Micro-Raman). Micro-Raman is a spectroscopic technique utilised for the identification of crystal and molecular structures employing lasers to excite vibrational and stretching modes within the samples; this technique can suggest the chemical nature of microscopic residues with a high degree of specificity. Micro-Raman is minimally destructive to the residue in that an area of the residue of interest, about 20 µm2, is burned by the incident laser beam during analysis. A HORIBA Jobin Yvon Xplora confocal Raman microscope with LabSpec 6 and IGOR Pro software for peak analysis were used to collect and evaluate spectra (Physics Department, University of York).
Four areas of the pendant were investigated with Micro-Raman: brown deposits within the engraved lines, gold-coloured structures (suspected to be pyrite), biological structures, and white crystals within the perforation hole. The 100x objective was used to record images of the exact locations of laser penetration on each residue. Many spectra of suspected pyrite crystals on the pendant were collected; however, fluorescence of the material and scattering due to the microtopography of the sample often resulted in spectra that had poor signal to noise ratios. Thus, several spectra were discarded because they were too 'noisy' to discern any peaks.
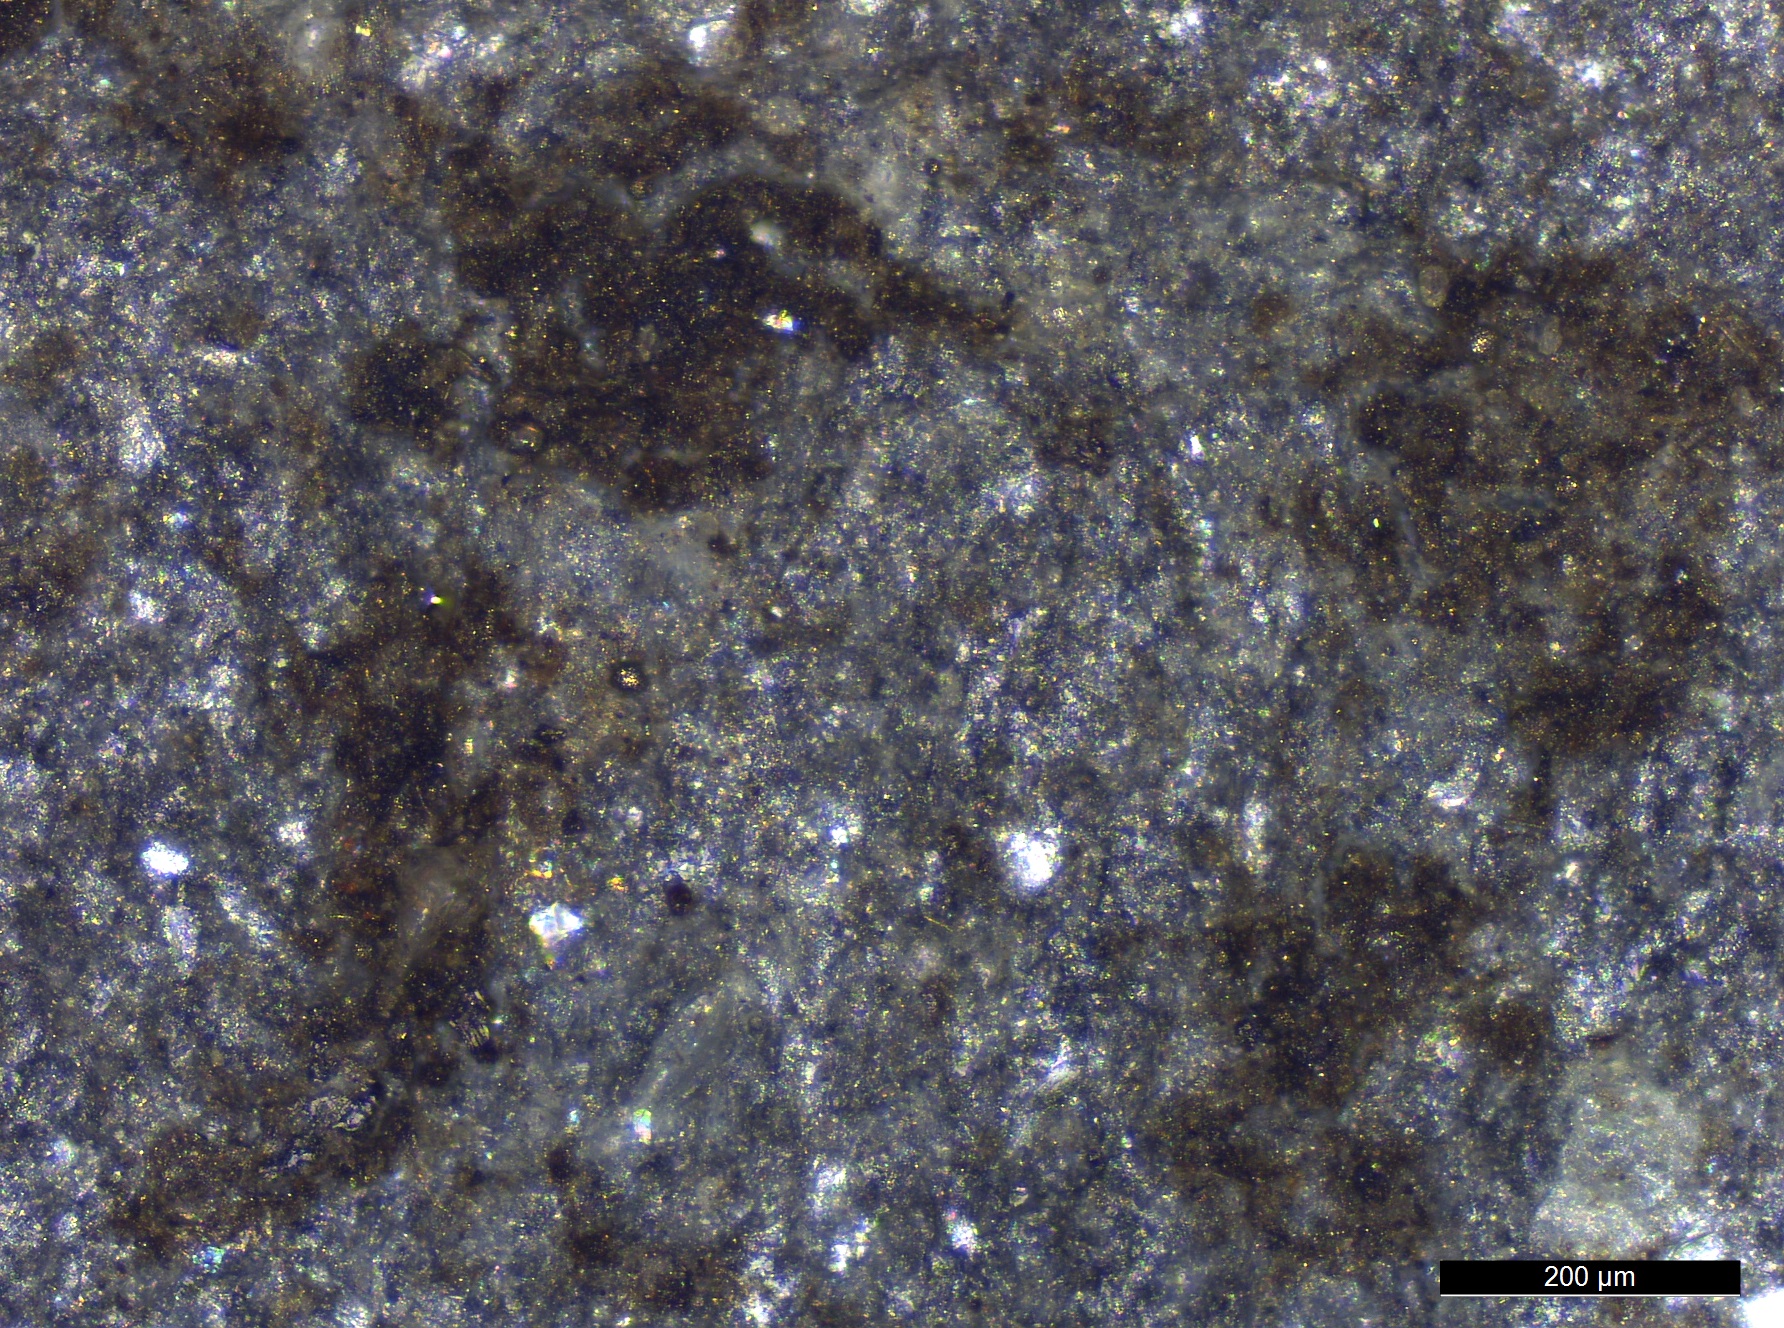
The depressed area within the engraved lines contained brown deposits (Figure 18). Micro-Raman analysis was conducted to identify the possible presence of crystalline phases in these areas that could be associated with the presence of pigments. However, the respective spectra showed no evidence for this. Rather, spectra collected from the brown deposit within the lines shows that the brown material is organic in nature (Figure 19) and it is very likely that this is peat from the burial environment that has become entrapped within the grooves.
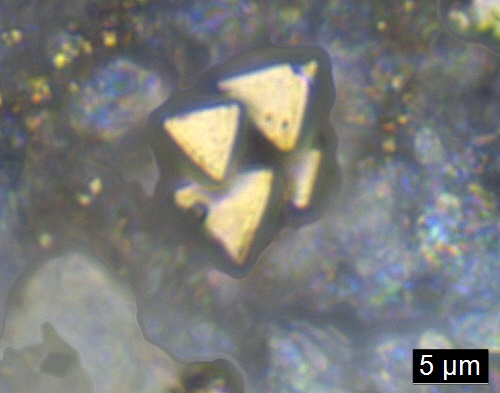
A large number of gold structures were seen on the pendant during inspection with light microscopy. These structures were located on the surface of the stone, in the engraved lines, in the perforated hole, and also within a nick on the back of the pendant. Two types of gold structures were found: equilateral triangles (max. diameter approximately 5.6 µm), and granular spherical crystals (max. diameter approximately 40 µm), which were located on the non-engraved side of the pendant within the nick mark (Figures 20 and 21).

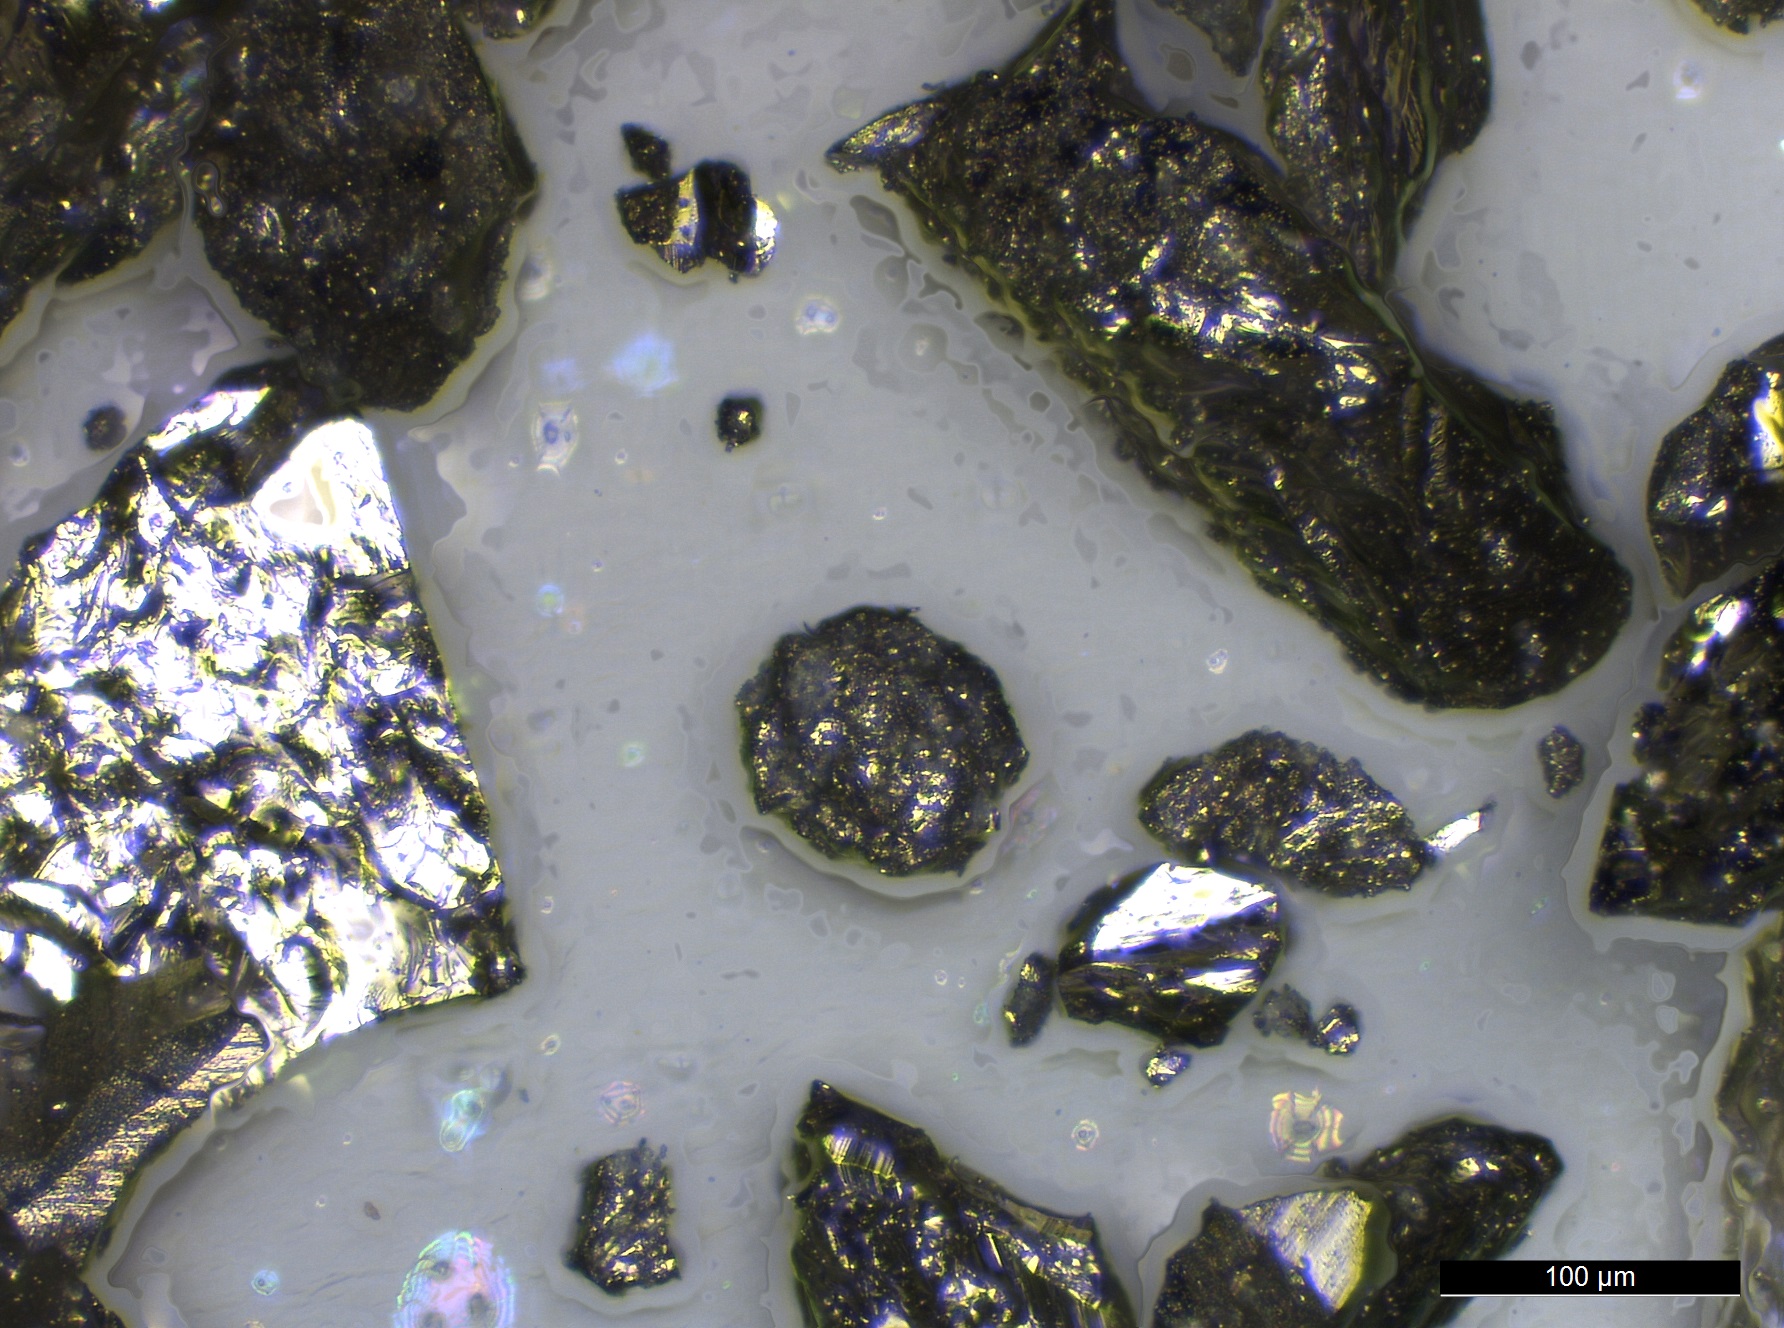
It was noted that pyrite had previously been found at Star Carr, possibly used as firelighters (Clark 1954, 20) though none have been found within the museum archives (Milner et al. 2013a) for comparison. One hypothesis on discovering the pyrite on the shale pendant was that it might have been struck with iron pyrite. A reference piece from the nearby coast was pounded on a hard surface and the resulting residue mounted on a slide for observation. It was clearly shown that this produced angular pieces as opposed to the forms found on the pendant (Figure 22).
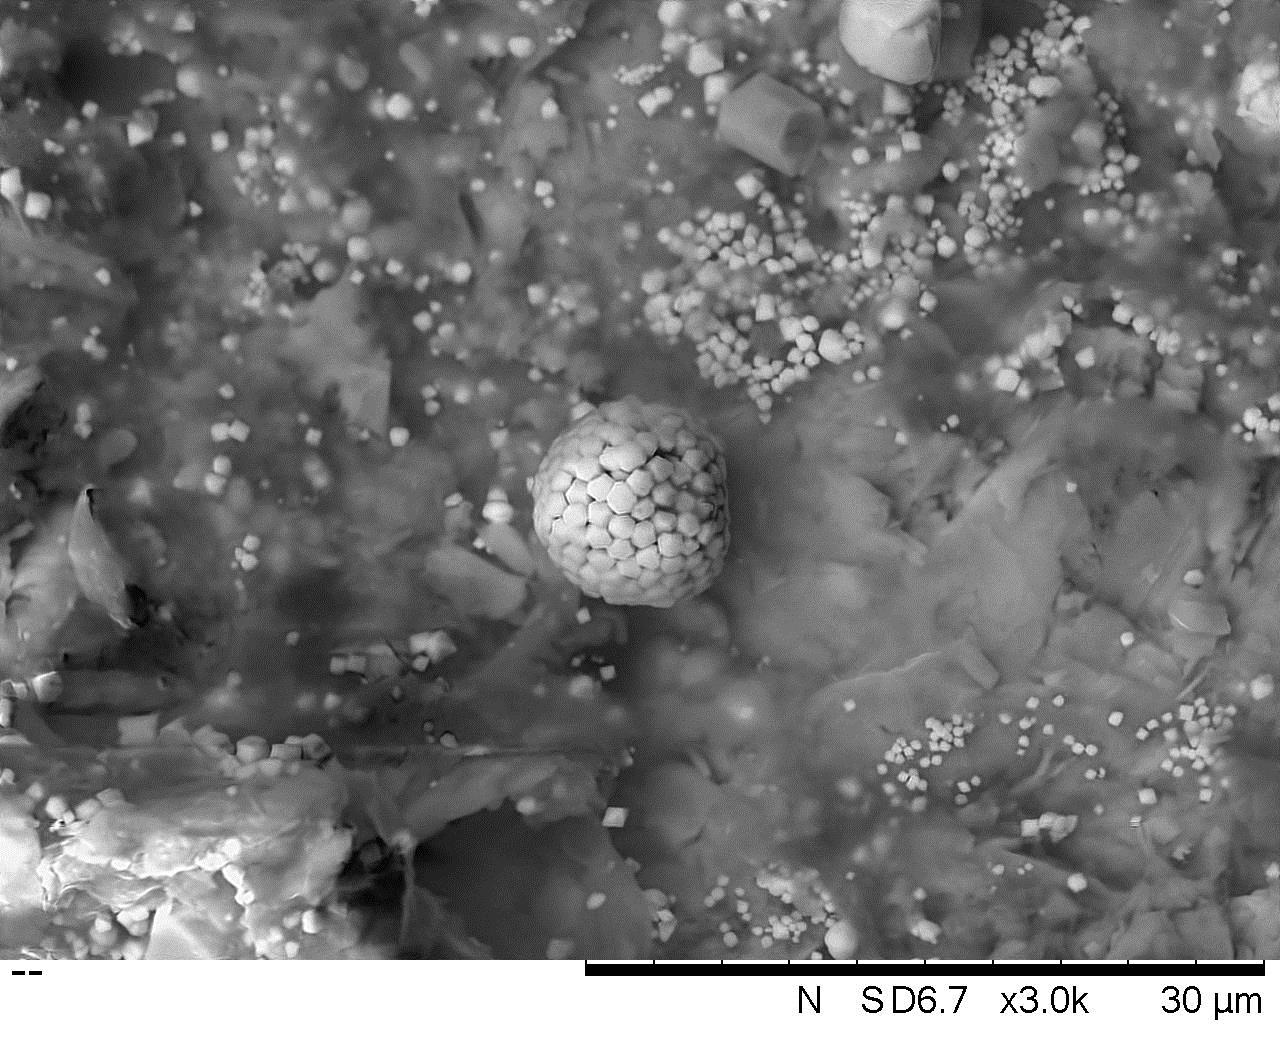
The framboidal structures seen under the light microscope were confirmed under SEM as overall spheroid shapes with individual cubo-octahedral microcrystals (Figure 23) (cf. Butler and Rickard 2000; Popa et al. 2004), typical of pyrite. The Raman data obtained support the suggestion that the crystal structures with triangular faces and the framboids were pyrite. Figure 24 shows an example of the spectra obtained from these samples.

Anisotropic pyrite contains two intense peaks at ~342cm-1 and 377cm-1, and one minor peak at 428cm-1 (Mernagh and Trudu 1993, 118). The ENS de Lyon Handbook of Minerals Raman Spectra (Anon. 2000) quotes three Raman frequencies in anisotropic pyrite: two strong peaks at 340-342 and 375-377, as well as a minor peak at 428cm-1 (Anon. 2000). According to Demoisson et al. (2008, 345), pure pyrite shows scattering signals at 340 and 377cm-1. Both Raman spectra from the triangular crystals and framboids are consistent with reference spectra for anisotropic pyrite. As can be seen in the spectrum figure X, the first two prominent bands are clearly present. The third low-intensity peak at 428cm-1 noted by Mernagh and Trudu (1993) and in the Handbook of Minerals (Anon. 2000) is not completely clear. The third peak may be present, but it is difficult to resolve due to signal-to-noise distortion in the spectrum.
It is concluded that the gold-coloured crystals found on the pendant are natural pyrite, not an anthropogenic addition of pigment to the pendant. Pyrite is known to form naturally by the decomposition of organic material in peat bogs (López-Buendía et al. 2007). Triangular and framboid pyrite crystal formations were also observed within two soil samples taken from the context in which the pendant was found.
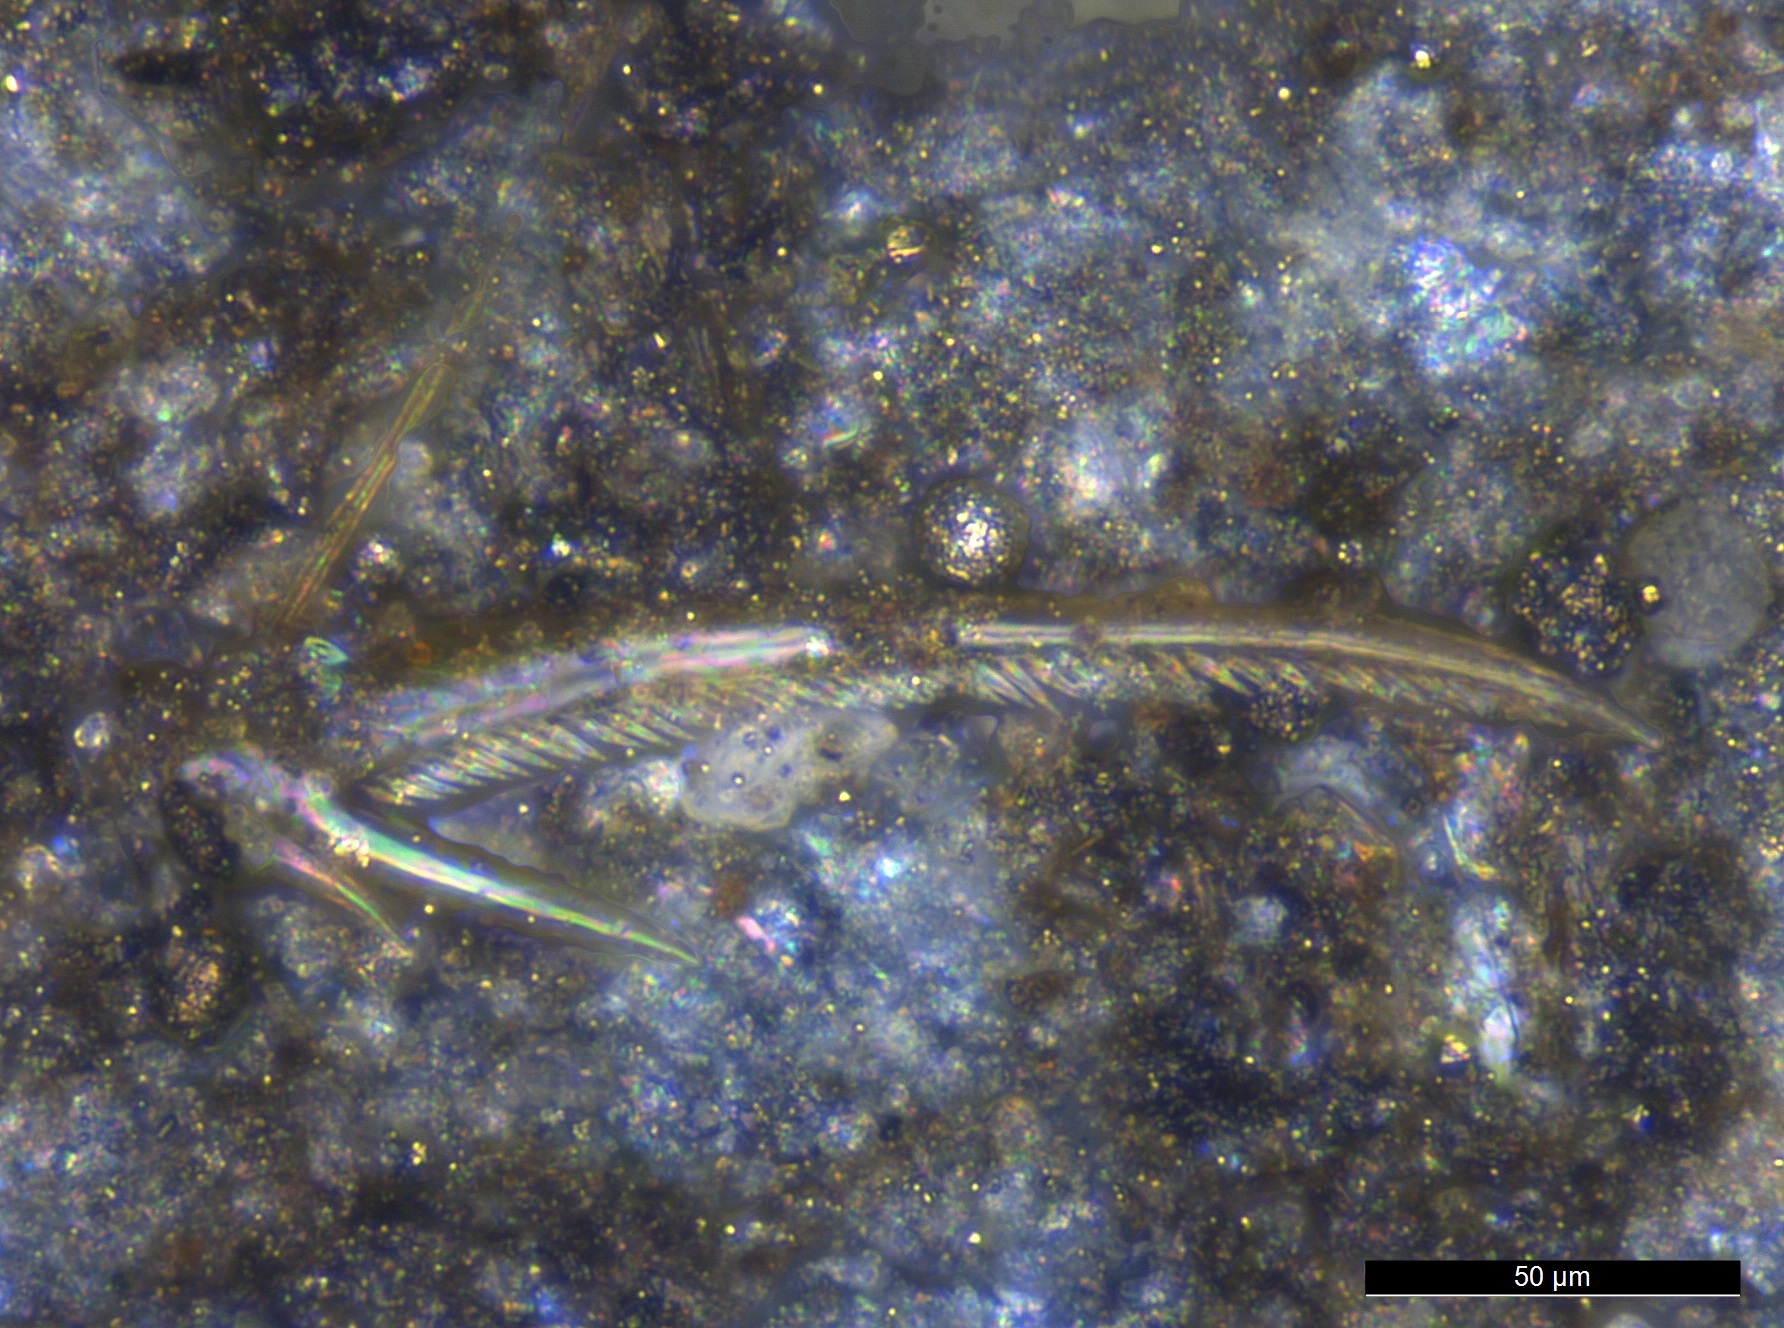
Several unidentified fragments of what appear to be lacustrine zooplanktonic microfauna such as fairy shrimp, copepods, cladocerans, ostracods, or insects, were identified within the engraved lines of the pendant. One of these fragments, mapped to location 1 within line 1 on the pendant surface (Figures 25 and 26) is probably the remains of a copepod, a very small crustacean. No microfauna were found within the soil samples analysed, although specimens may have been bound up in soil aggregates and thus obscured.

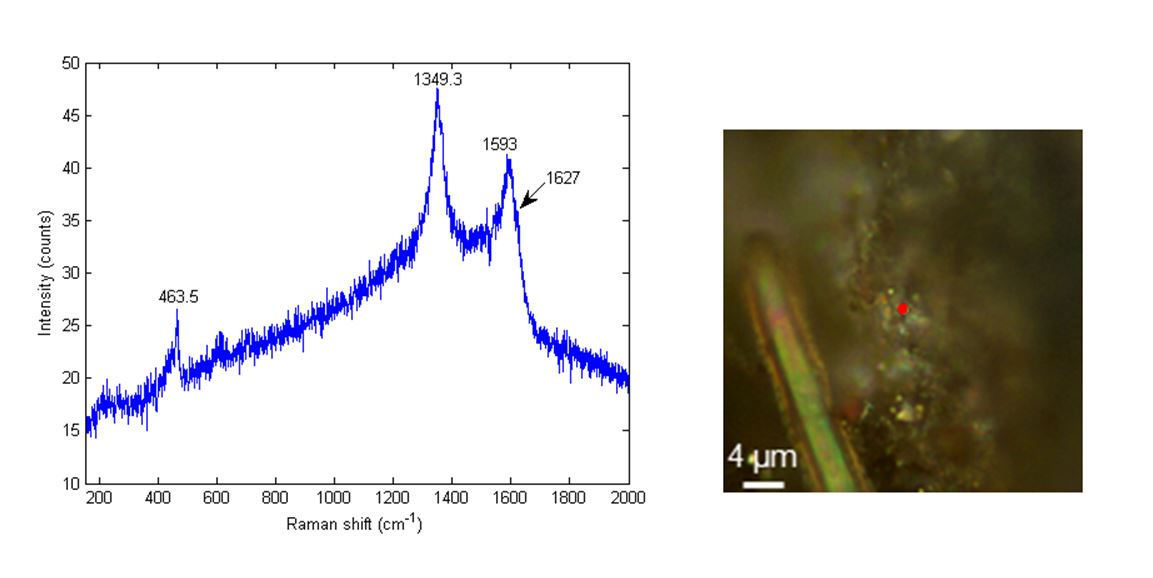
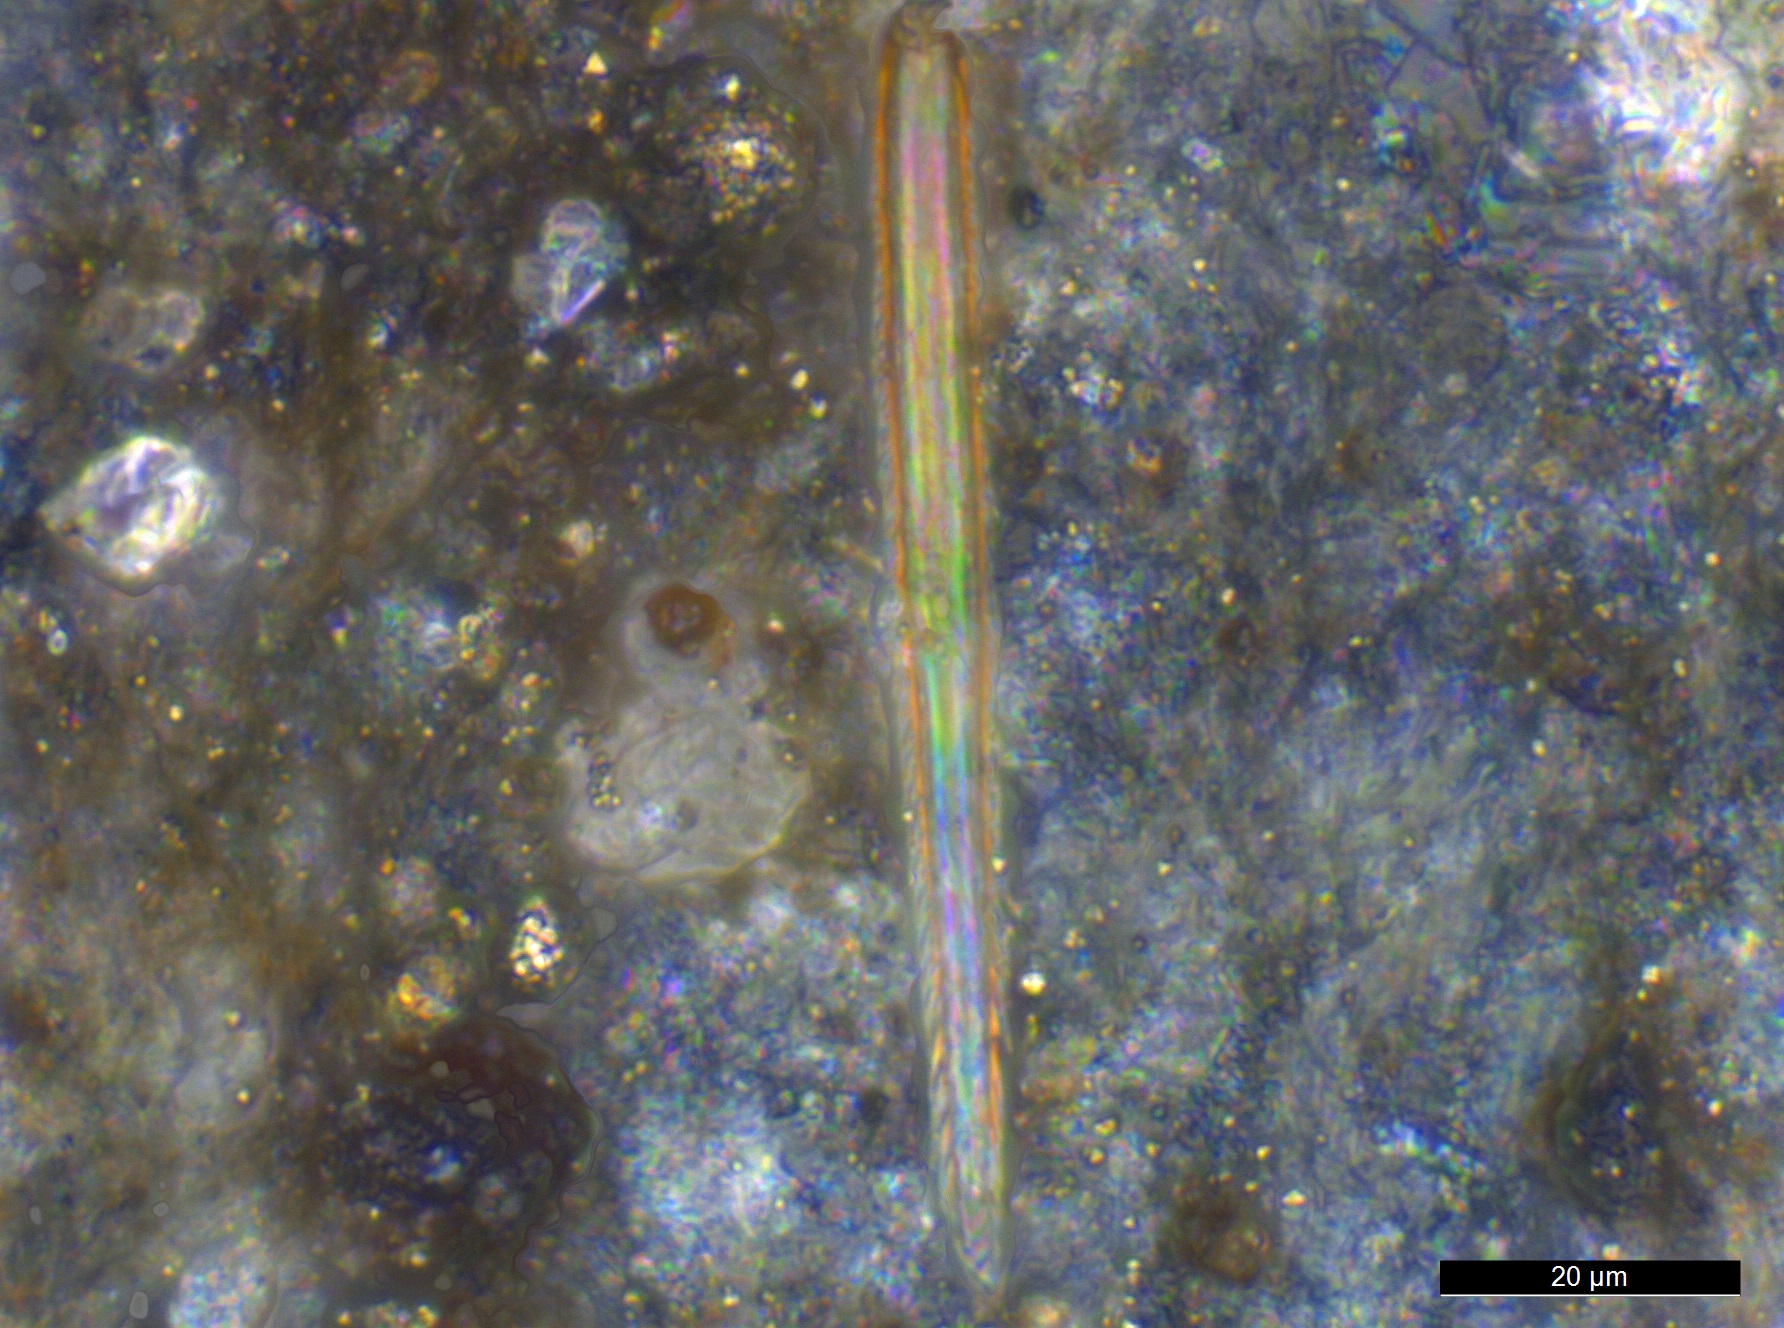
There was some question as to whether the putative biological structures were perhaps mineral in origin. Thus, one of these structures (at location 9 on the pendant, see Figure 27) was investigated with Micro-Raman in three locations. The presence of carbon in three spectra confirmed it was organic (Figure 28).
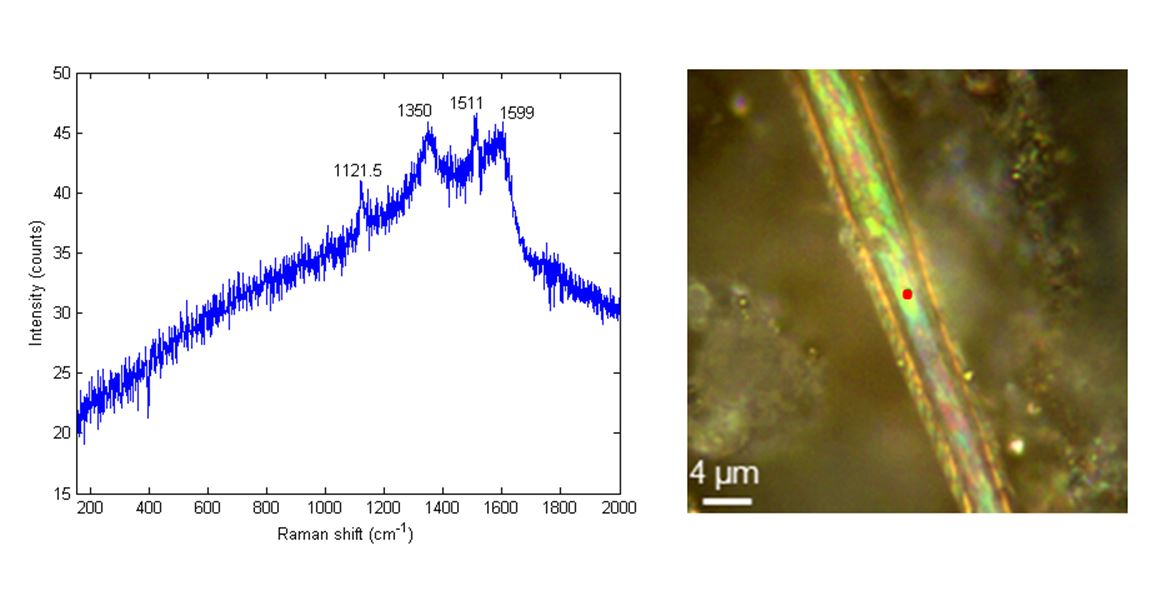
The conclusion from the Micro-Raman analysis is that these are biological structures but a number of specialists have been unable to make a specific identification. They are not related to the use or manufacture of the artefact and might have adhered within the engravings owing to the pendant being placed within the lake edge deposits where such microfauna naturally occur.
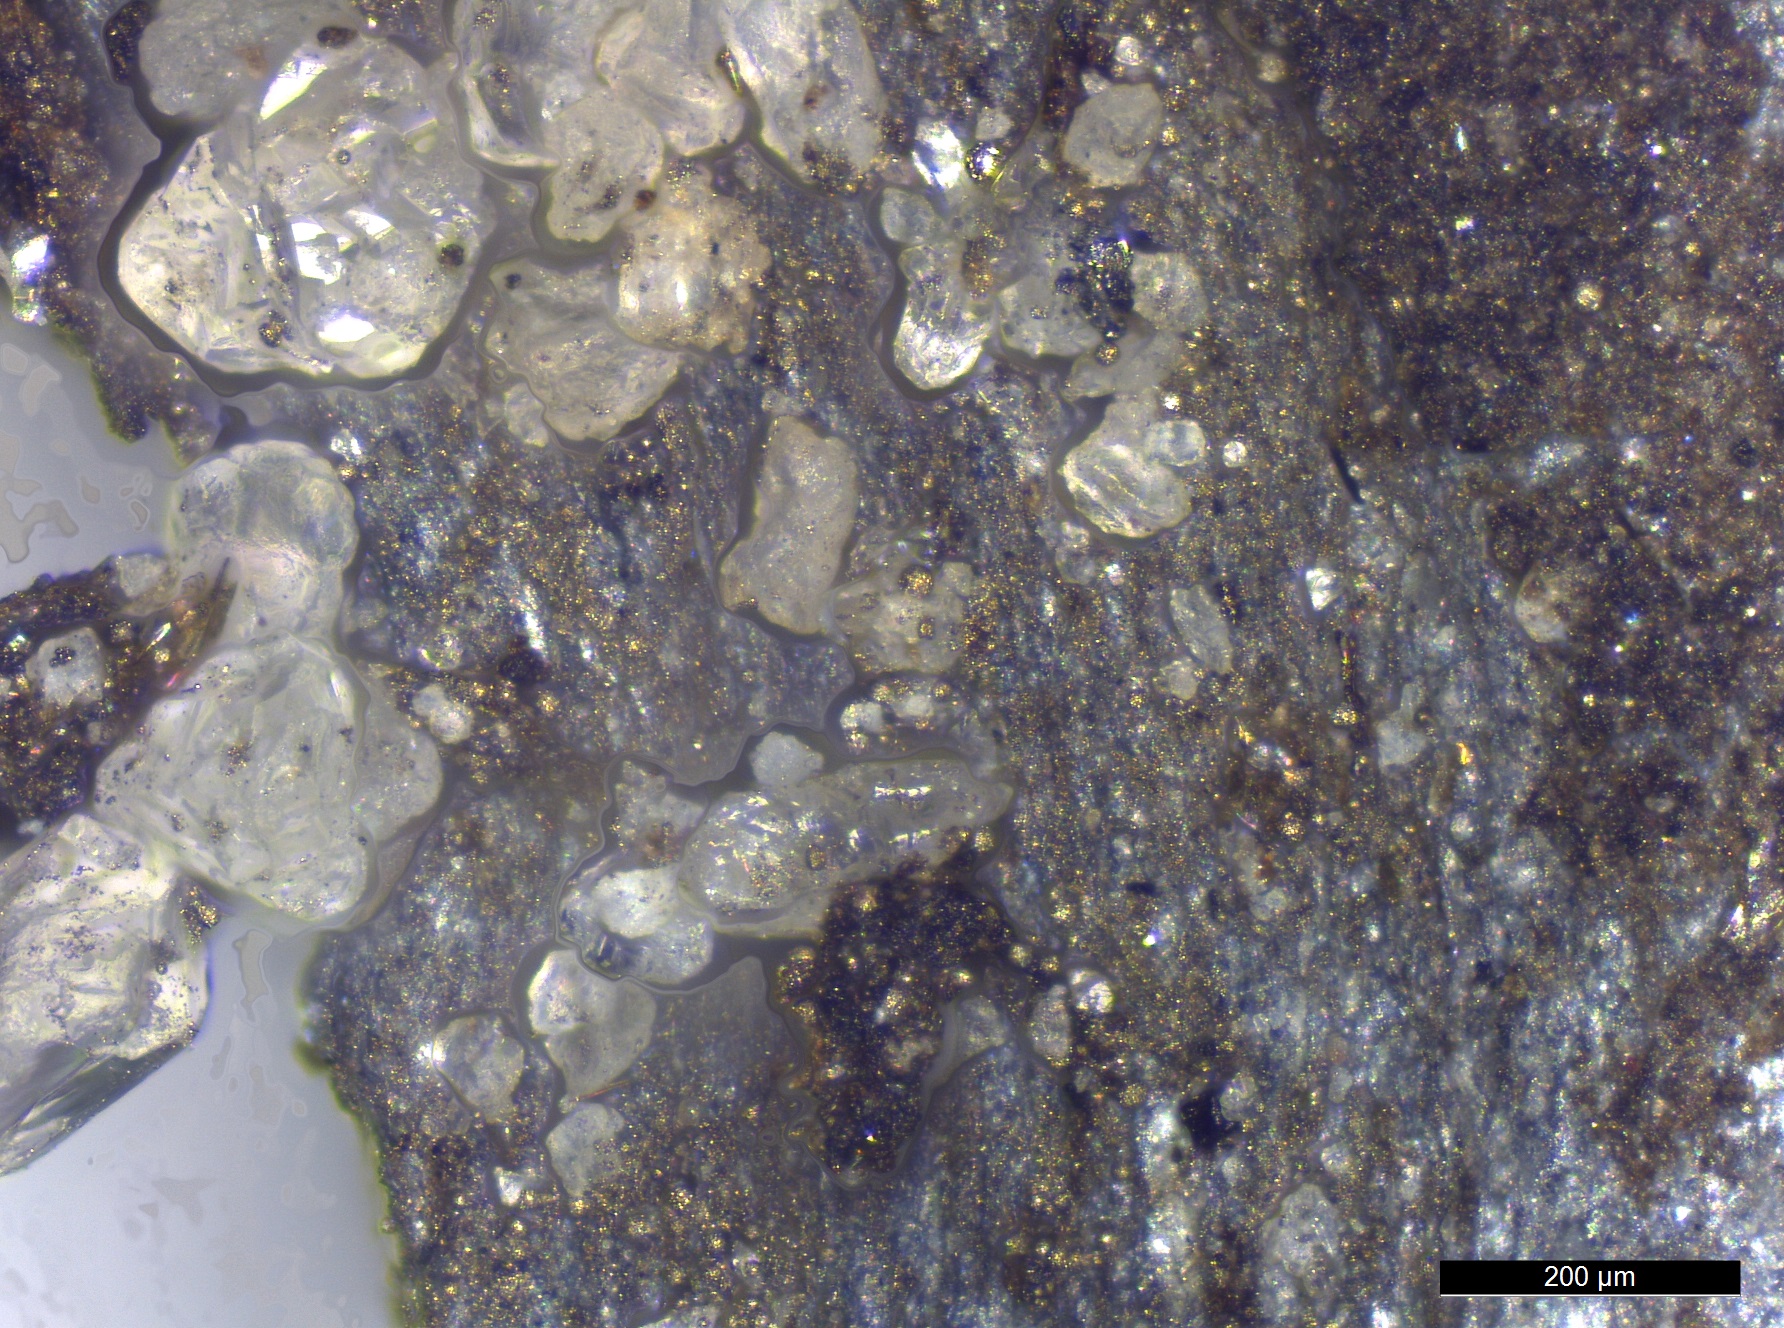
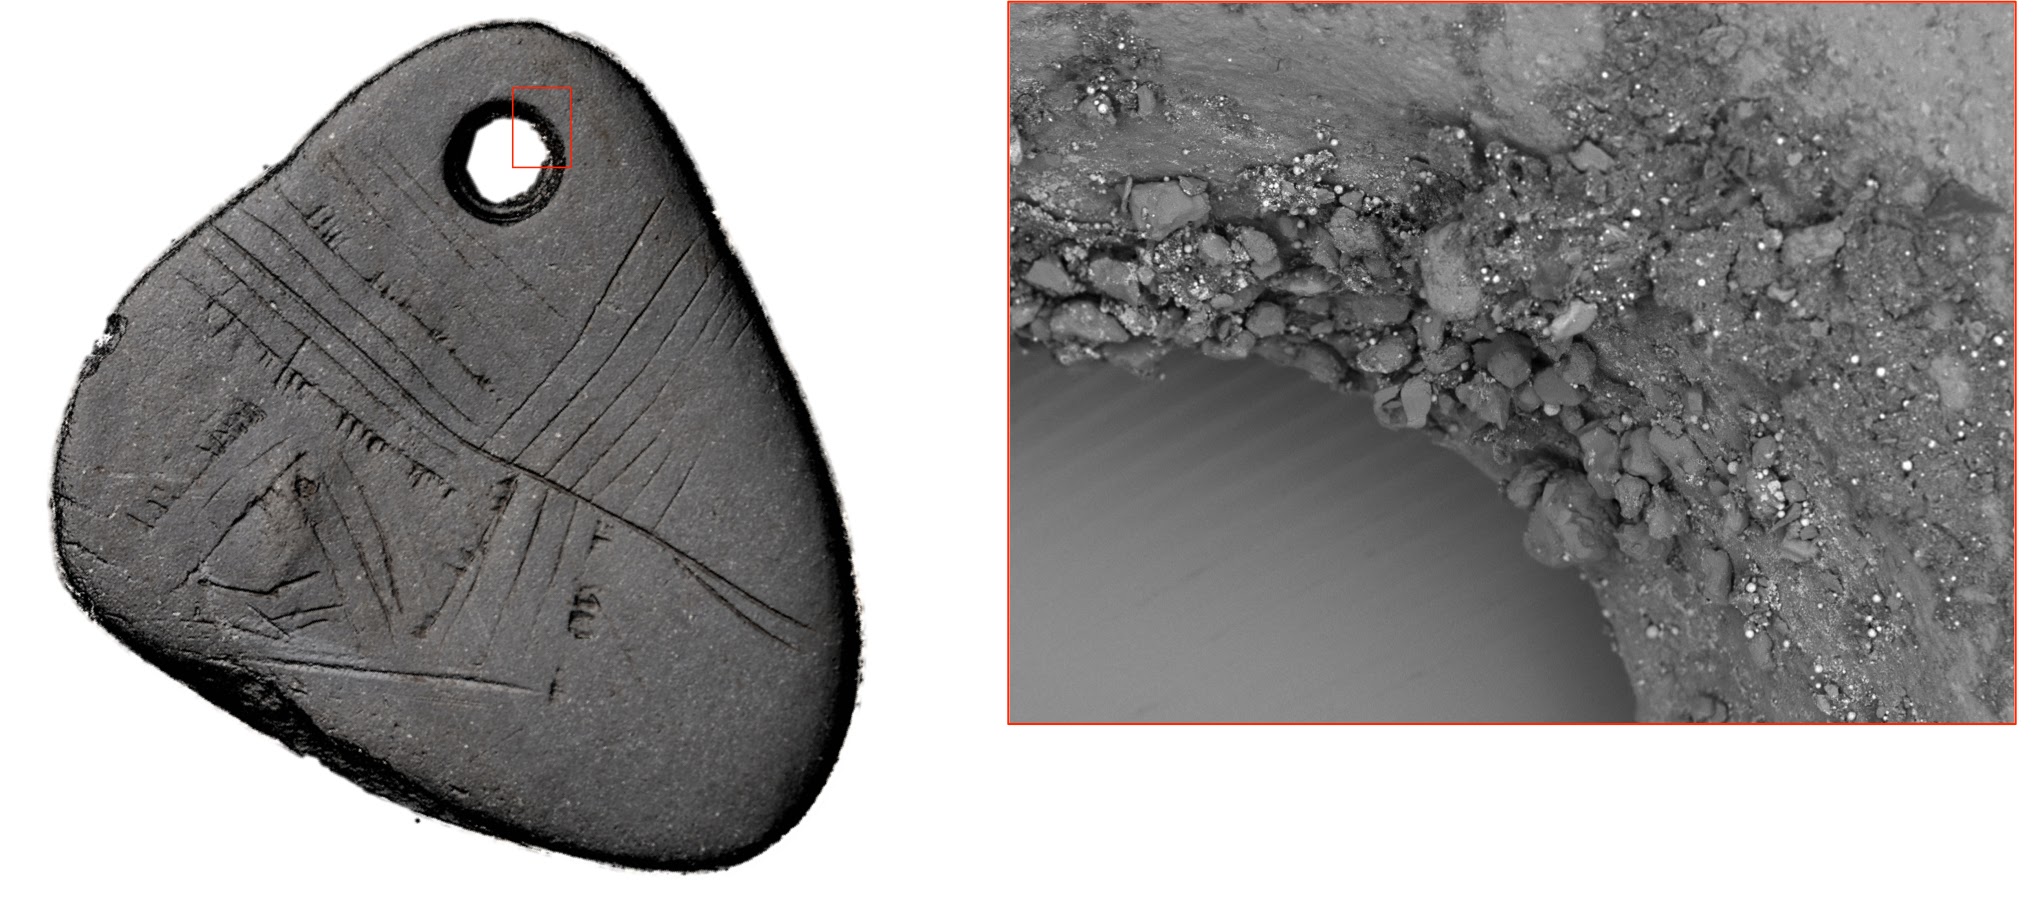
Clear and white translucent globular crystals were located within the perforation of the pendant. These crystals were not angular, but show what appears to be weathering as their edges are rounded (Figures 29 and 30).
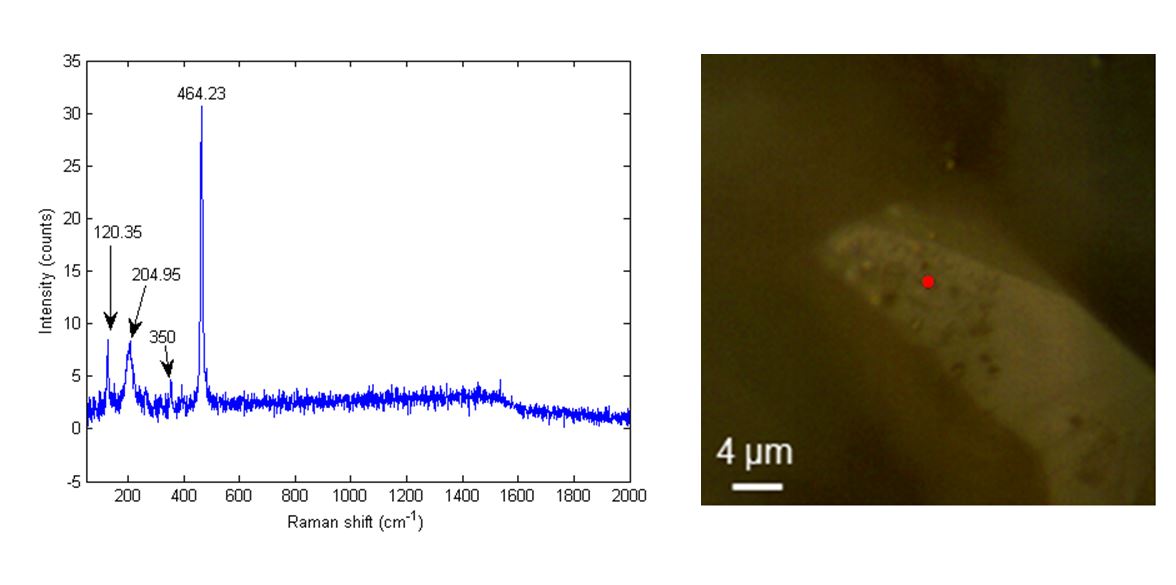
These crystals were investigated with Micro-Raman. Good-quality spectra with minimal noise and fluorescence were able to be obtained on the smooth surface of one of these crystals (Figure 31). According to Kingma and Hemley (1994, 270), the most prominent Raman band in quartz (SiO2) is located at 465cm-1, which is detected in our spectrum at around 464cm-1. The Handbook of Mineral Raman Spectra (Anon. 2000), quotes 464cm-1 as the most intense frequency of powdered quartz, matching the major peak we obtained. Less intense bands related to the Raman assignment of quartz were also detected in our spectrum as indicated.
In conclusion, the Raman spectrum matches closely with reference spectra for quartz. Clear crystals that were hexagonal in two dimensional outline were also noted in one of the soil samples, although no suggestion can be made as to their chemical nature. No quartz crystals similar in appearance to those found within the hole of the pendant were able to be located in the soil samples. However, it should be noted that only two soil samples from the context were analysed. Also, no soil samples that were in direct contact with the pendant were taken at the time of excavation, and thus it is possible that this surrounding area may have contained the same quartz sand as found within the hole.
The reason for the quartz in the perforation is not clear. One possibility is that the sand had been used in the manufacture of the hole; however, experiments over the last year on shale have shown that because shale is a soft stone it is very easy to create a hole with a flint tool, such as a stone drill (mèche de foret), and therefore sand would not be necessary.
The origin of this sand remains an enigma: quartz crystals were not found anywhere else on the pendant nor within the soil samples analysed. However, sand is present on the site, and in some cases within areas of the peat because it has washed down from the dry land. Therefore, it may be that fine sand has settled within the hole as part of the deposition process, perhaps even because the lake water has filtered through this hole.