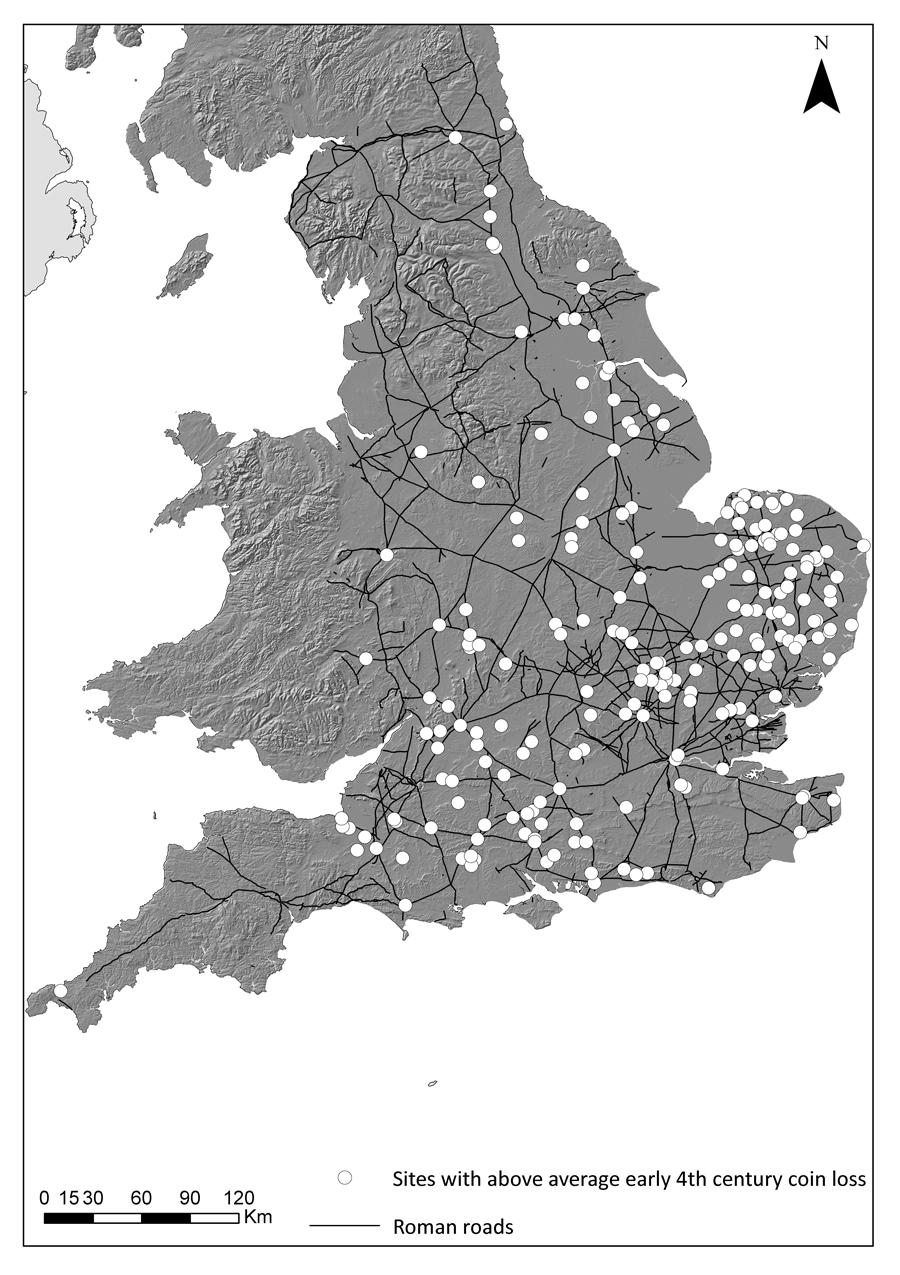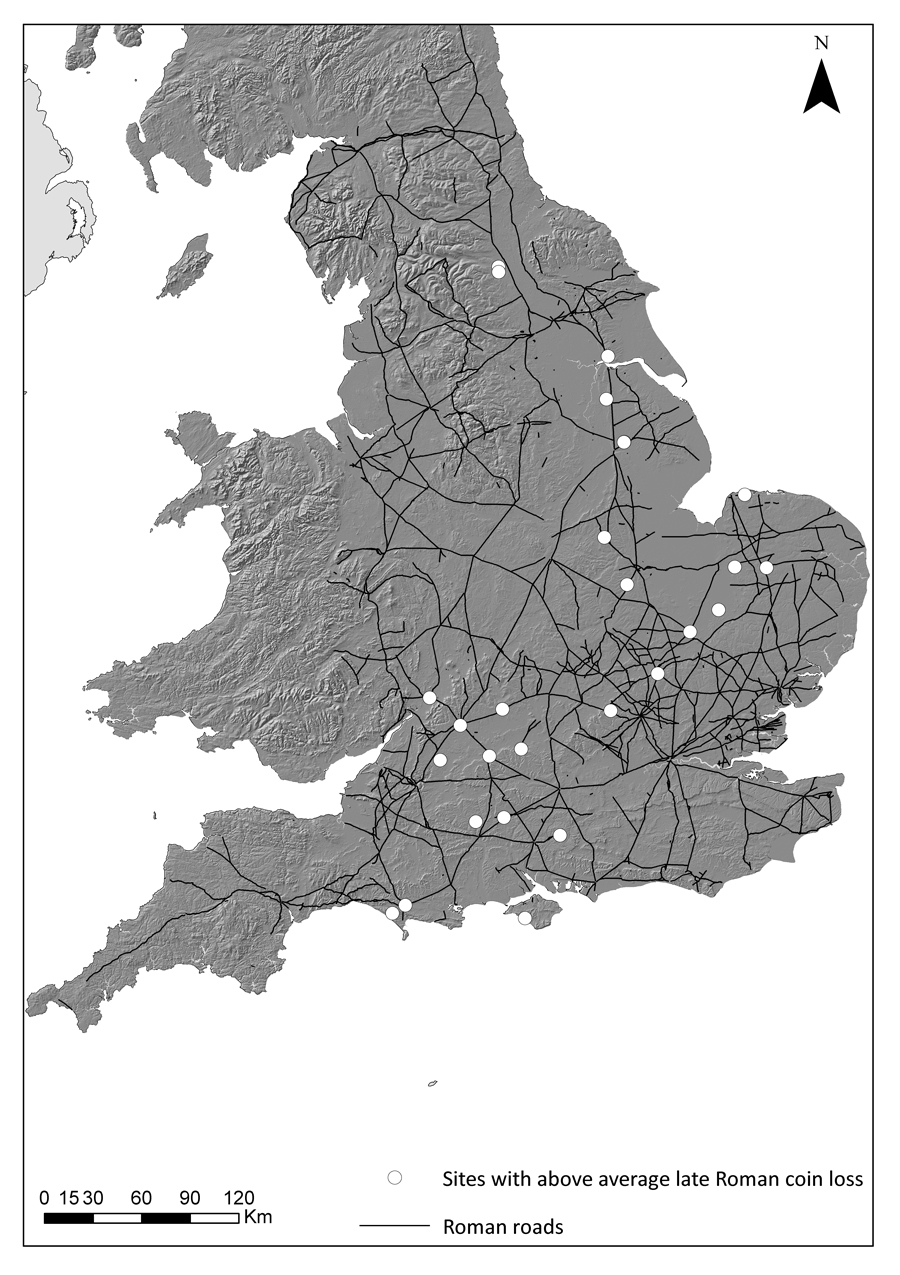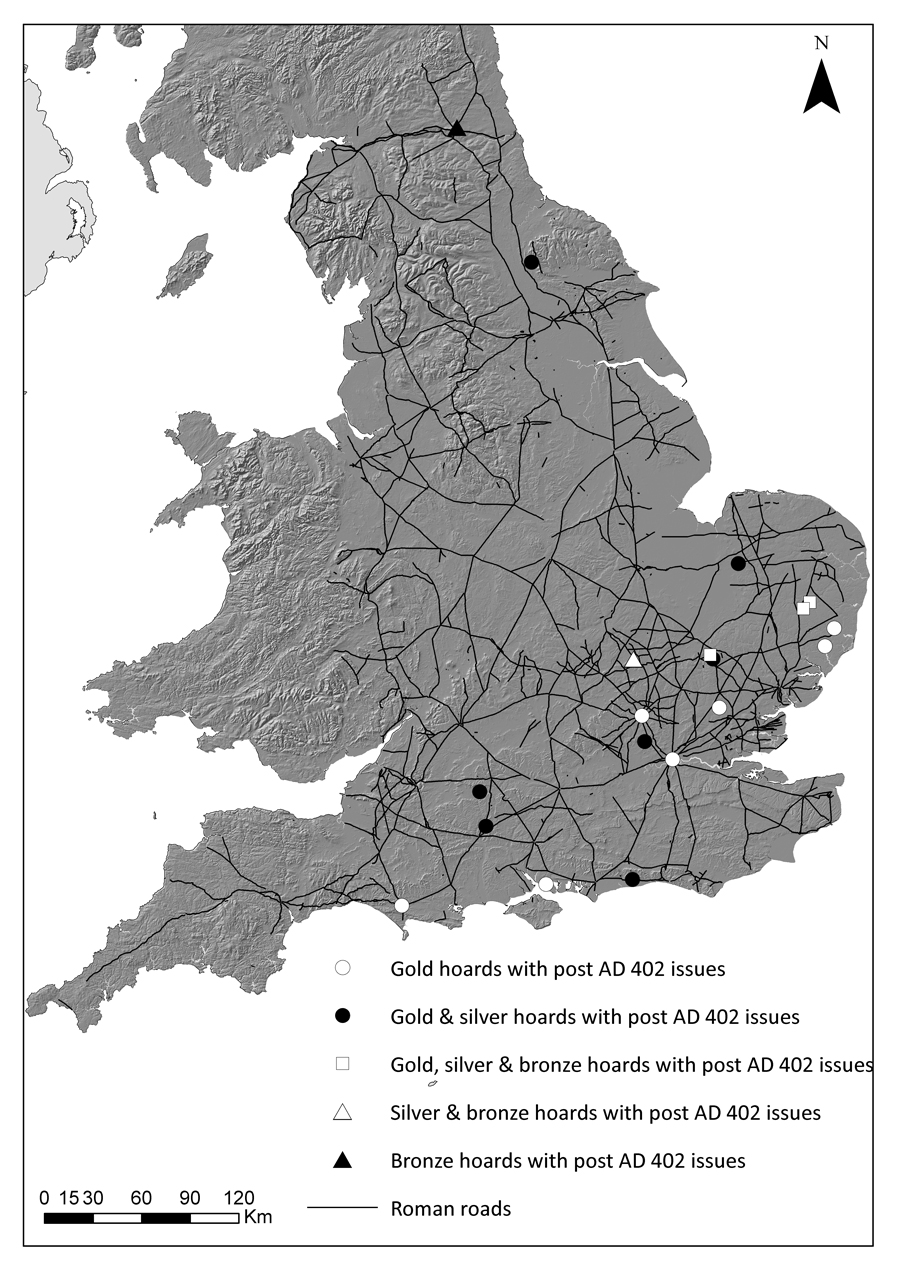
The distribution pattern of coinage issued in the early 5th century and found in Britain is restricted. Gold coins of the late 4th century AD are found as far afield as Corbridge in Northumberland and Holyhead in Anglesey (Bland and Loriot 2010, 42-3, figs 33-34) whereas 5th-century pierces are largely confined to the south-east, with concentrations from Kent to East Anglia, and in the south from West Sussex and the Isle of Wight to Dorset (Figures 1 and 2) The majority of late Roman gold coins come from military or urban contexts (Bland and Loriot 2010, 54, table 12).

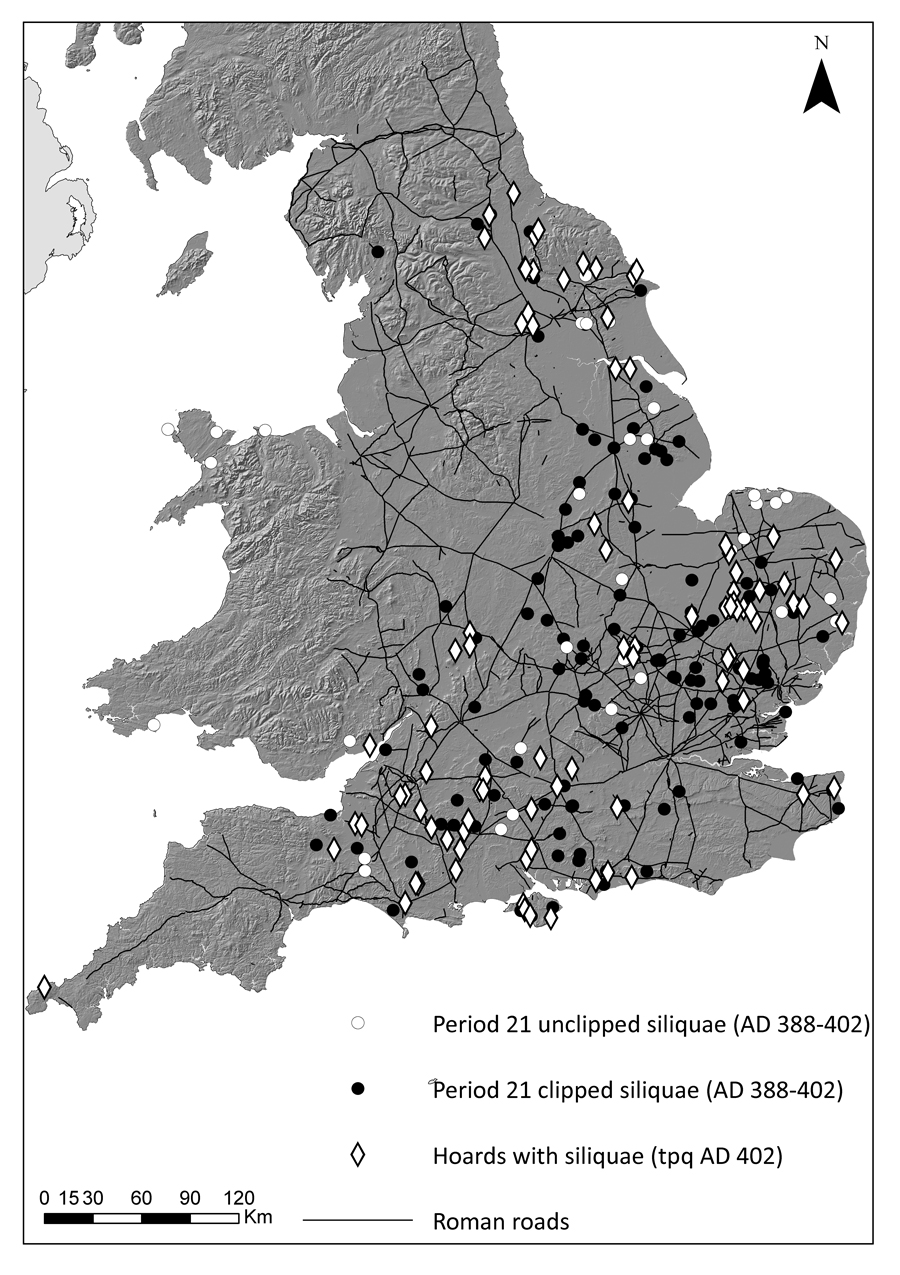
The majority of Theodosian siliquae and clipped siliquae are also found in southern Britain (Figure 3) in the 'lowland' zone to the south and east of the Fosse Way with an extension into East and parts of North Yorkshire. Finds in Devon and Cornwall, Wales, the west Midlands and the north-west and north-east are rare. Interestingly, hoards and stray finds of siliquae are common in rural areas, with very few specimens being found as site-finds on military or urban excavations; Richborough, and possibly Cirencester, are the notable exceptions (Reece 1972, table 1a).
Indeed, the distribution of nummi is in marked contrast to the distribution of siliquae. Although on excavations, stray finds of bronze nummi far outweigh the number of silver siliquae (316:1 at Richborough; Table 2), the rural dataset provided by the PAS shows a much larger proportion of siliquae to nummi. This suggests that siliquae were more common in the countryside than on urban sites. This may be because detectorists do not report these small and often virtually illegible coins, but the authors' experience of dealing with large, complete, rural assemblages does seem to suggest that the finding is valid. It is possible that silver coinage circulated in rural areas because of its intrinsic value, whereas bronze nummi only played a role in the economic spheres of urban and/or military life.
One can also question whether the finds of nummi (whether as hoards or site finds) at certain urban centres, for example Dorchester-on-Thames and Canterbury, are intimately linked with a military presence (Moorhead, Anderson and Walton in press; Wacher 1995, 203-5; Burnham and Wacher 1990, 121-2). In this regard, it is interesting to note that a large number of major assemblages and hoards of Theodosian bronze coins are found in coastal or estuarine regions. Does this suggest strong links still existed between the Continent and major centres in Britain that were easily accessible from the sea? Interestingly, in the Netherlands and Belgium, after a lacuna of coin-loss in the mid-4th century, there is a sudden, albeit short-lived, spate of hoarding of Theodosian bronze coins in the late 4th and early 5th centuries. Perhaps the Roman authorities were trying to maintain maritime links between centres in southern Britain and the Rhineland (Moorhead, Anderson and Walton in press; Stroobants 2013).
| Assemblage | Reference | Nummi | Siliquae | Ratio |
|---|---|---|---|---|
| Richborough | Reece 1991 | 22,750 | 72 | 316:1 |
| Non-Richborough sites | Reece 1973 | 1,949 | 103 | 189:1 |
| Caerwent | Guest and Wells 2007 | 3463 | 1 | 3463:1 |
| Wales, non-Caerwent | Guest and Wells 2007 | 63 | 6 | 10.5:1 |
| PAS England | http://www.finds.org.uk queried 12.12.2012 | 1,004 | 271 | 3.7:1 |