Figure 1: Map of Asia Minor with the places mentioned in the text. 1 = Assos, 2 = Ephesos, 3 = Magnesia, 4 = Tralleis, 5 = Mastaura, 6 = Brioula, 7 = Antiochia in Pisidia, 8 = Malos, 9 = Seleukia Sidera, 10 = Prostanna, 11 = Sagalassos, 12 = Perge, 13 = Tarsos, 14 = Aigai, 15 = Rhosos. Source: author.
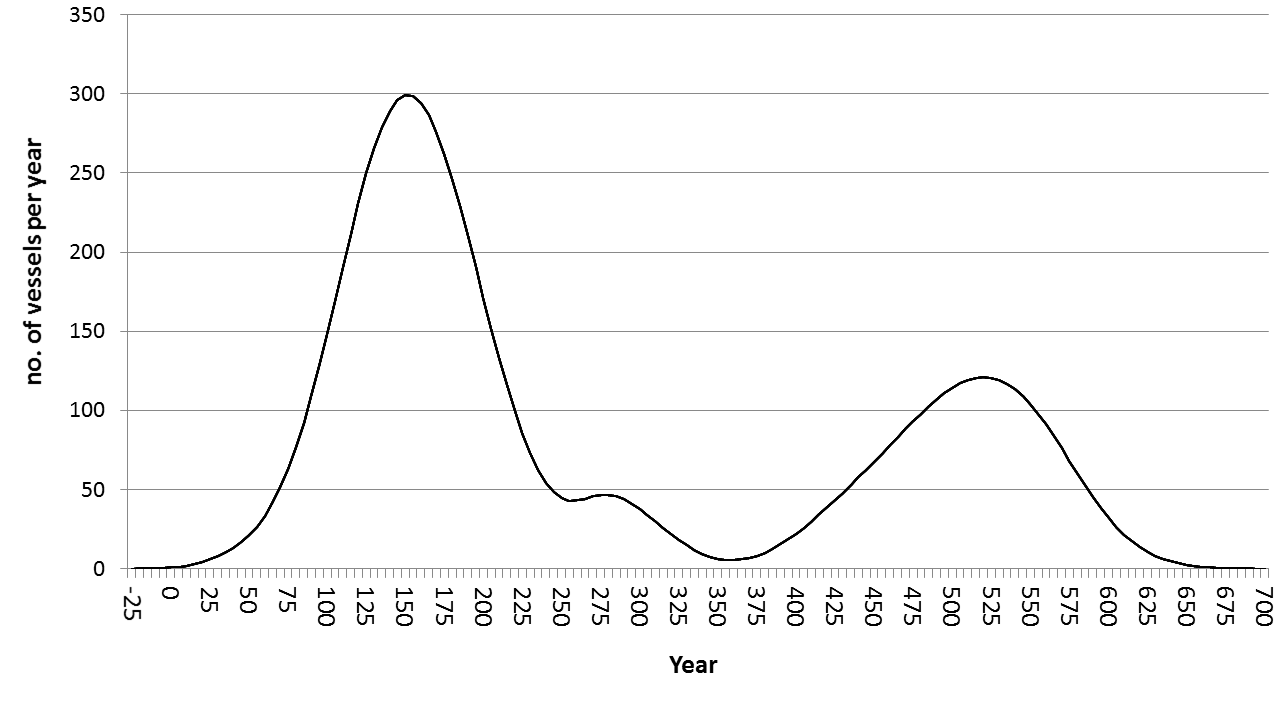
Figure 2: Gaussian diachronic data distribution of Sagalassos Red Slip Ware (n=53,695) recovered at Sagalassos over the entire period of production. The horizontal axis shows the year, with negative values indicating years BCE. The vertical axis represents the number of projected vessels per year as distributed by the Gaussian data distribution method. See Willet (2014) for details of methodology.
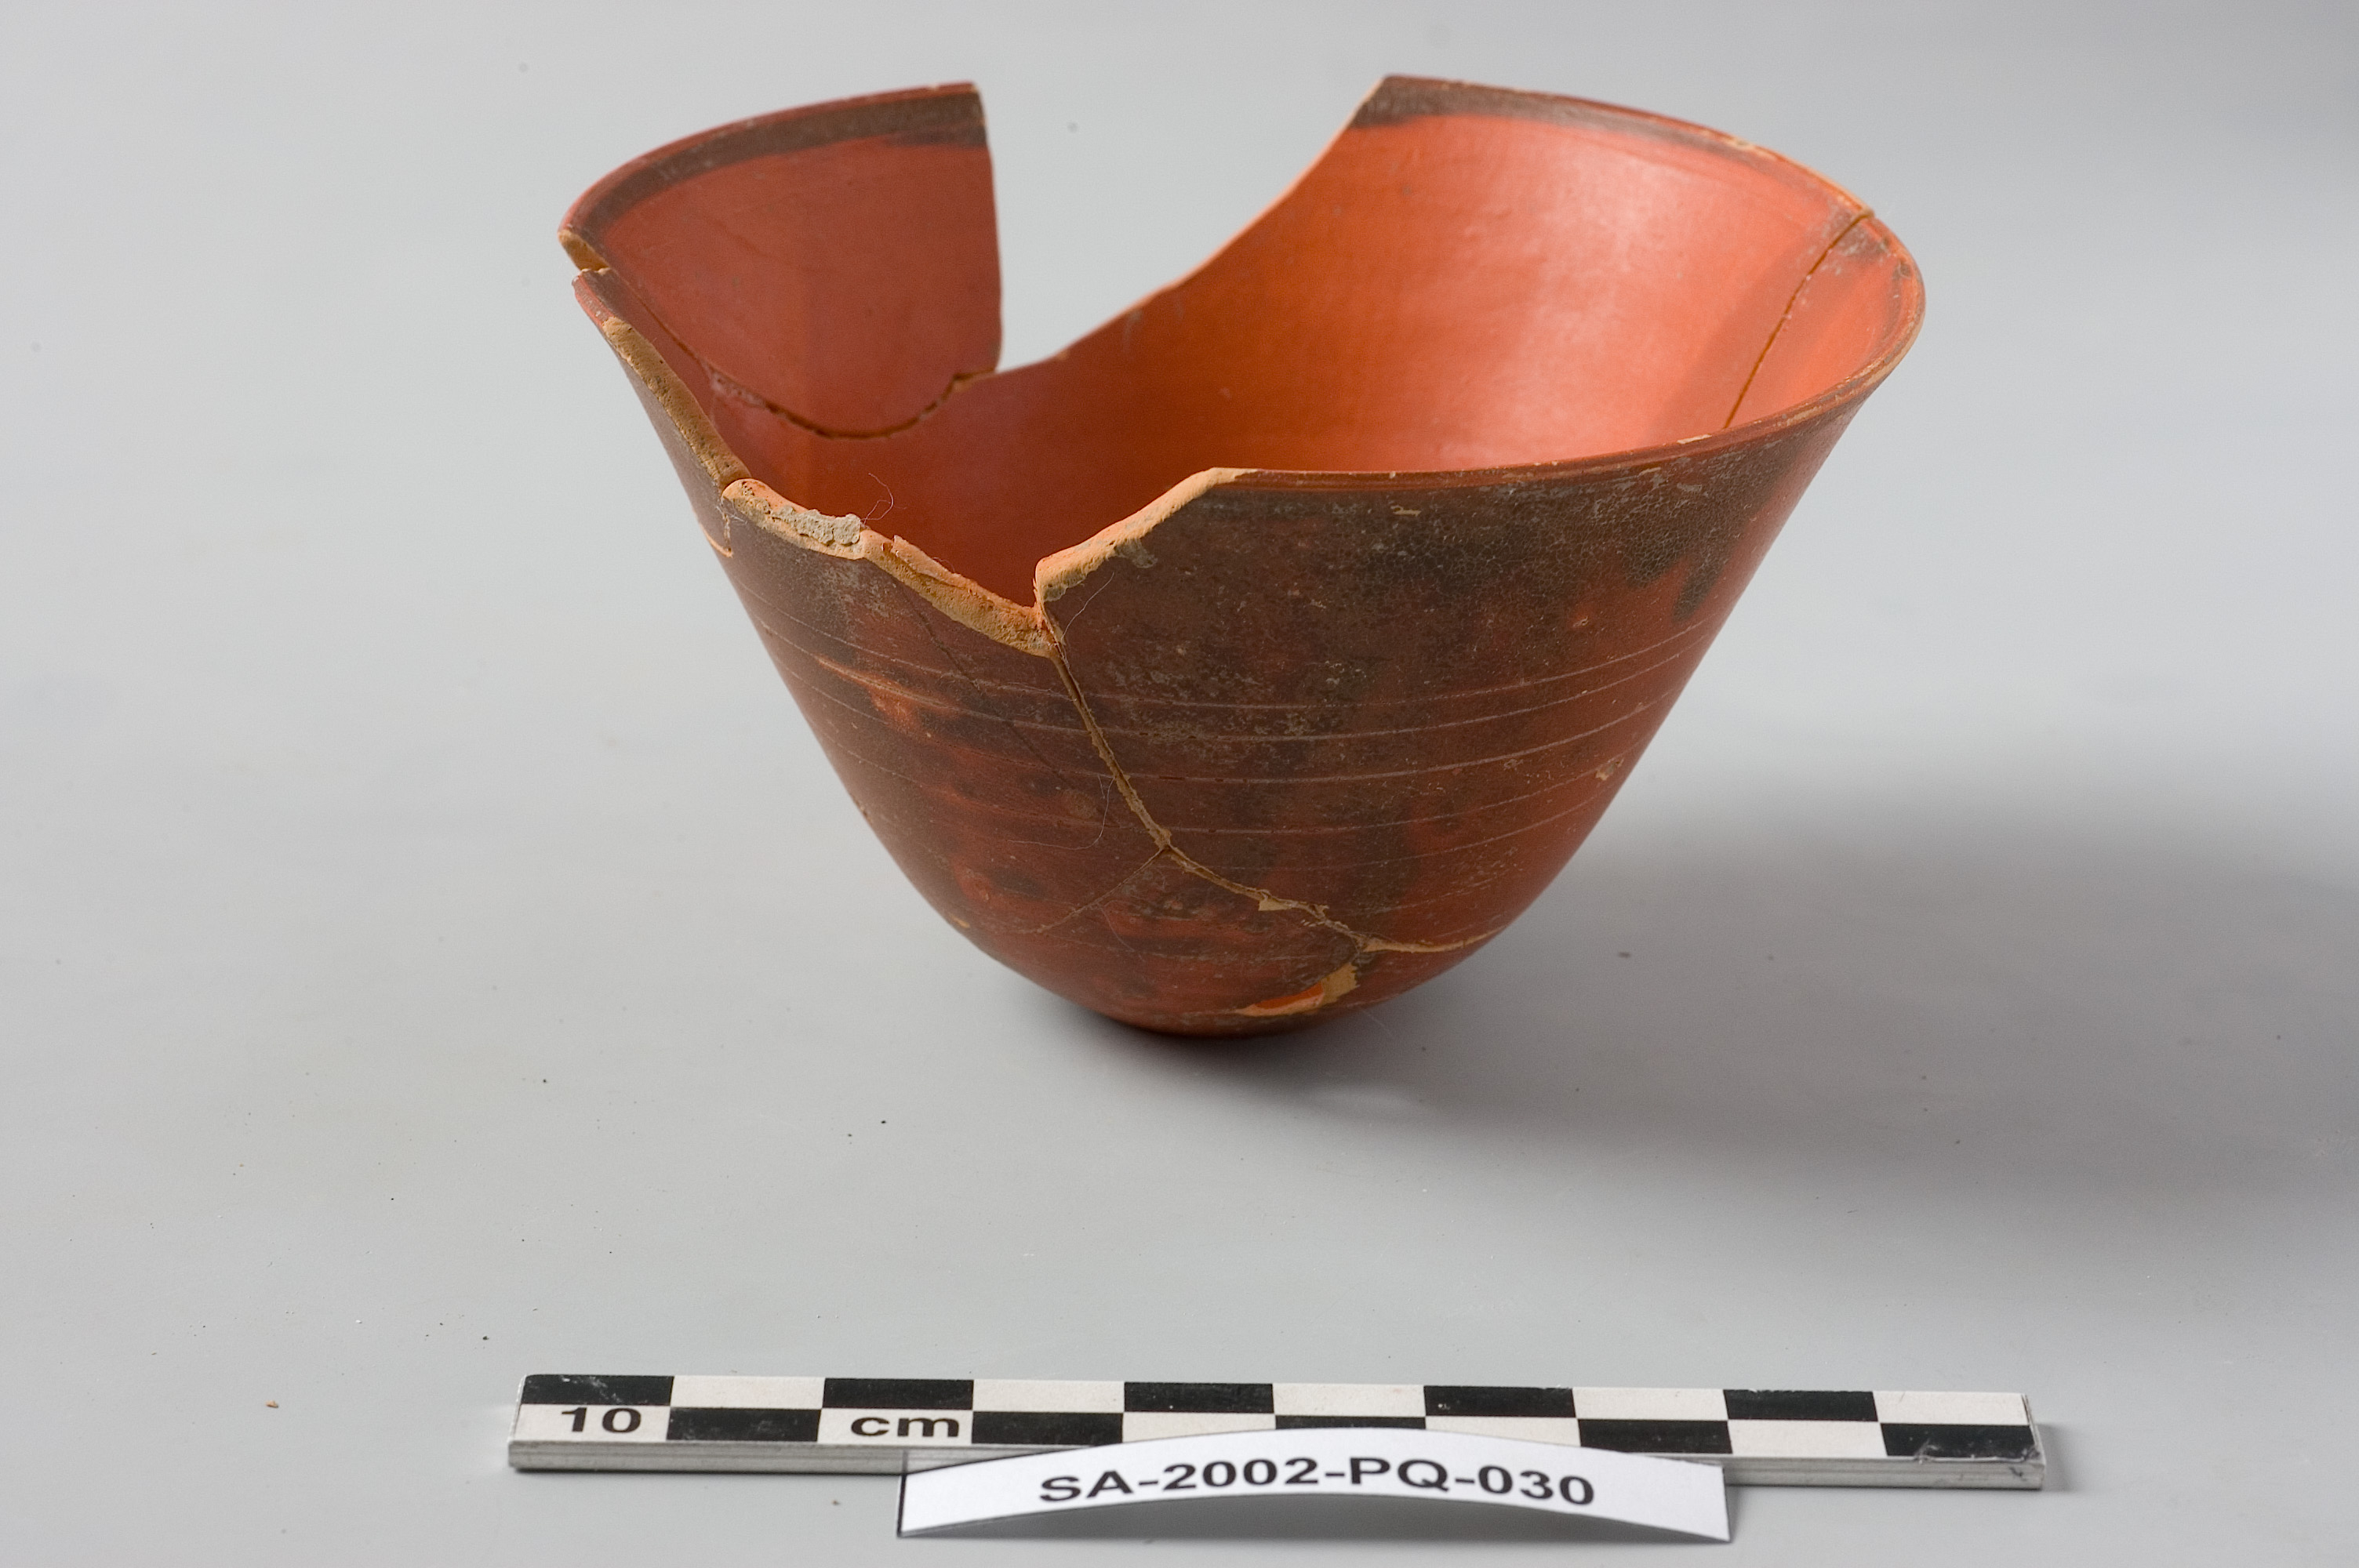
Figure 3: Photograph of Sagalassos Red Slip Ware container Form 1F150. Source: Sagalassos Archaeological Research Project.
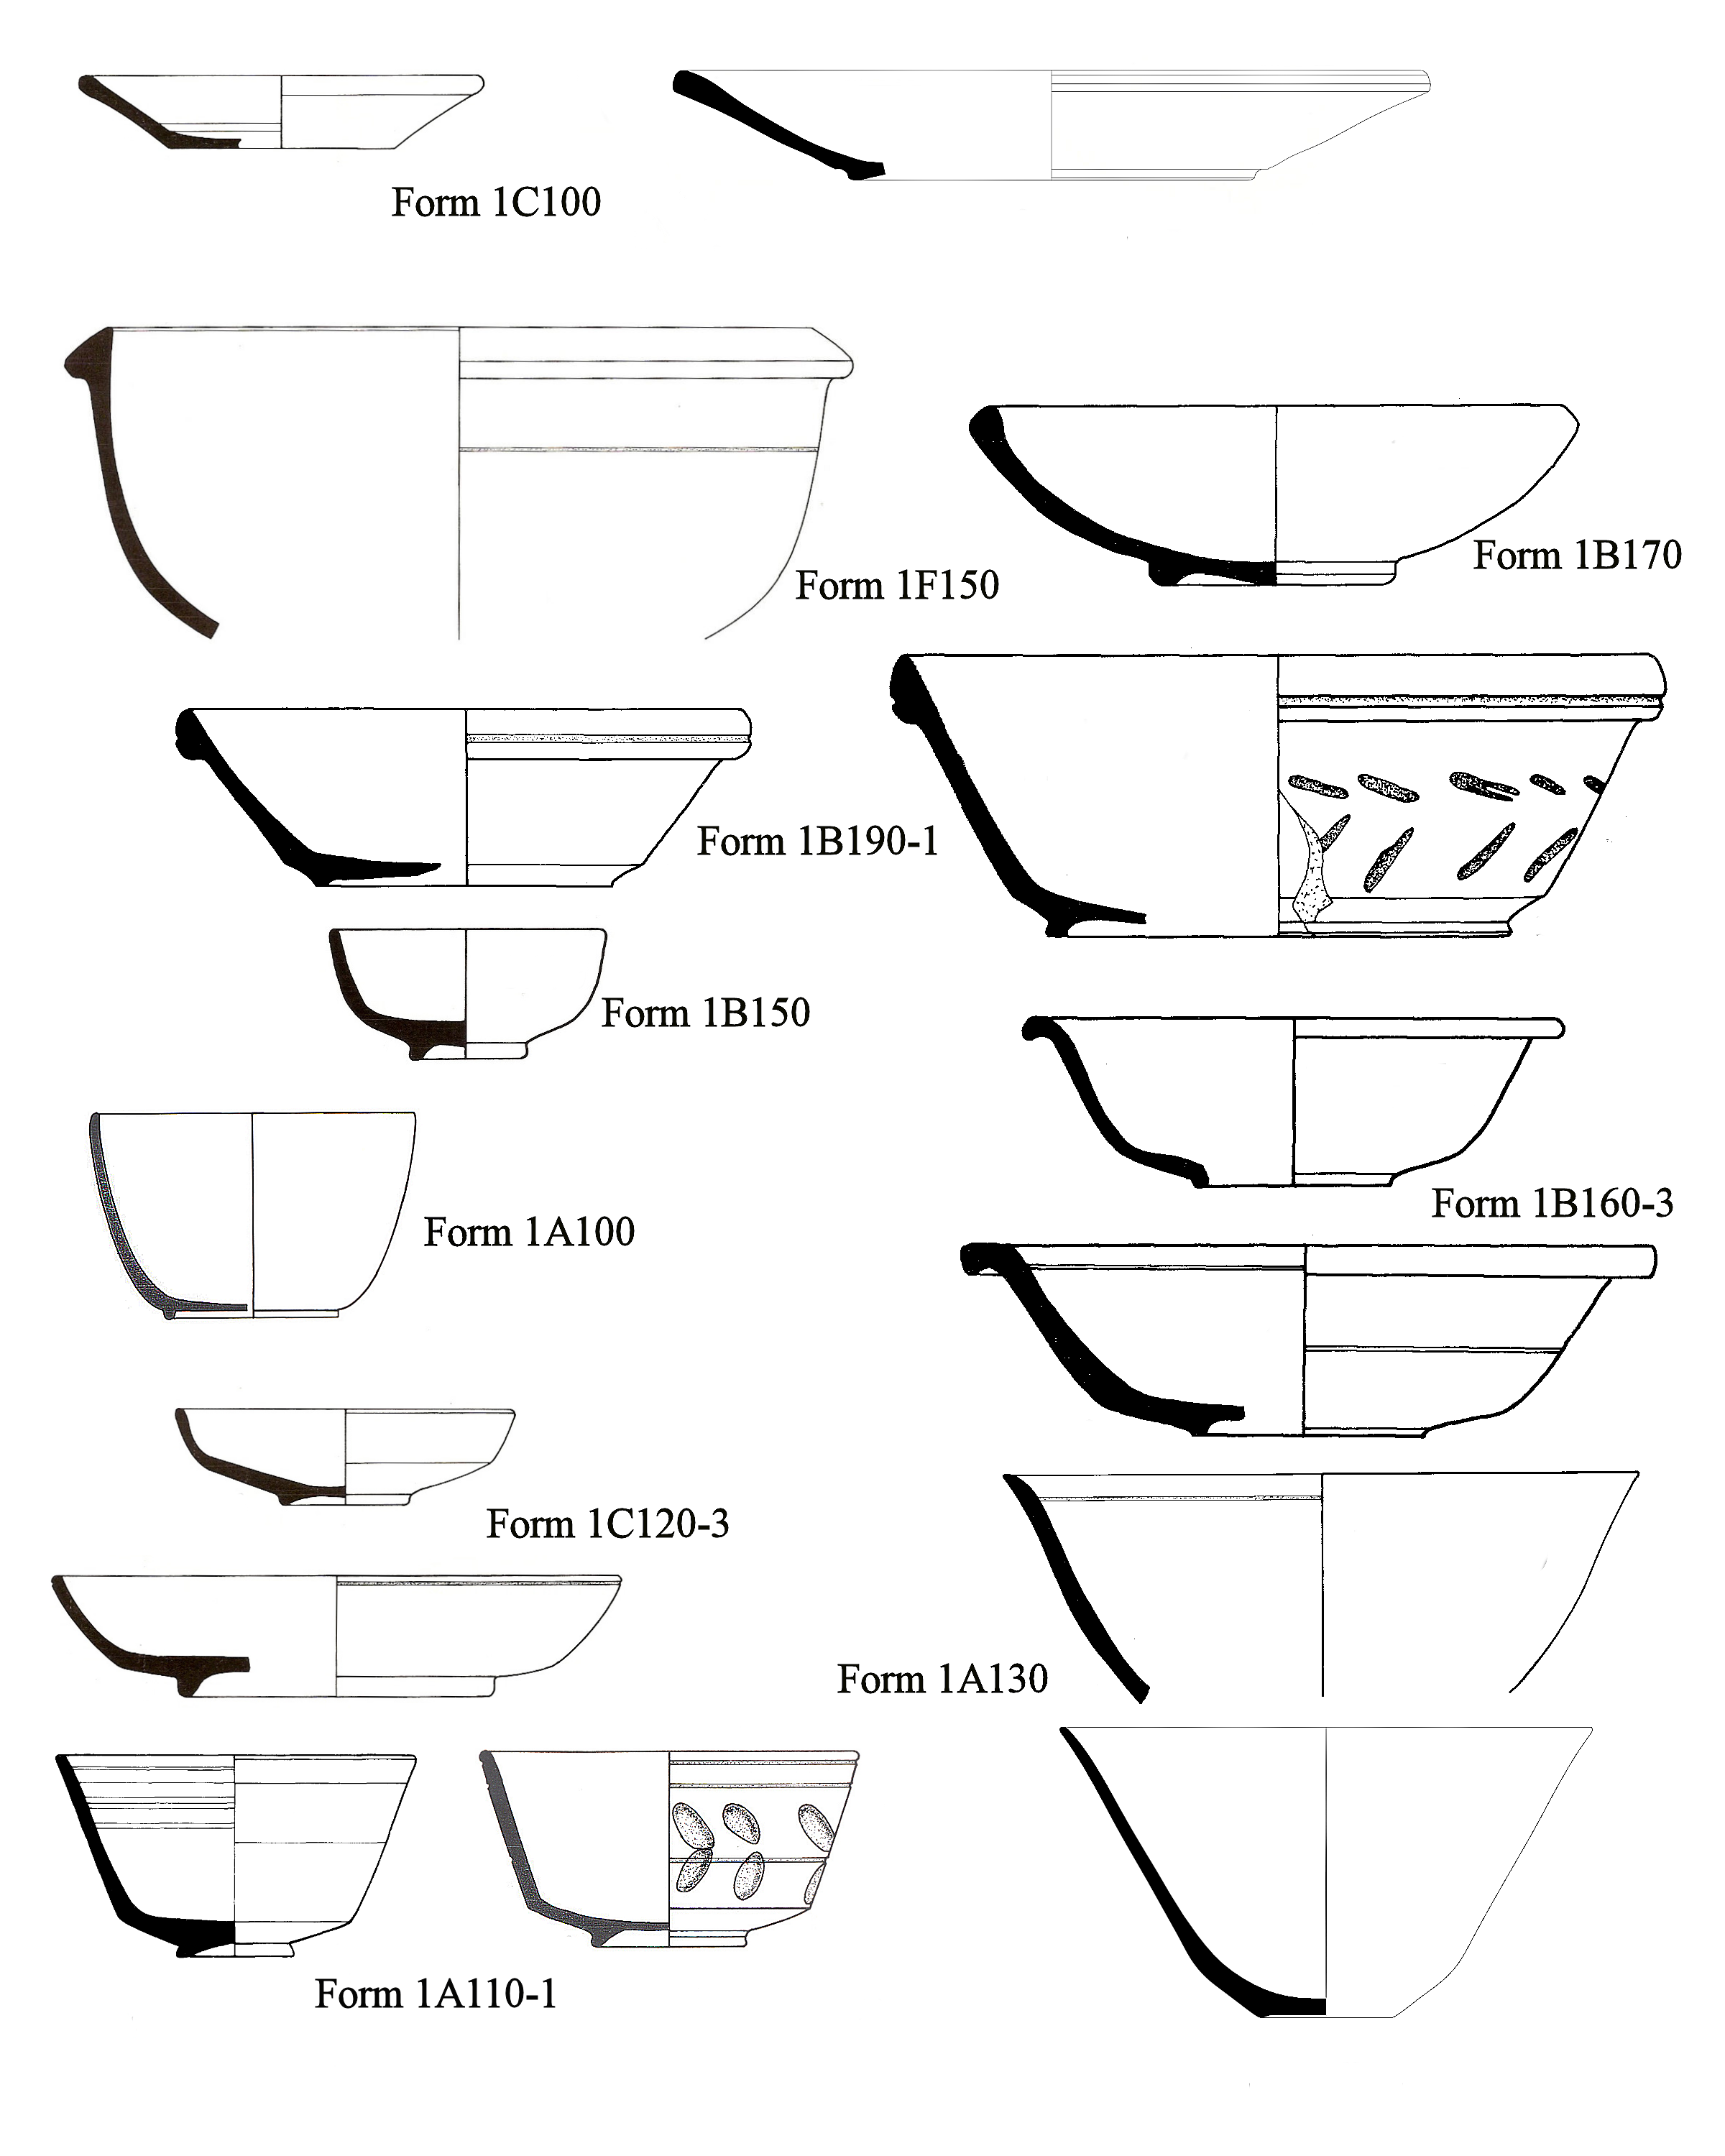
Figure 4: Most common forms of Sagalassos Red Slip Ware at the peak of the Gaussian curve at CE 150. Not to scale. Source drawings: Sagalassos Archaeological Research Project.
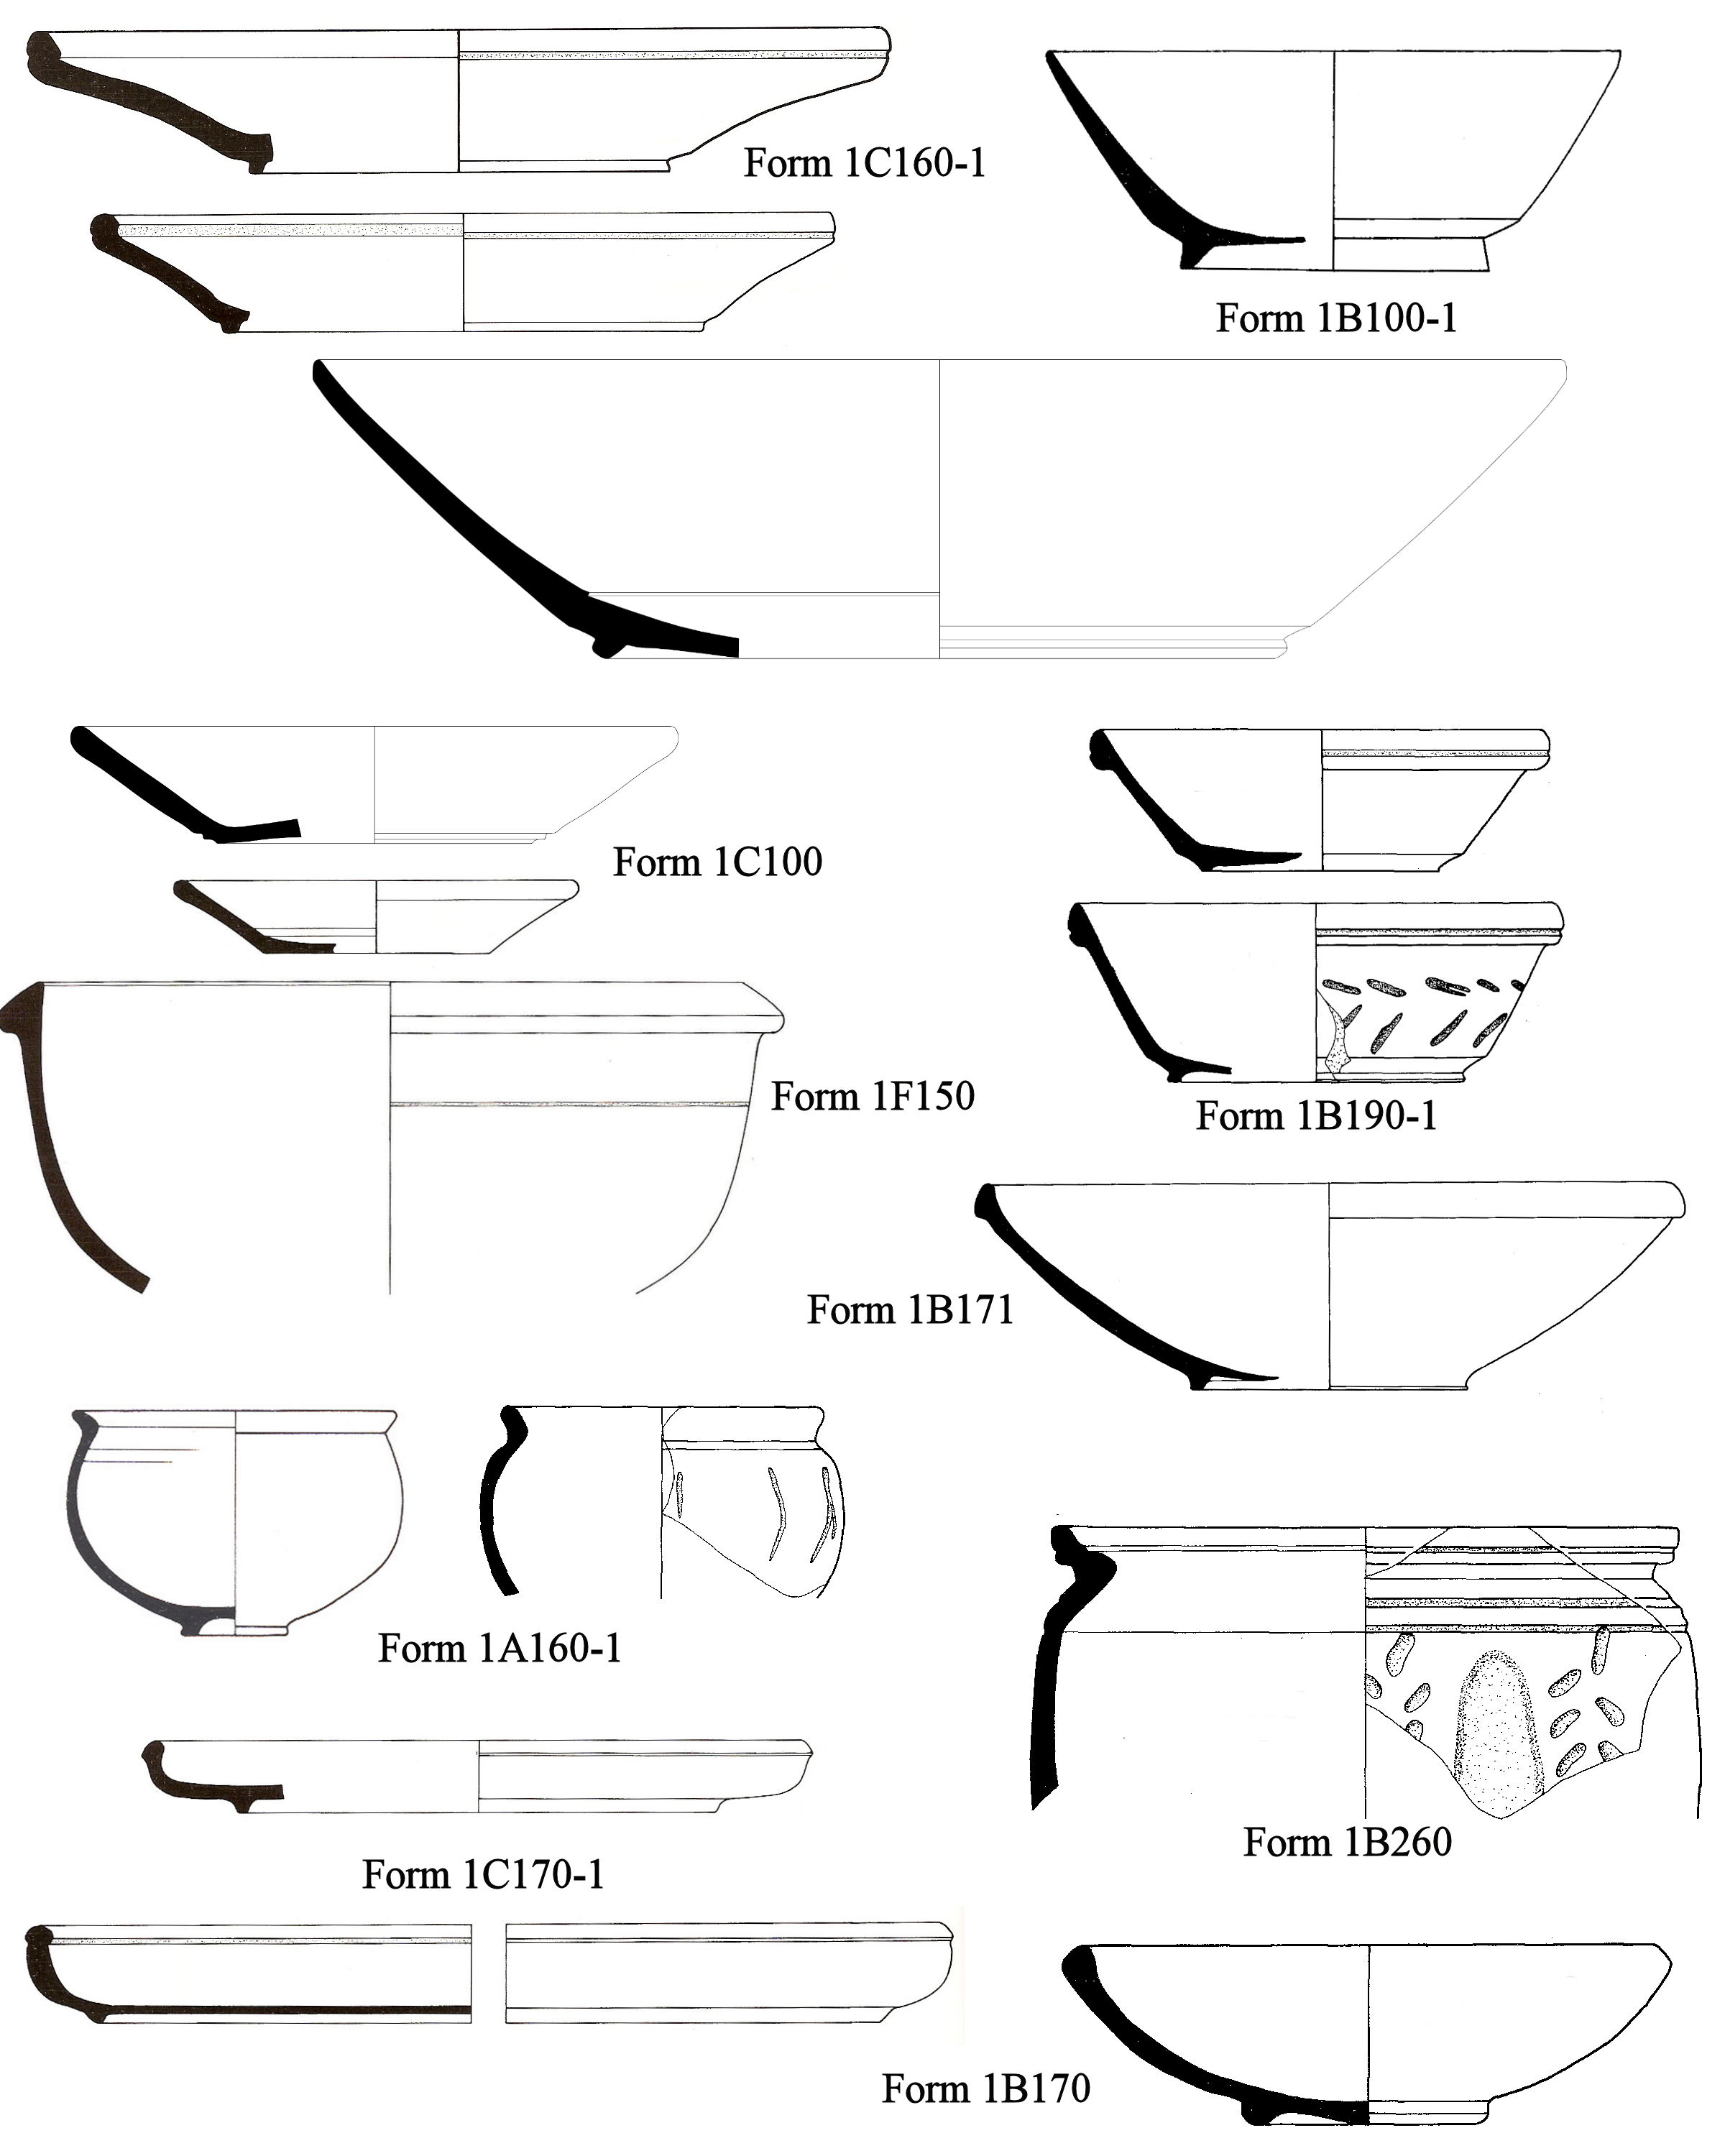
Figure 5: Most common forms of Sagalassos Red Slip Ware at the peak of the Gaussian curve at CE 280. Not to scale. Source drawings: Sagalassos Archaeological Research Project.
Figure 6: Photograph of Sagalassos Red Slip Ware mastos Form 1A130. Source: Sagalassos Archaeological Research Project.
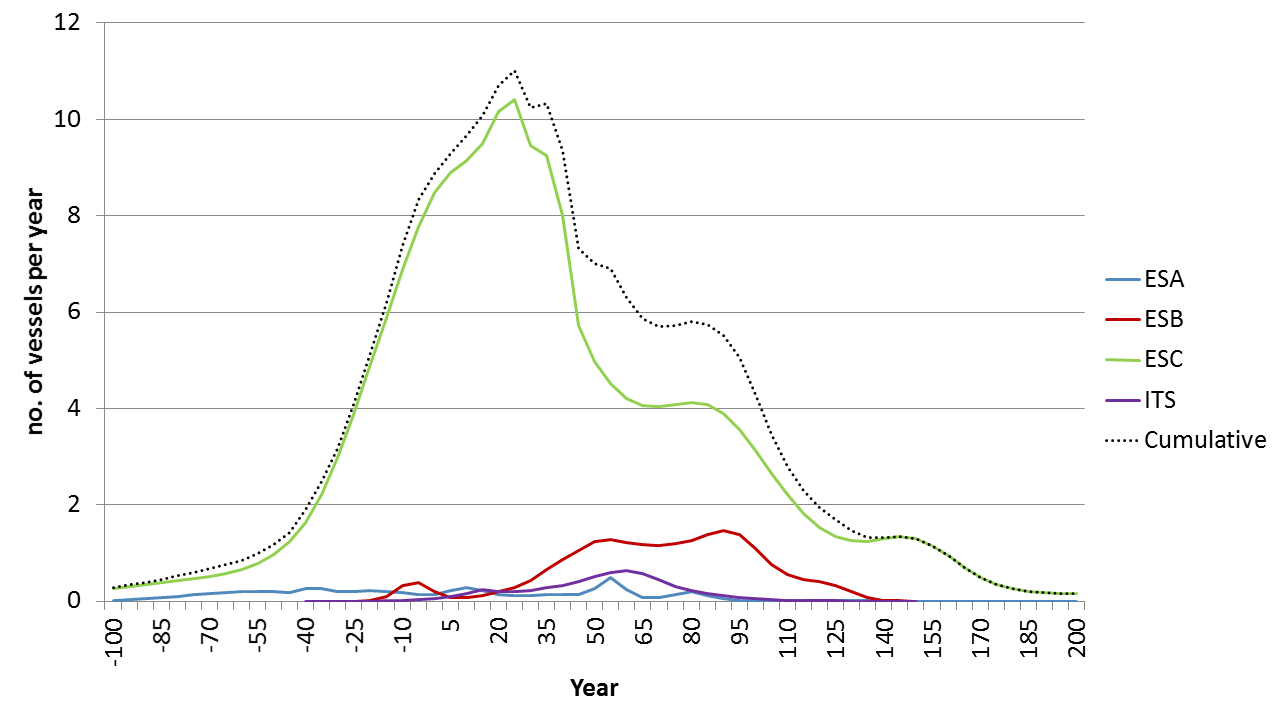
Figure 7: Gaussian diachronic data distribution for ESA, ESB, ESC and ITS from 100 BCE to CE 200 as recorded at Assos. ESD is not recorded for this site. The horizontal axis shows the year, with negative values indicating years BCE. The vertical axis represents the number of projected vessels per year as distributed by the Gaussian data distribution method. See Willet (2014) for details of methodology.
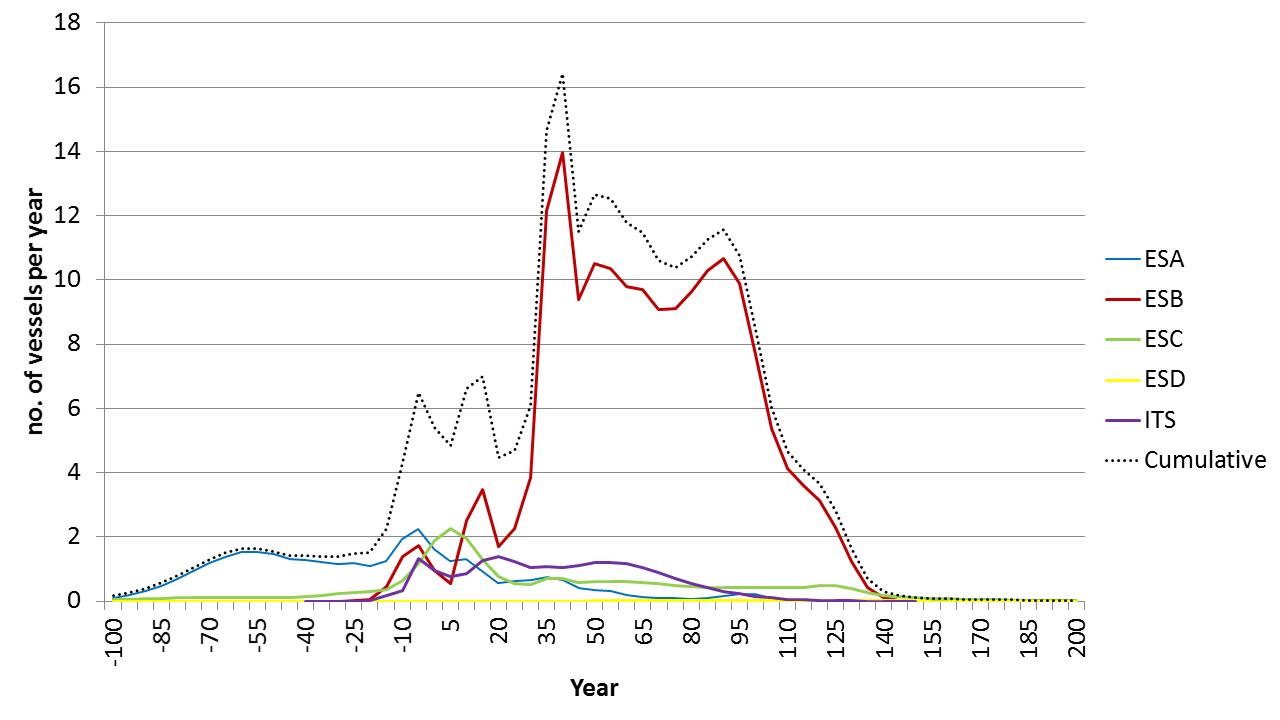
Figure 8: Gaussian diachronic data distribution for ESA, ESB, ESC, ESD and ITS from 100 BCE to CE 200 as recorded at Ephesos. The horizontal axis shows the year, with negative values indicating years BCE. The vertical axis represents the number of projected vessels per year as distributed by the Gaussian data distribution method. See Willet (2014) for details of methodology.
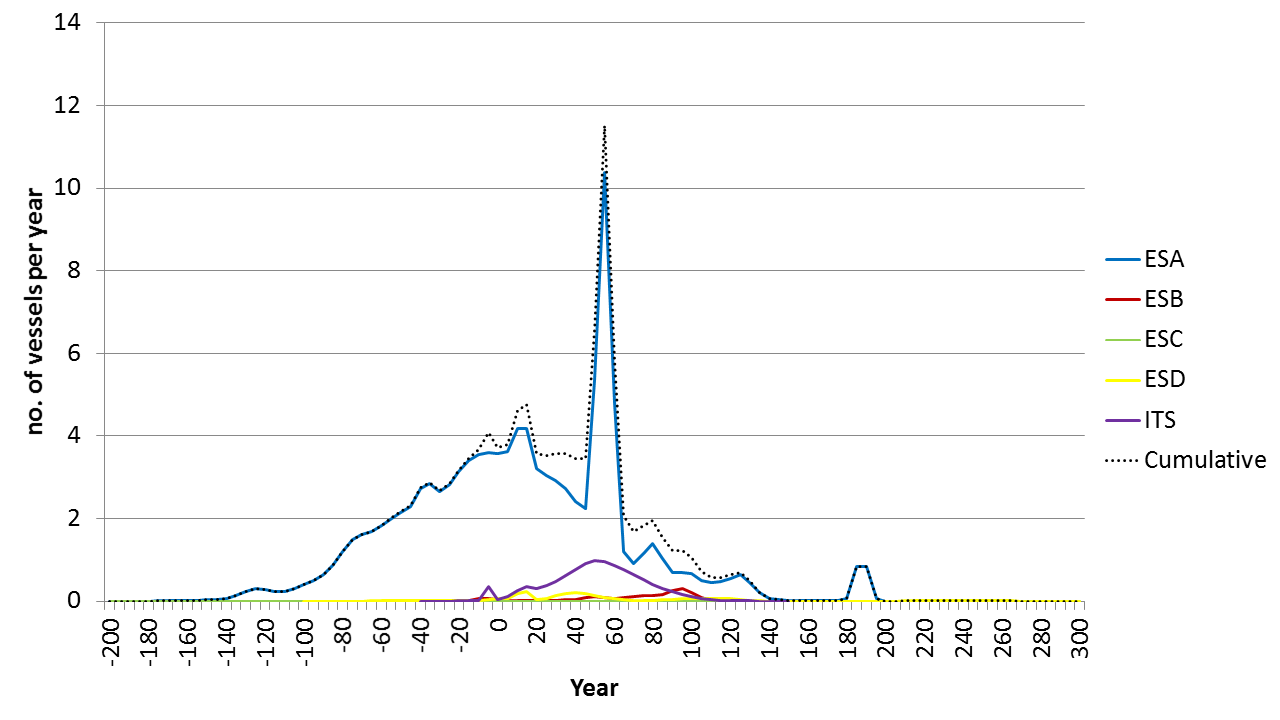
Figure 9: Gaussian diachronic data distribution for ESA, ESB, ESD and ITS from 100 BCE to CE 200 as recorded at Tarsos. ESC is not recorded for this site. The horizontal axis shows the year, with negative values indicating years BCE. The vertical axis represents the number of projected vessels per year as distributed by the Gaussian data distribution method. See Willet (2014) for details of methodology.
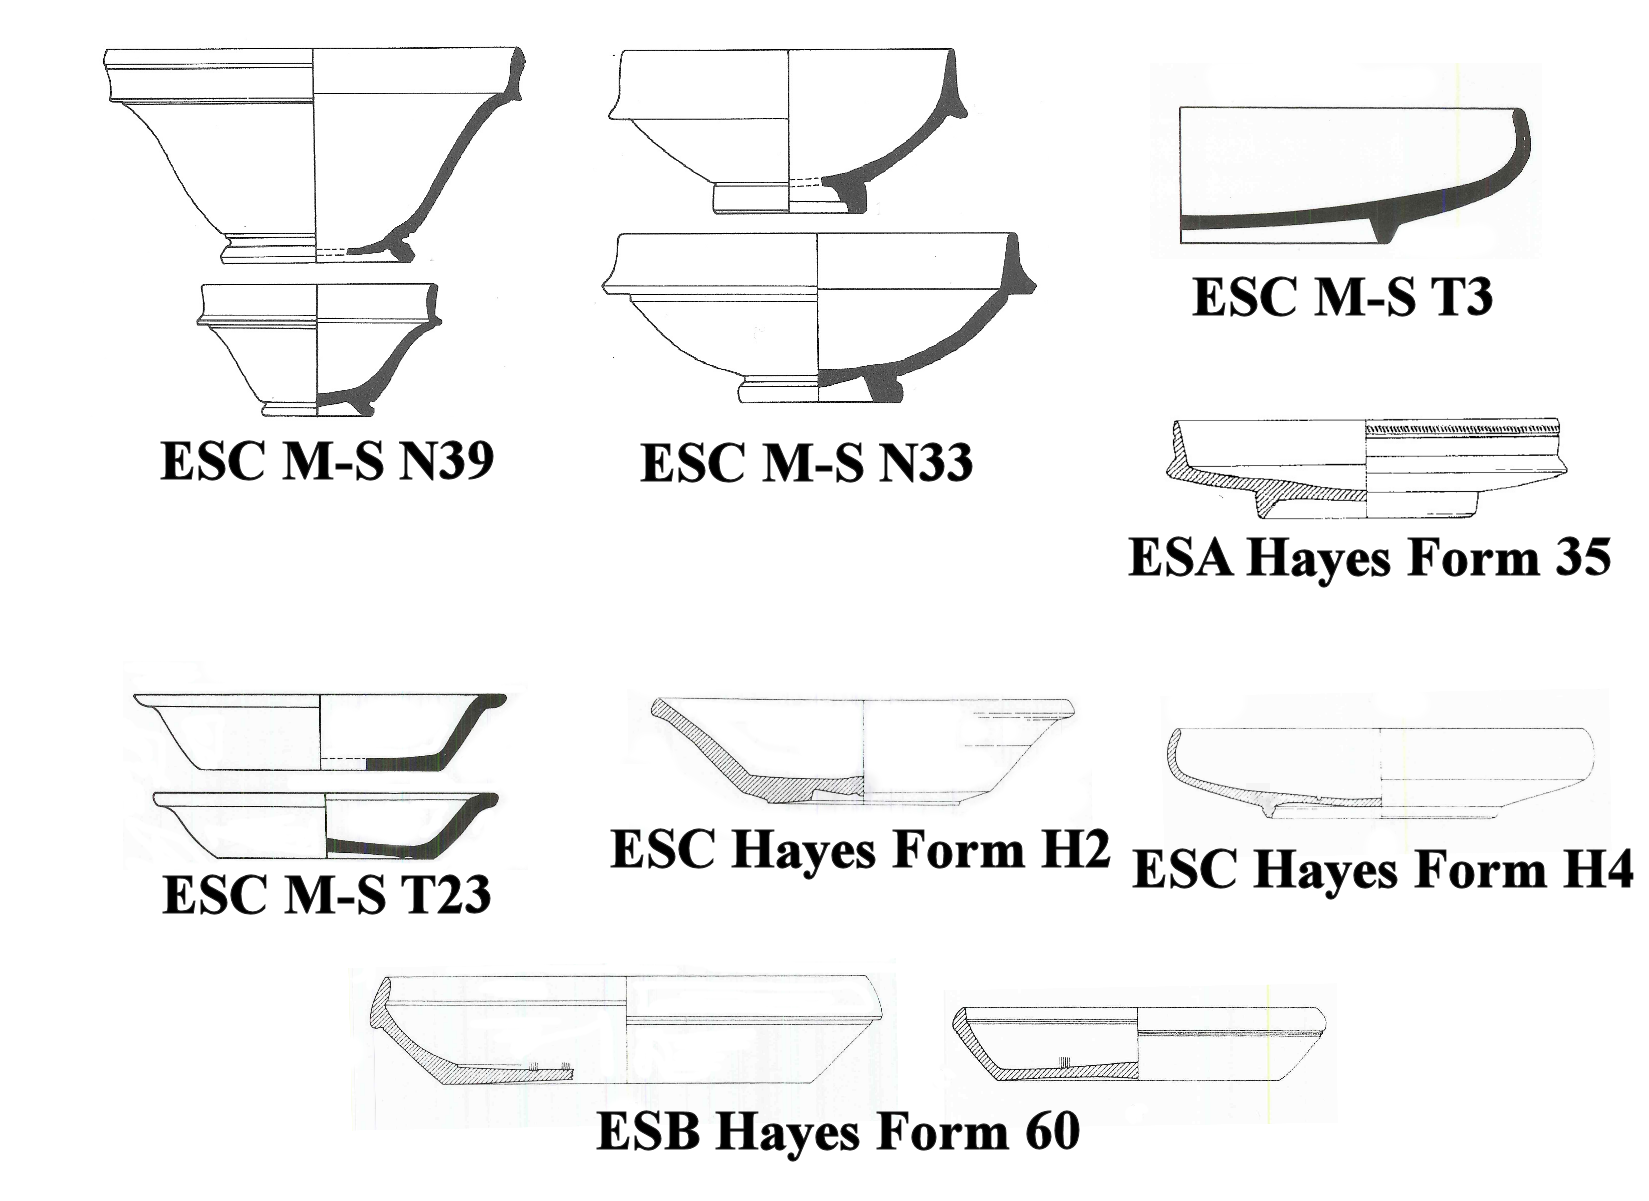
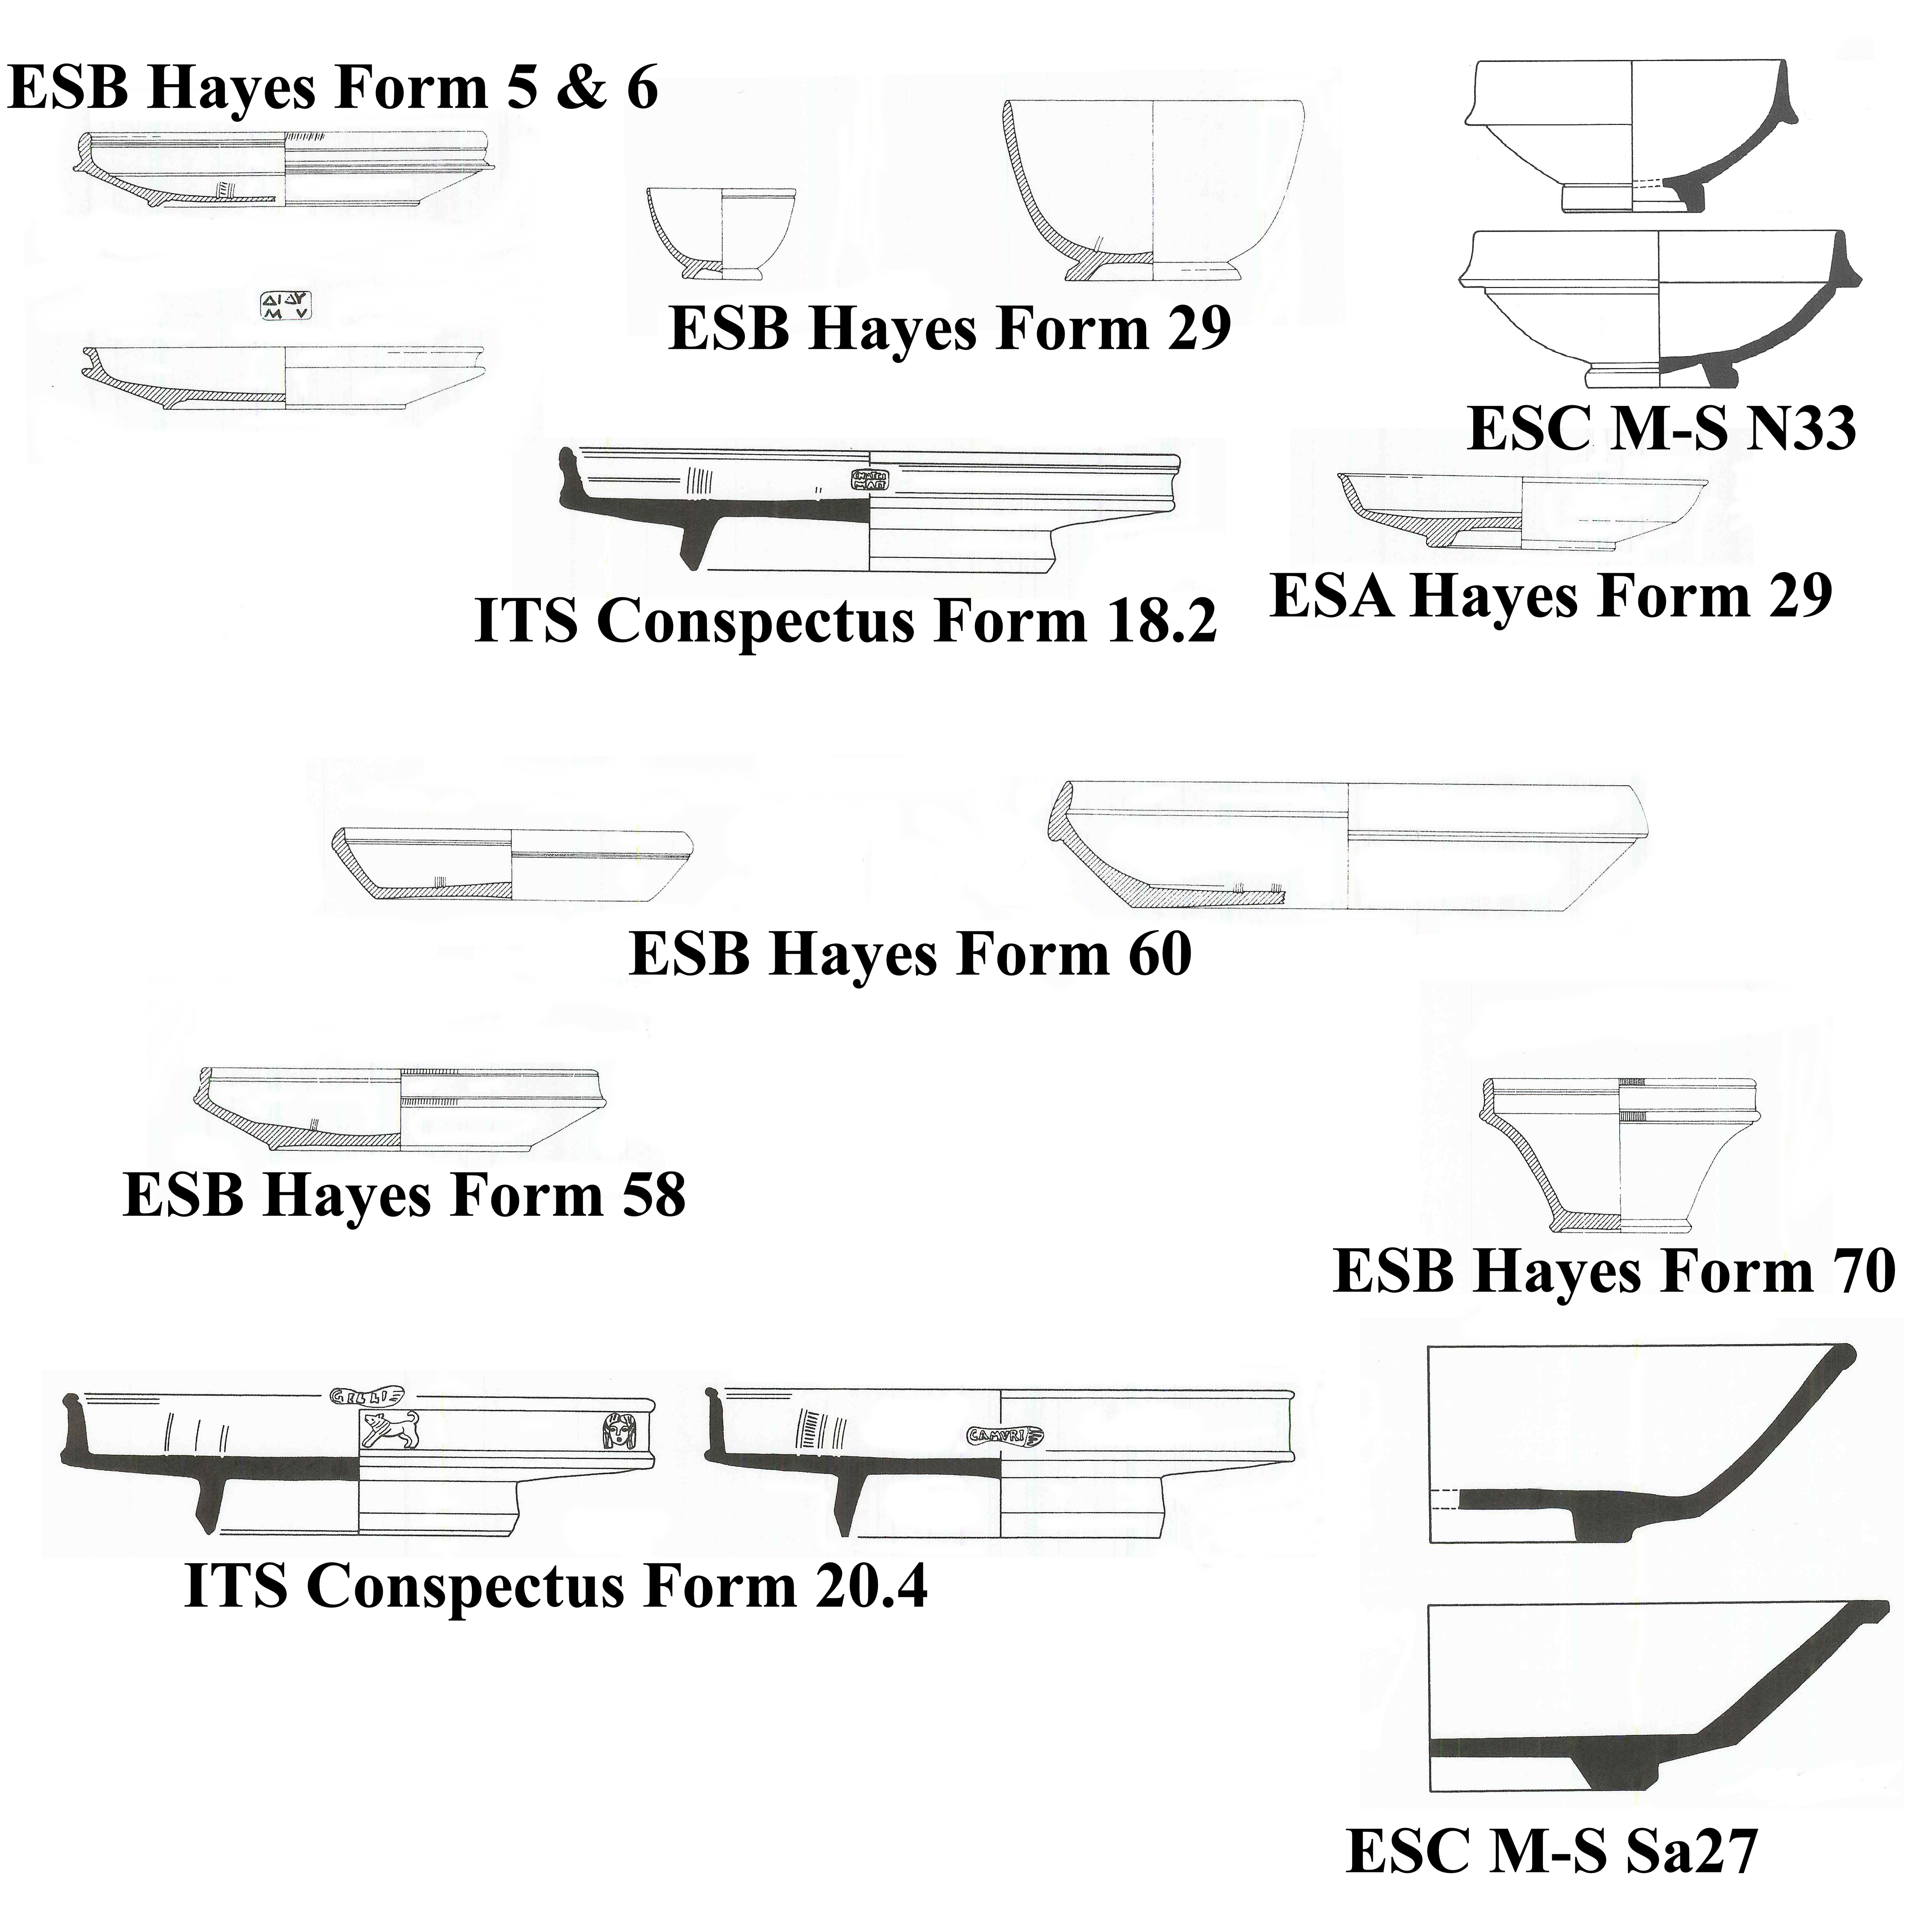
Figure 10: Selection of the most common forms found at Assos. Older popular forms are displayed at the top and newer forms below. Not to scale. Source drawings Meyer-Schlichtmann (1988) and Hayes (1985).
Figure 11: Selection of the most common forms found at Ephesos. Older popular forms are displayed at the top and newer forms below. Not to scale. Source drawings Meyer-Schlichtmann (1988), Ettlinger et al. (1990) and Hayes (1985).
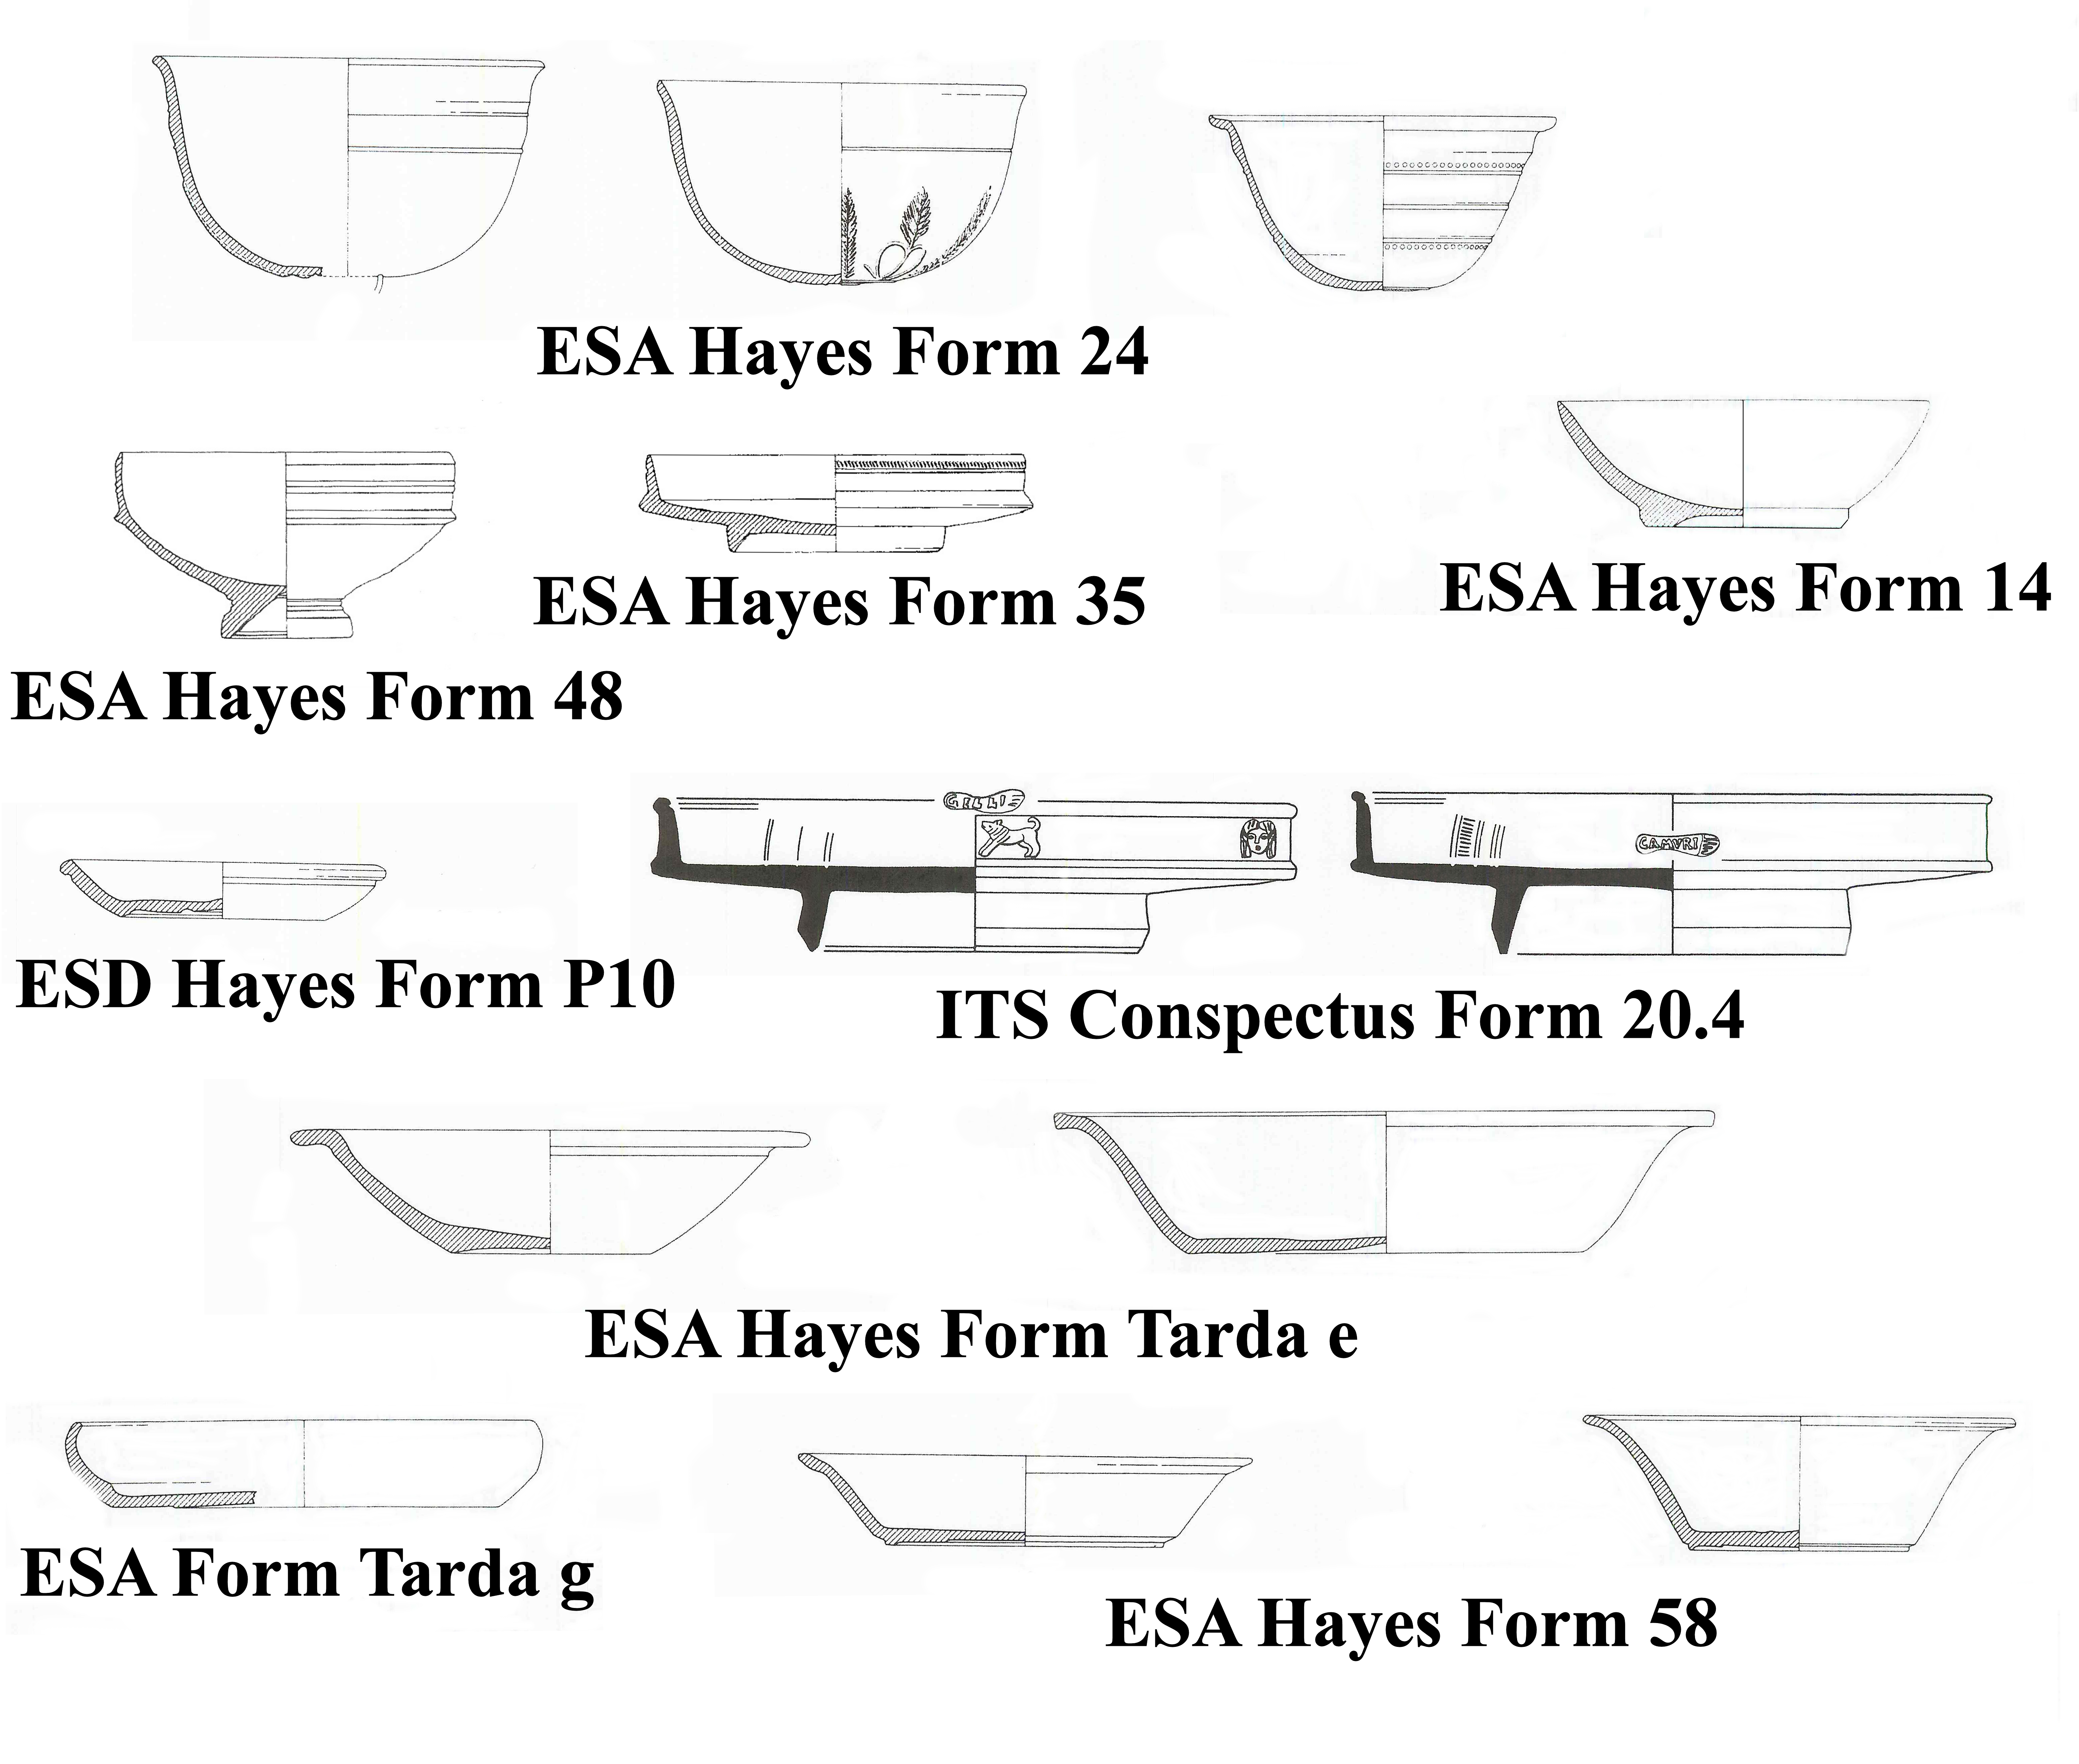
Figure 12: Selection of the most common forms found at Tarsos. Older popular forms are displayed at the top and newer forms below. Not to scale. Source drawings Meyer-Schlichtmann (1988), Ettlinger et al. (1990) and Hayes (1985).
Figure 13: Cup Eastern Sigillata A Form 22. Source drawings Hayes (1985).
Internet Archaeology is an open access journal based in the Department of Archaeology, University of York. Except where otherwise noted, content from this work may be used under the terms of the Creative Commons Attribution 3.0 (CC BY) Unported licence, which permits unrestricted use, distribution, and reproduction in any medium, provided that attribution to the author(s), the title of the work, the Internet Archaeology journal and the relevant URL/DOI are given.
Terms and Conditions | Legal Statements | Privacy Policy | Cookies Policy | Citing Internet Archaeology
Internet Archaeology content is preserved for the long term with the Archaeology Data Service (ROR). Help sustain and support open access publication by donating to our Open Access Archaeology Fund.