A. Arnaud Gérard from AcústicaStudioLab de Potosí/Bolivia carried out the analysis, editing and interpretation of the samples by using the sound recordings of the two replicas and the original bottle.
The ideal way to conduct acoustic studies of musical instruments is to perform sound sampling in an anechoic room in an acoustic laboratory. However, in the case of archaeological and historical musical instruments belonging to museums or collections, in general it is not possible to remove them from the museum and this is precisely the case of the example studied here. Therefore the sound samples were taken in the best possible conditions (avoiding external noises) within the environment of the National Archaeological Reserve of the Ministry of Culture, Quito. Nor could the object be tested for its hydraulic operation (with water) for obvious reasons. So the sounds were generated by direct insufflation through the neck, gradually increasing the pressure (Audio 1). The sounds were recorded using a professional digital recorder Tascam DR-40 consisting of two built-in directional microphones (20Hz-20KHz) at a standard distance of 1 metre from the sound source (whistle). The digital samples in wav 44.1KHz/16bits format were analysed and edited in the laboratory using specialised software wavesurfer-1.8.8p4-win-i386.
Although the resonances in the environment in which the recordings were made could affect the level of certain components in the frequency (spectrum of partials) of the sounds analyzed, this did not appear to be important. They show a poor, almost sinusoidal behaviour (few notable harmonics) like most of the whistles, and therefore there is no option for the influence of the environment to intensify formantic areas within the main spectrum (it is quasi-sinusoidal).
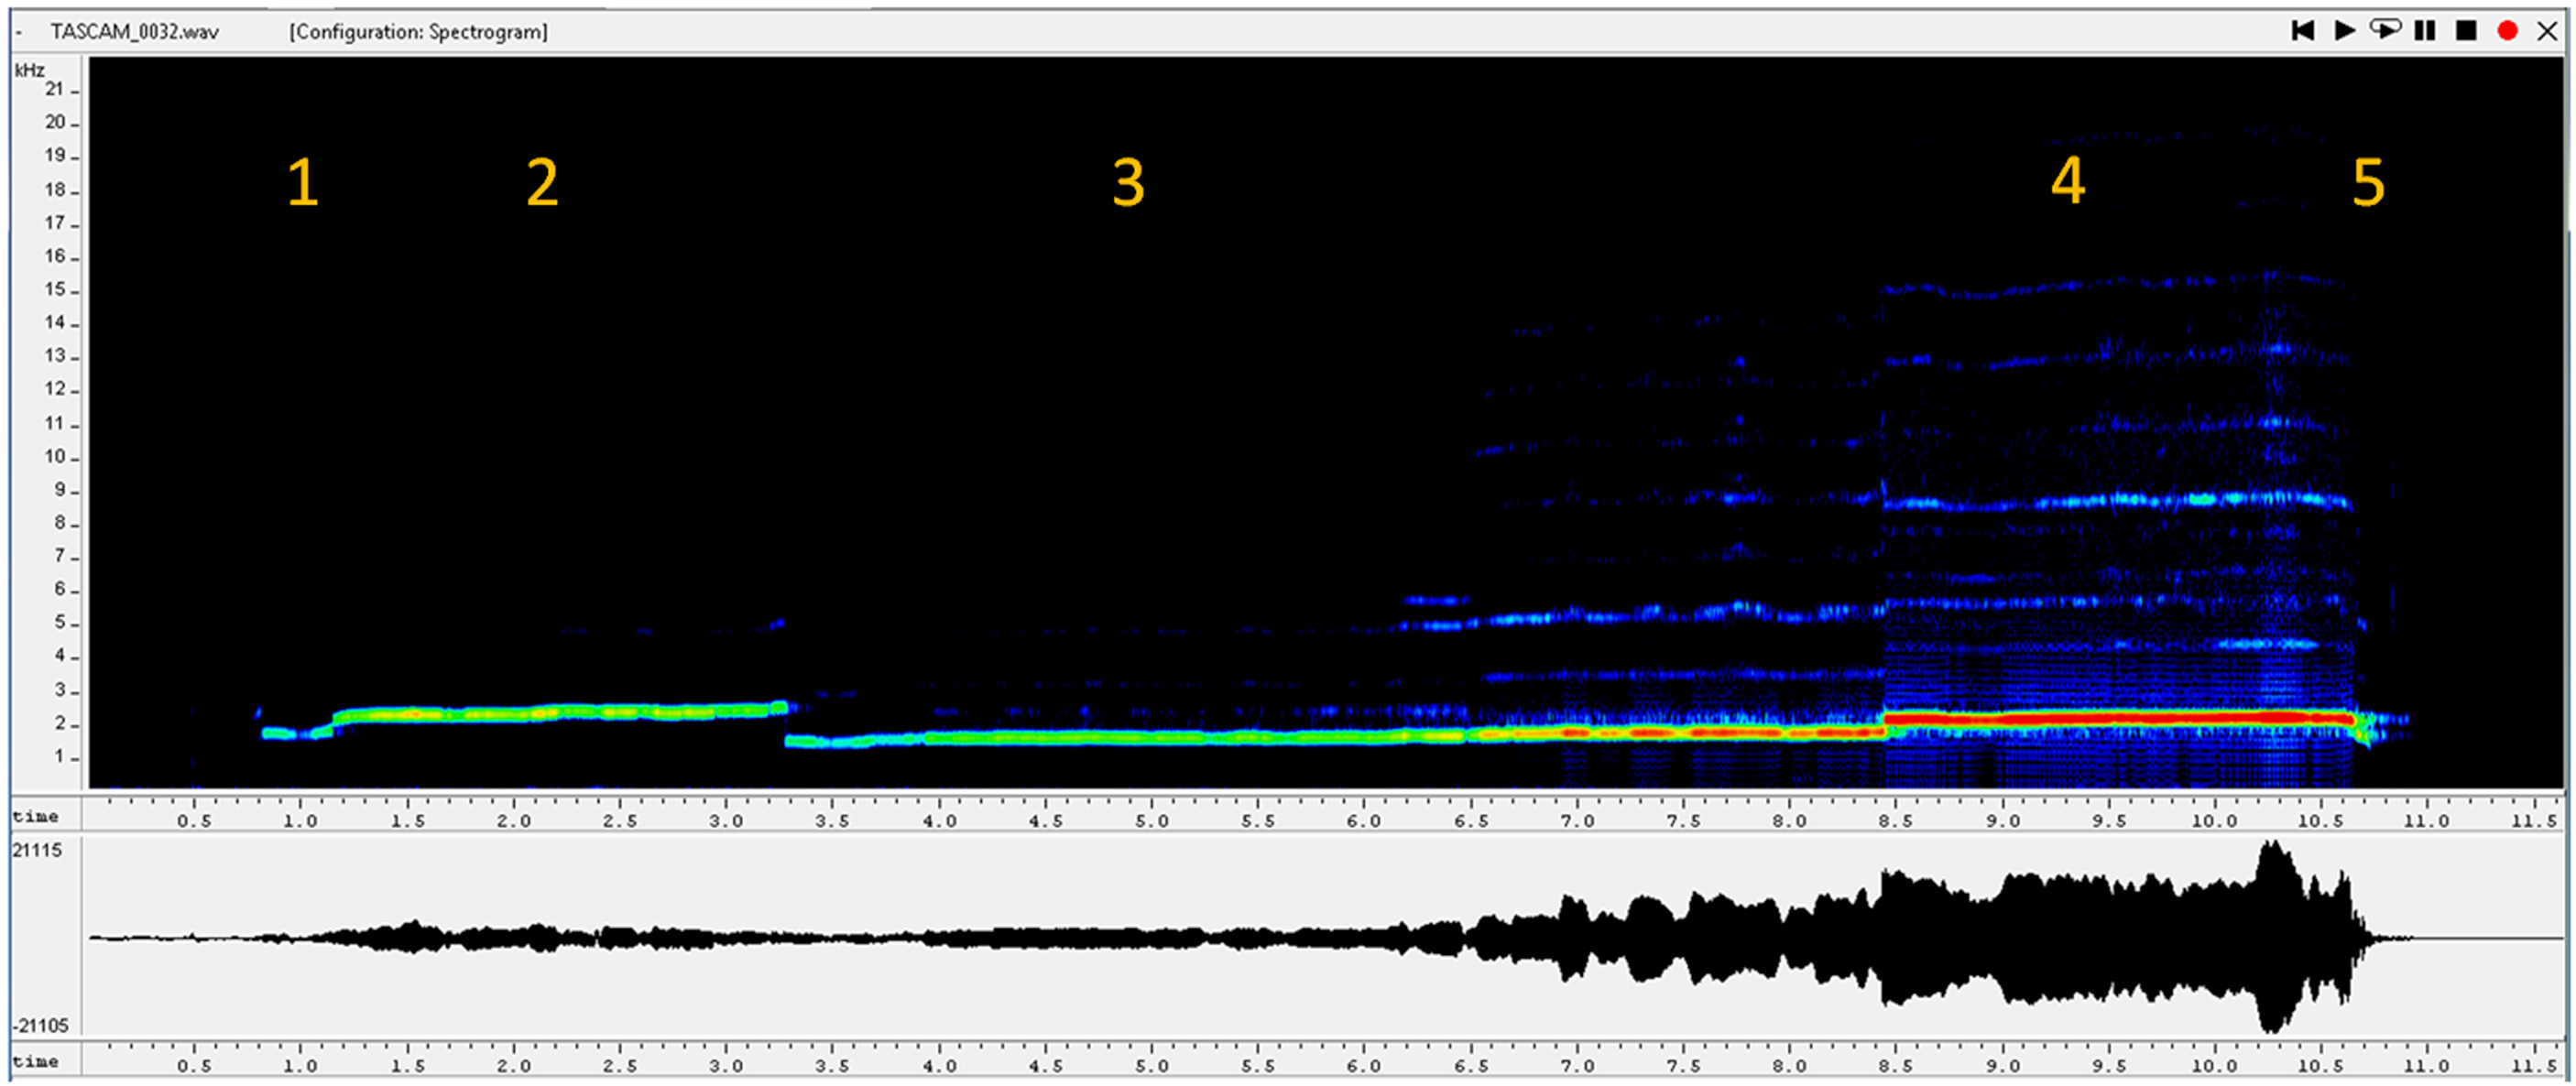
So we proceeded in this way, blowing directly through the neck with an increasing pressure (from weak to strong) and the results continued to show the same phenomenon. Four notes are visible in the spectrogram (Figure 28) (from 1 to 4) followed by a small final sound of the decay transient (5).
The sonagram or spectrogram is a frequency diagram (in Hz) as a function of time (in seconds) in which the thickness of the line and the points shows the intensity (also shown in colour) of an FFT (Fast Fourier Transform) analysis (see Gérard 2011). This is a computerised algorithm that allows us to divide a sound into its different spectral components.
The spectrographic analysis can be broken down as follows (The nomenclature of the sound heights is the name of the note followed by octave (in subscript) following scientific pitch notation. The deviation in cents (100 cents = 1 semitone)):
Sequential behaviour is very atypical and anomalous for a globular whistle of this type. It repeats almost the same sequence twice (a phenomenon in all samples). The interface between the two halves occurs in 3.25 seconds.
In general, a sound is heard A5 jumping to D6, then goes down to A5 (returning to the first note), then rises to a height of C#6. This C# is the same partial as the note D because it can vary from C to D, as noted in the analysis of stage 2. Broadly speaking then, the A-D is heard and then the (variable) C#. This leap towards a low pitch between regimes 2 and 3 is a curious phenomenon that does not usually occur and that deserves to be studied. It would be necessary to make several models controlling the variables very precisely, which would require sophisticated equipment.
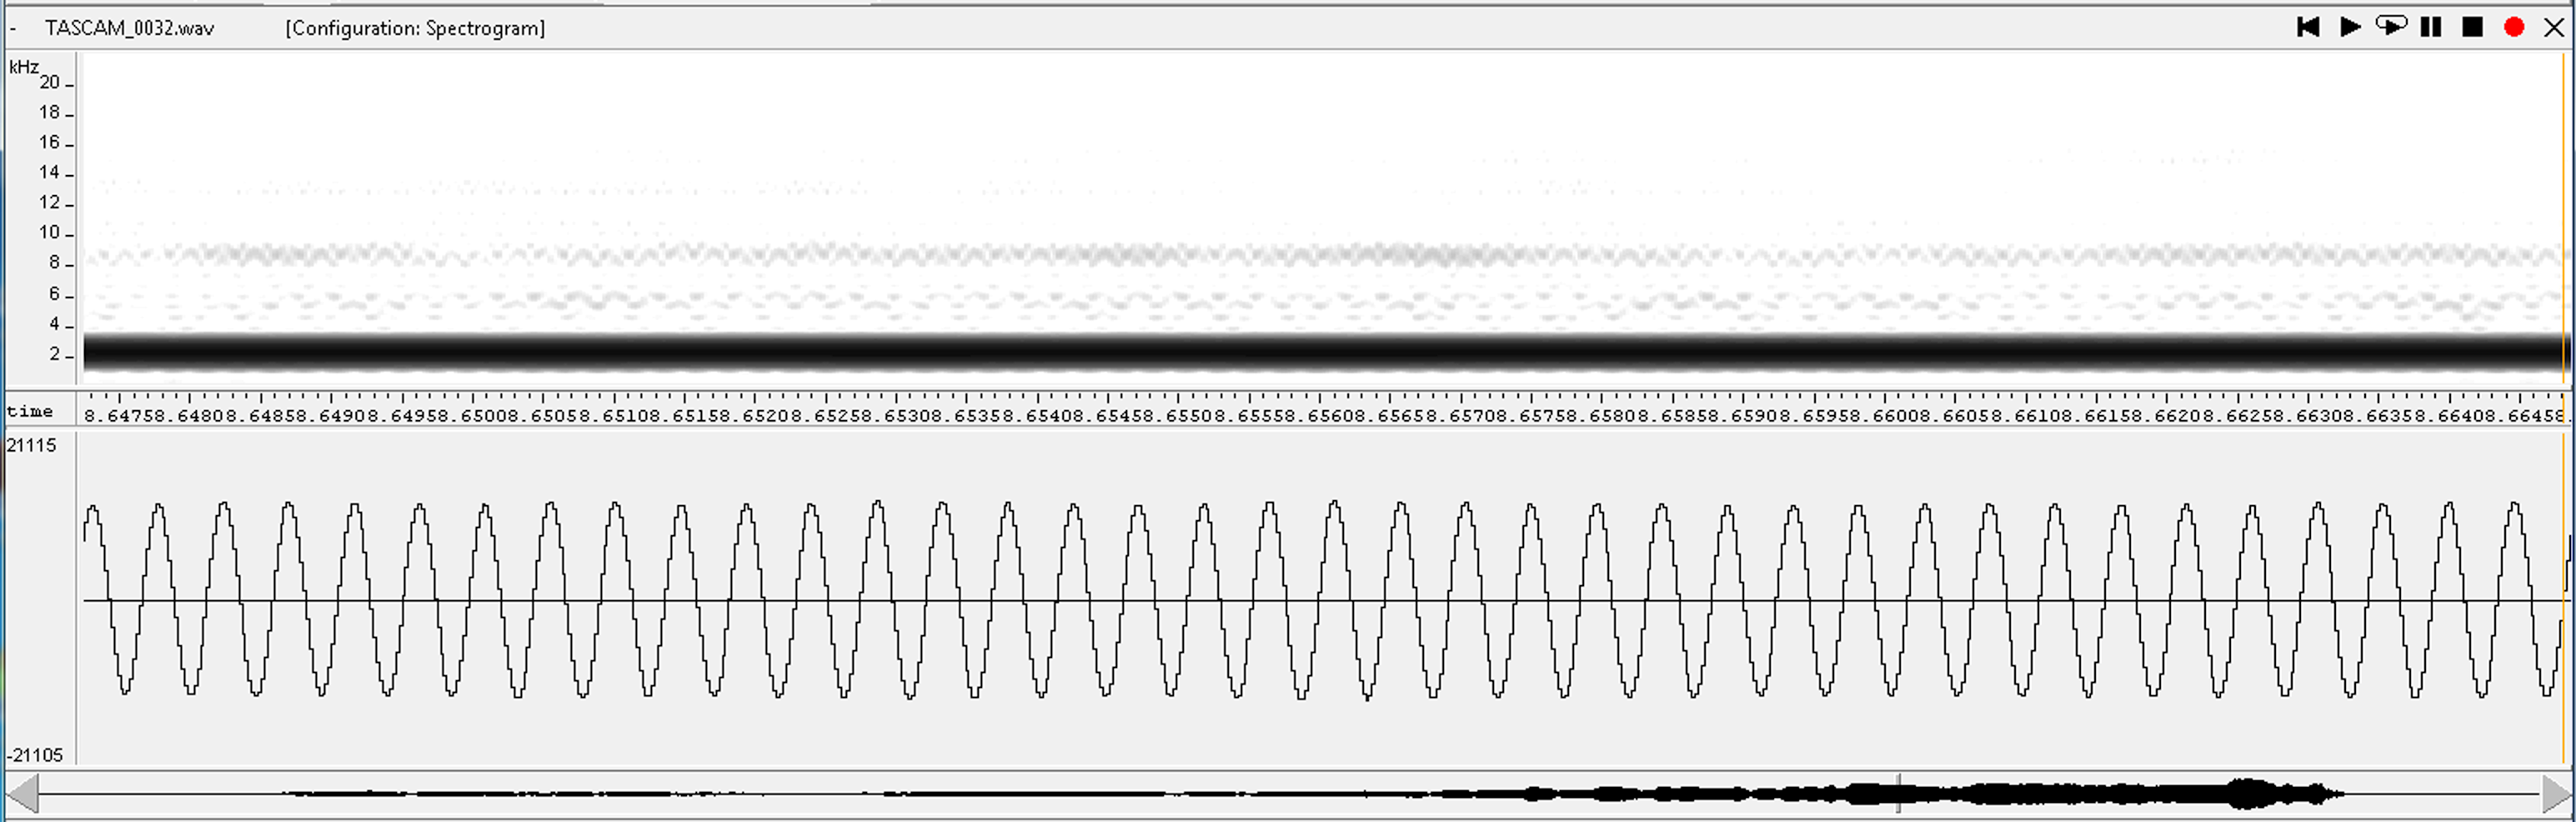
As for the timbre, for the importance of the fundamental frequency in each case, each part of the sound has a sinusoidal tendency (almost pure tone) (Figure 29), which is the typical tone of a globular whistle or an ocarina.
In one measurement it was possible to evaluate the sound level of the whistle bottle (sensation of intensity) which reached 84 decibels at a distance of one metre, when the sound of a rondador (a panpipe from Ecuador) reaches 88 decibels at the same distance, meaning that the sound power is quite loud, and can be heard clearly several metres away. What the hydraulic system would have sounded like remains to be asked.
Using the scale replica, it was possible to test the sound emission through the hydraulic mechanism (Audio 2) which we argue was surely how this type of whistle bottle operated.
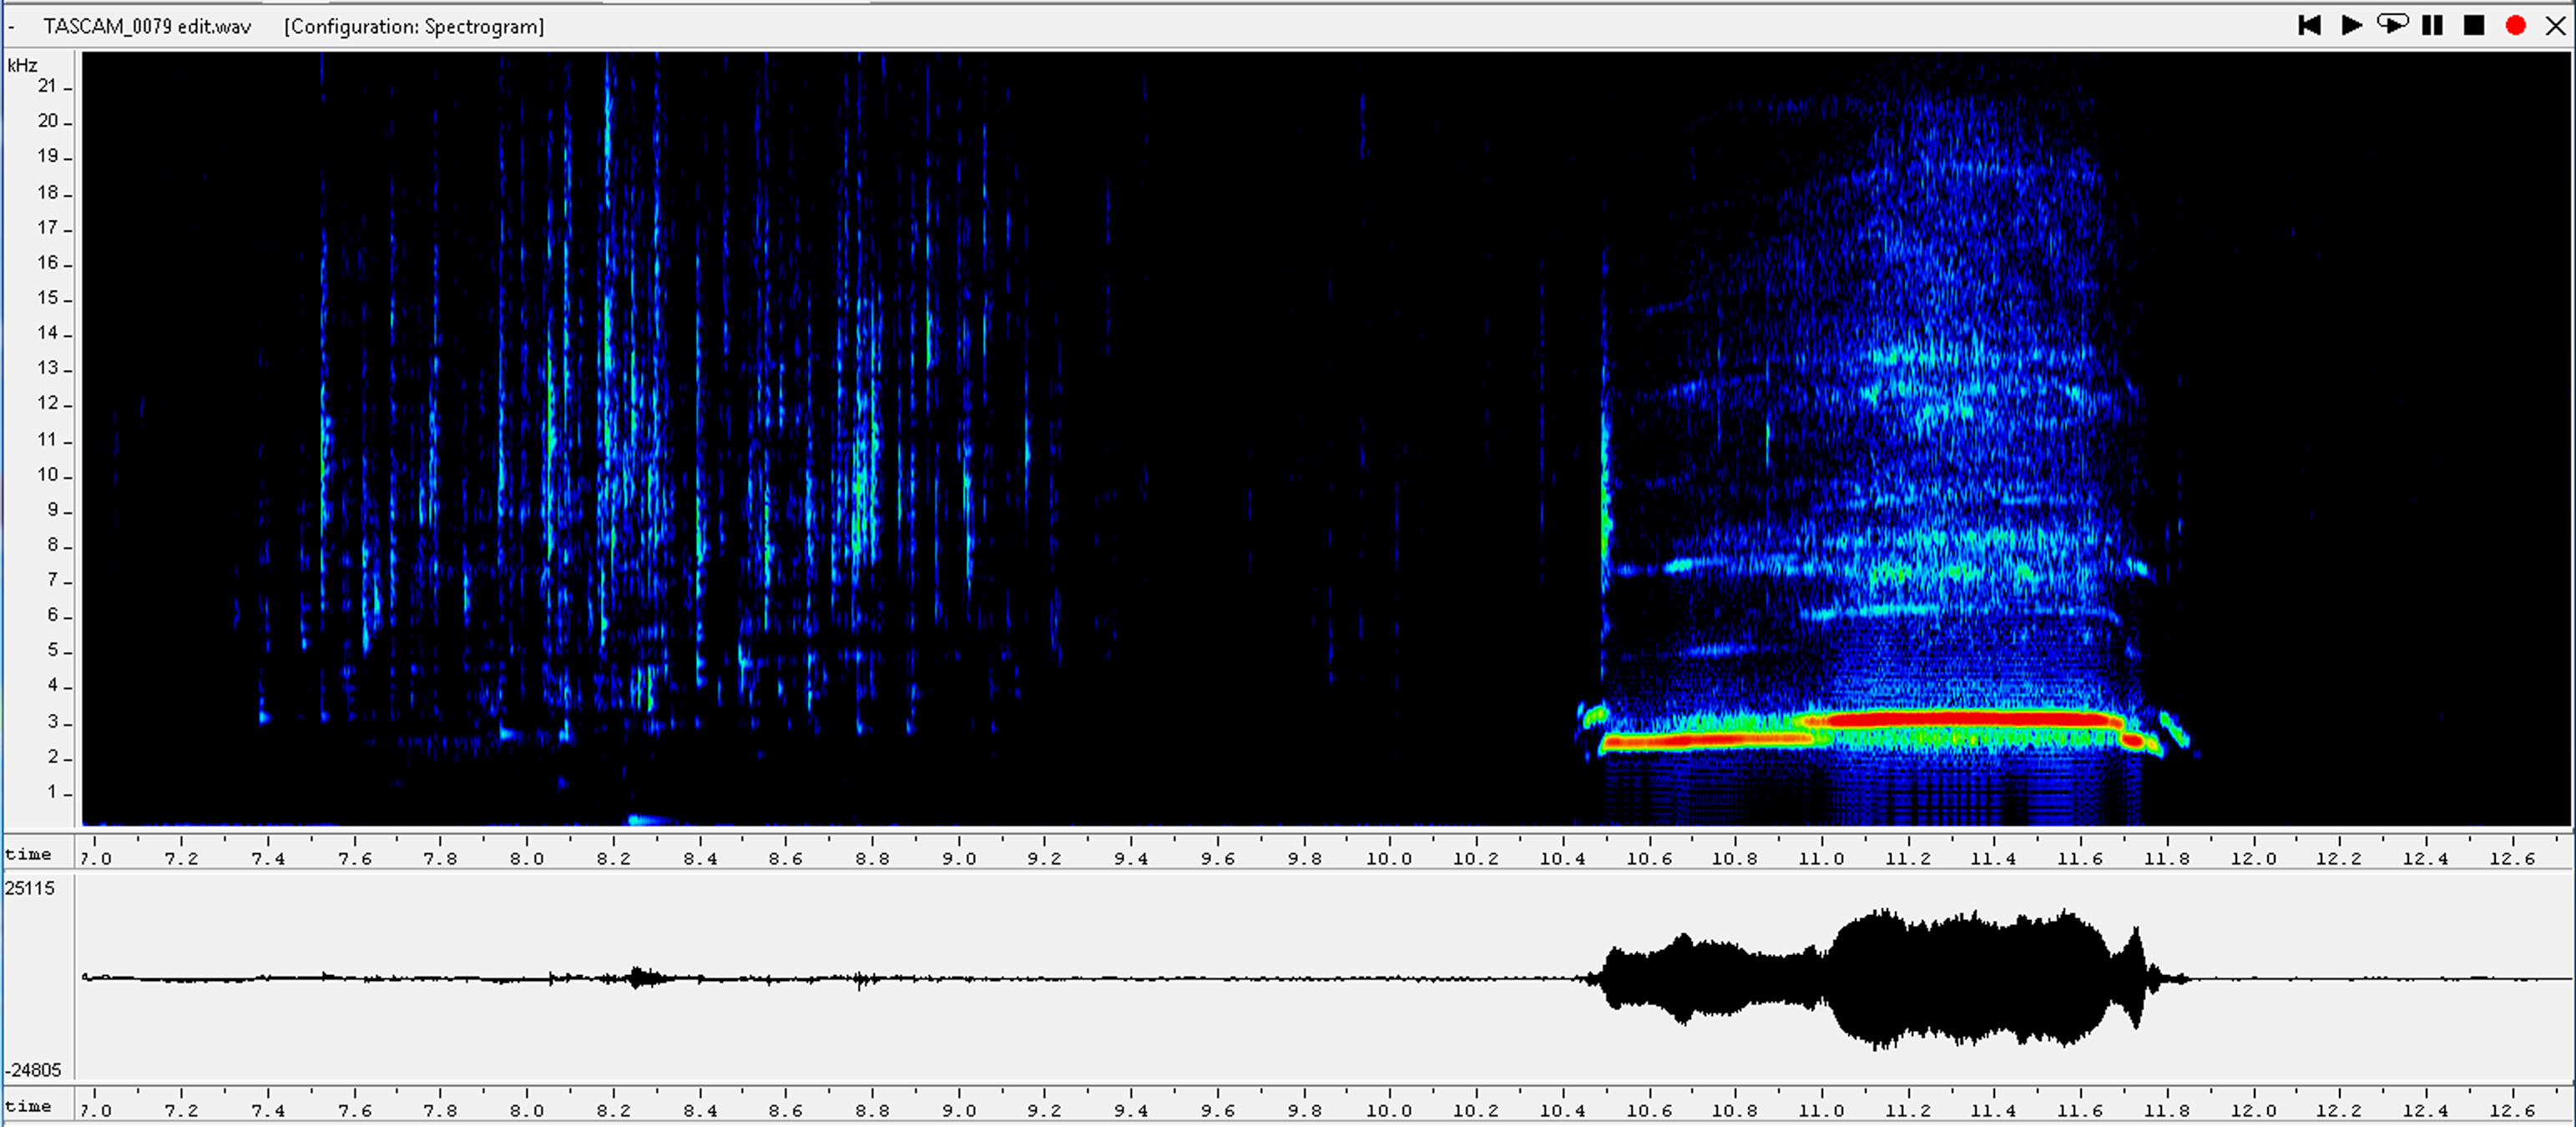
On the left of Figure 30, the sound of the air intake (admission) is demonstrated accompanied by the clicks of the water (each vertical line corresponds to a click). It looks like an inhalation next to the sound of water. The water sounds like a succession of dry high noises above 2.5 KHz. When the union pipe between the two bottles is 'uncovered', a more intense noise is produced, visible in the sonagram, similar to that produced when a bottle of cider or champagne is opened (sudden pressure equalisation). This occurs at 8.23s. On the right of the graph (Figure 30) the sound of the whistle is visualised. Four parts are shown: an edge tone that seeks accommodation with increasing frequencies ending with a sudden coupling at regime 1 (vertical line), a sound in regime 1 (horizontal line), a sound in regime 2 and a release in which the frequencies decrease rapidly. That sound has a certain similarity with the one that was observed in the original bottle, which also displayed two sound heights.
In the replica bottle, the head of the bird and the resonator sphere of the whistle are removable, which allowed a series of additional experiments to be carried out which showed important results for the research. Three tests were carried out: by placing an ultra-thin-walled plastic sphere as a whistle resonator, then changing it to a terracotta sphere with a wall thickness of 2mm and finally placing the head of the bird on top of the whistle, obtaining the following results:
Internet Archaeology is an open access journal based in the Department of Archaeology, University of York. Except where otherwise noted, content from this work may be used under the terms of the Creative Commons Attribution 3.0 (CC BY) Unported licence, which permits unrestricted use, distribution, and reproduction in any medium, provided that attribution to the author(s), the title of the work, the Internet Archaeology journal and the relevant URL/DOI are given.
Terms and Conditions | Legal Statements | Privacy Policy | Cookies Policy | Citing Internet Archaeology
Internet Archaeology content is preserved for the long term with the Archaeology Data Service (ROR). Help sustain and support open access publication by donating to our Open Access Archaeology Fund.