Cite this as: Strupler, N. 2021 Re-discovering Archaeological Discoveries. Experiments with reproducing archaeological survey analysis, Internet Archaeology 56. https://doi.org/10.11141/ia.56.6
The publication of any dataset needs to be acknowledged and praised. In an academic world in which so many datasets are not accessible, publishing them is a courageous endeavour, even more so if it was done over 10 years ago, when the problem of reproducibly was not yet fully recognised. Publishing data exposes a project to easy criticism. A tenet of science is that often we learn more from our failures than from our successes, a fact that has long deterred researchers from publishing data in the absence of mandatory policies to do so. In the process of investigating datasets, I will expose some of the successes as well as the failures that I encountered. My aim in these examples is not to blame the authors, contributors or investigators in any way, but on the contrary, to leverage their publications in order to discuss general problems in publishing data, how to improve the way we release data, and to stress the problem of reproducibility in archaeology. The main problem for academia are all the projects which still do not implement the Berlin Declaration on Open Access to Knowledge in the Sciences and Humanities. Projects that have published their raw data deserve high recognition, especially for their scientific ethos.
The scientific community uses a system of checks and balances to assure the integrity of results as well as validating or rejecting claims. This happens mostly in the form of review, either before the publication by referees (peer review) or after publication by colleagues (Niiniluoto 2019). The role of referees is to assess the quality and accuracy of articles submitted for publication (even if the final decision on publication belongs solely to the journal's editorial board). Depending on the journal and editors, other criteria may be evaluated such as originality or significance. Peer review is essential in the publication process. However, as a form of analysis, it is not free of biases (such as gender, language, nationality, prestige or conservatism (see Lee et al. 2013)). More recently, diffusion of pre-print materials has been recognised as a possibility to alleviate some of the biases of peer-review (Sarabipour et al. 2019). In contrast to peer review, post-publication review is less formalised and can take various forms, such as discussion within an article with different or similar results, a follow-up study refining the methodology, or a formal book review.
If one of the tenets of scientific method is checking the accuracy and credibility of a piece of research, it is surprising that no consensus seems to exist about how to achieve it. In empirical research, replication is considered the preferred way to prove a scientific claim. If it is possible to confirm the findings with another experiment in which some external variables (such as time, place, person implementing the experiment) have been changed, this is considered a validation (Schmidt 2009). The principle behind replication is to rule out the results arising from random chance, and instead, show consistency in the data and analysis. This implies that exact replication is useless, because it is only if some of the parameters change and the new results correlate with the expectation that a replication can be accepted as a proof. Addressing agent-based models, Wilensky and Rand (2007) propose the modifiable variables between original studies and replication be classed according to the effort required, namely, variation in: (1) time; (2) hardware; (3) computational language; (4) software libraries; (5) algorithms; and (6) authors.
Replication is therefore part of the post-publication review process rather than reproducibility which is expected to be part of the pre-print review process. However, even if reviewing and proofing results is a tenet of science, for the past 15 years the 'superficiality' of the pre-print reviewing process has been emerging across all scientific disciplines (Ioannidis 2012; Makel et al. 2012; Zwaan et al. 2018). This has been called the 'reproducibility crisis in science', or more recently and perhaps more positively, the 'credibility revolution' (Fidler and Wilcox 2018; Vazire 2018). This is often linked back to a paper, 'Why most published findings are false' from Ioannidis (2005) in which the author establishes a startling low reproducibility success rate (11%) of published papers in their field of expertise. This report was seminal in generating various meta-research analyses demonstrating that reproducibility of results and reassessments of computational working are the exception rather than the rule (e.g. Chang and Li 2015; Nuzzo 2015; Peng 2011; Resnik and Shamoo 2016; Bruner and Holman 2019).
In the field of archaeology, returning to earlier excavated sites and carrying out further investigations to confirm or refine earlier findings can be considered replication. This action builds on earlier experiments by changing some parameters. Similarly, revisiting and reinterpreting earlier publications or re-analysing museum collections (with new methods or 'updated' knowledge) should be considered replication, in the form of a follow-up study. Practically, for archaeologists reproducing should be easier than replicating and executing 'fieldwork'. In archaeology, as in many empirical sciences, the reproducibility debate has been linked mainly with 'ready-made' reproducibility (Marwick 2016; Marwick et al. 2017; Strupler and Wilkinson 2017). However, this definition does not take into account studies that (theoretically) provide all the elements required to reproduce them. This includes studies which describe and explain everything in detail, but lack the computational code – what I call latent reproducibility (see Glossary).
This paper presents the results of transcoding the analysis of three archaeological field-walking surveys to test if it is possible to transform latent reproducibility into ready-made reproducibility. Using the published datasets and methodology descriptions, I attempted to reproduce the results. I investigated Eastern Mediterranean projects (my area of expertise) whose digital data are available, as availability of data is the conditio sine qua non to reproduce results (Marwick 2016). I chose these projects because they were all executed with a similar methodology: intensive field survey. I present here the results of my attempts to reproduce some maps from three projects. The computational analyses were done with the R language (R Core Team 2020) and are appended to this article. The three experiments are then reviewed and guidance offered for future projects interested in making empirical archaeology more transparent.
One important intensive survey in the Mediterranean is the Boeotia Project which started in 1978. The aim of the project is to investigate the evolution of settlements and the rural landscape in Central Greece, focusing on the central town of Thespiae and its surroundings (see the project's webpage for more information). In addition to a number of articles, the team published a monograph in 2007, with a second volume in 2017 (Bintliff et al. 2007; Bintliff et al. 2017). For this review, which began in 2017, only the first publication and its data can be addressed. In the 2007 publication, the data are provided on a CD-ROM attached to the book, without much explanation, a flaw already noted in a review of the publication (Pettegrew 2010). This requires the reader to guess the meaning of the data on numerous occasions and then attempt to correlate them with the book. The dataset is provided in tabular form (.xls) (Table 1). From the header, the first variable gives the ID of each unit (called transect), followed by the co-ordinates. I understood the three variables 'Ceram', 'Viscorr' and 'Areacorr' as the number of counted ceramic sherds, this number then being corrected according to the percentage of Visibility, as well as being evaluated for the whole unit Area. (The project assessed the surface visibility as a percentage in order to correct the ceramic count to a percentage. As each transect was only covered by lines, the Area variable estimates the count for the total surface, not just the 'walking lines'.)
The following variables refer to the different periods and the number of sherds classified by period: Byz[antine], G[eometric], Preh[istoric], etc.
Table 1: Snapshot of the tabular data from the CD-ROM in Bintliff et al. (2007)
| Transect | X_coord | Y_coord | Offsite_ | Offsite_id | Ceram | Viscorr | Areacorr | Byz_et | G_h | H_r | H | Lr | Other | Preh | Prehlith | T_mod | T | R | R_lr | Dated |
|---|---|---|---|---|---|---|---|---|---|---|---|---|---|---|---|---|---|---|---|---|
| 1 | 17332.76 | 5060.482 | 32 | 5 | 338 | 676 | 3020.82 | 1 | 0 | 4 | 1 | 0 | 0 | 0 | 0 | 0 | 0 | 0 | 0 | 6 |
| 2 | 17279.96 | 5020.386 | 37 | 3 | 158 | 526.6667 | 3483.358 | 0 | 0 | 0 | 0 | 0 | 0 | 0 | 0 | 0 | 0 | 0 | 0 | 0 |
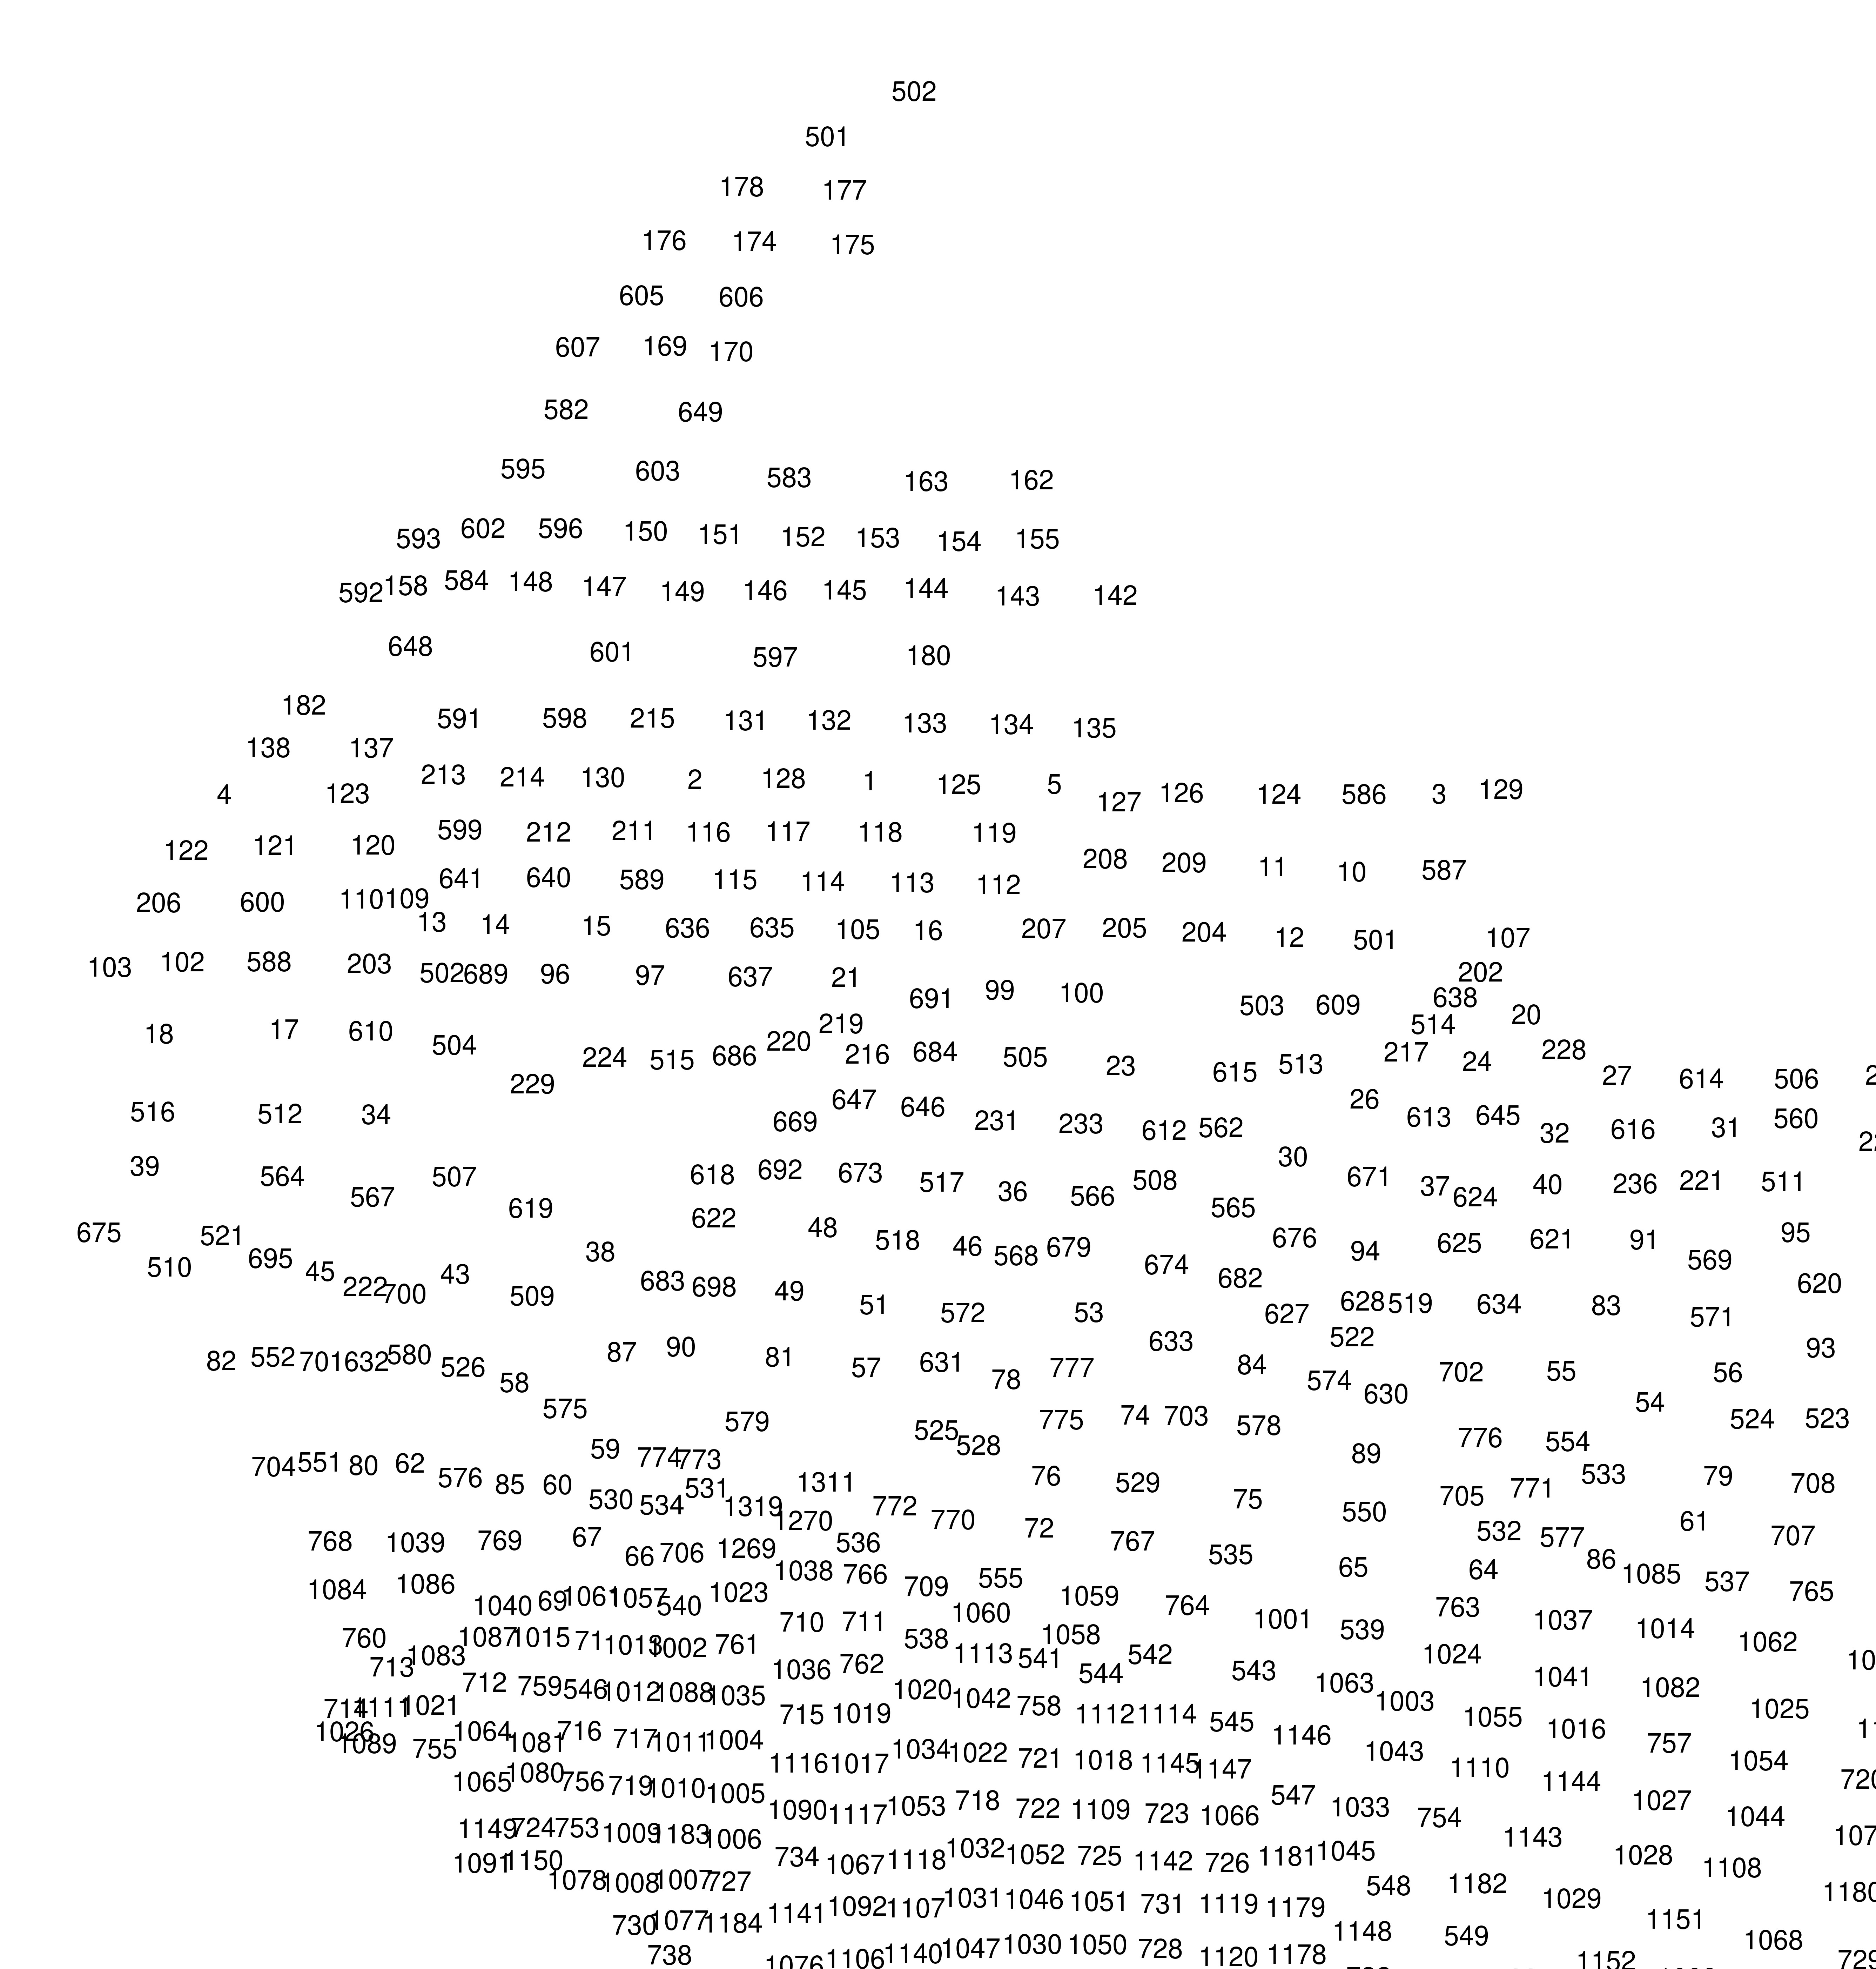
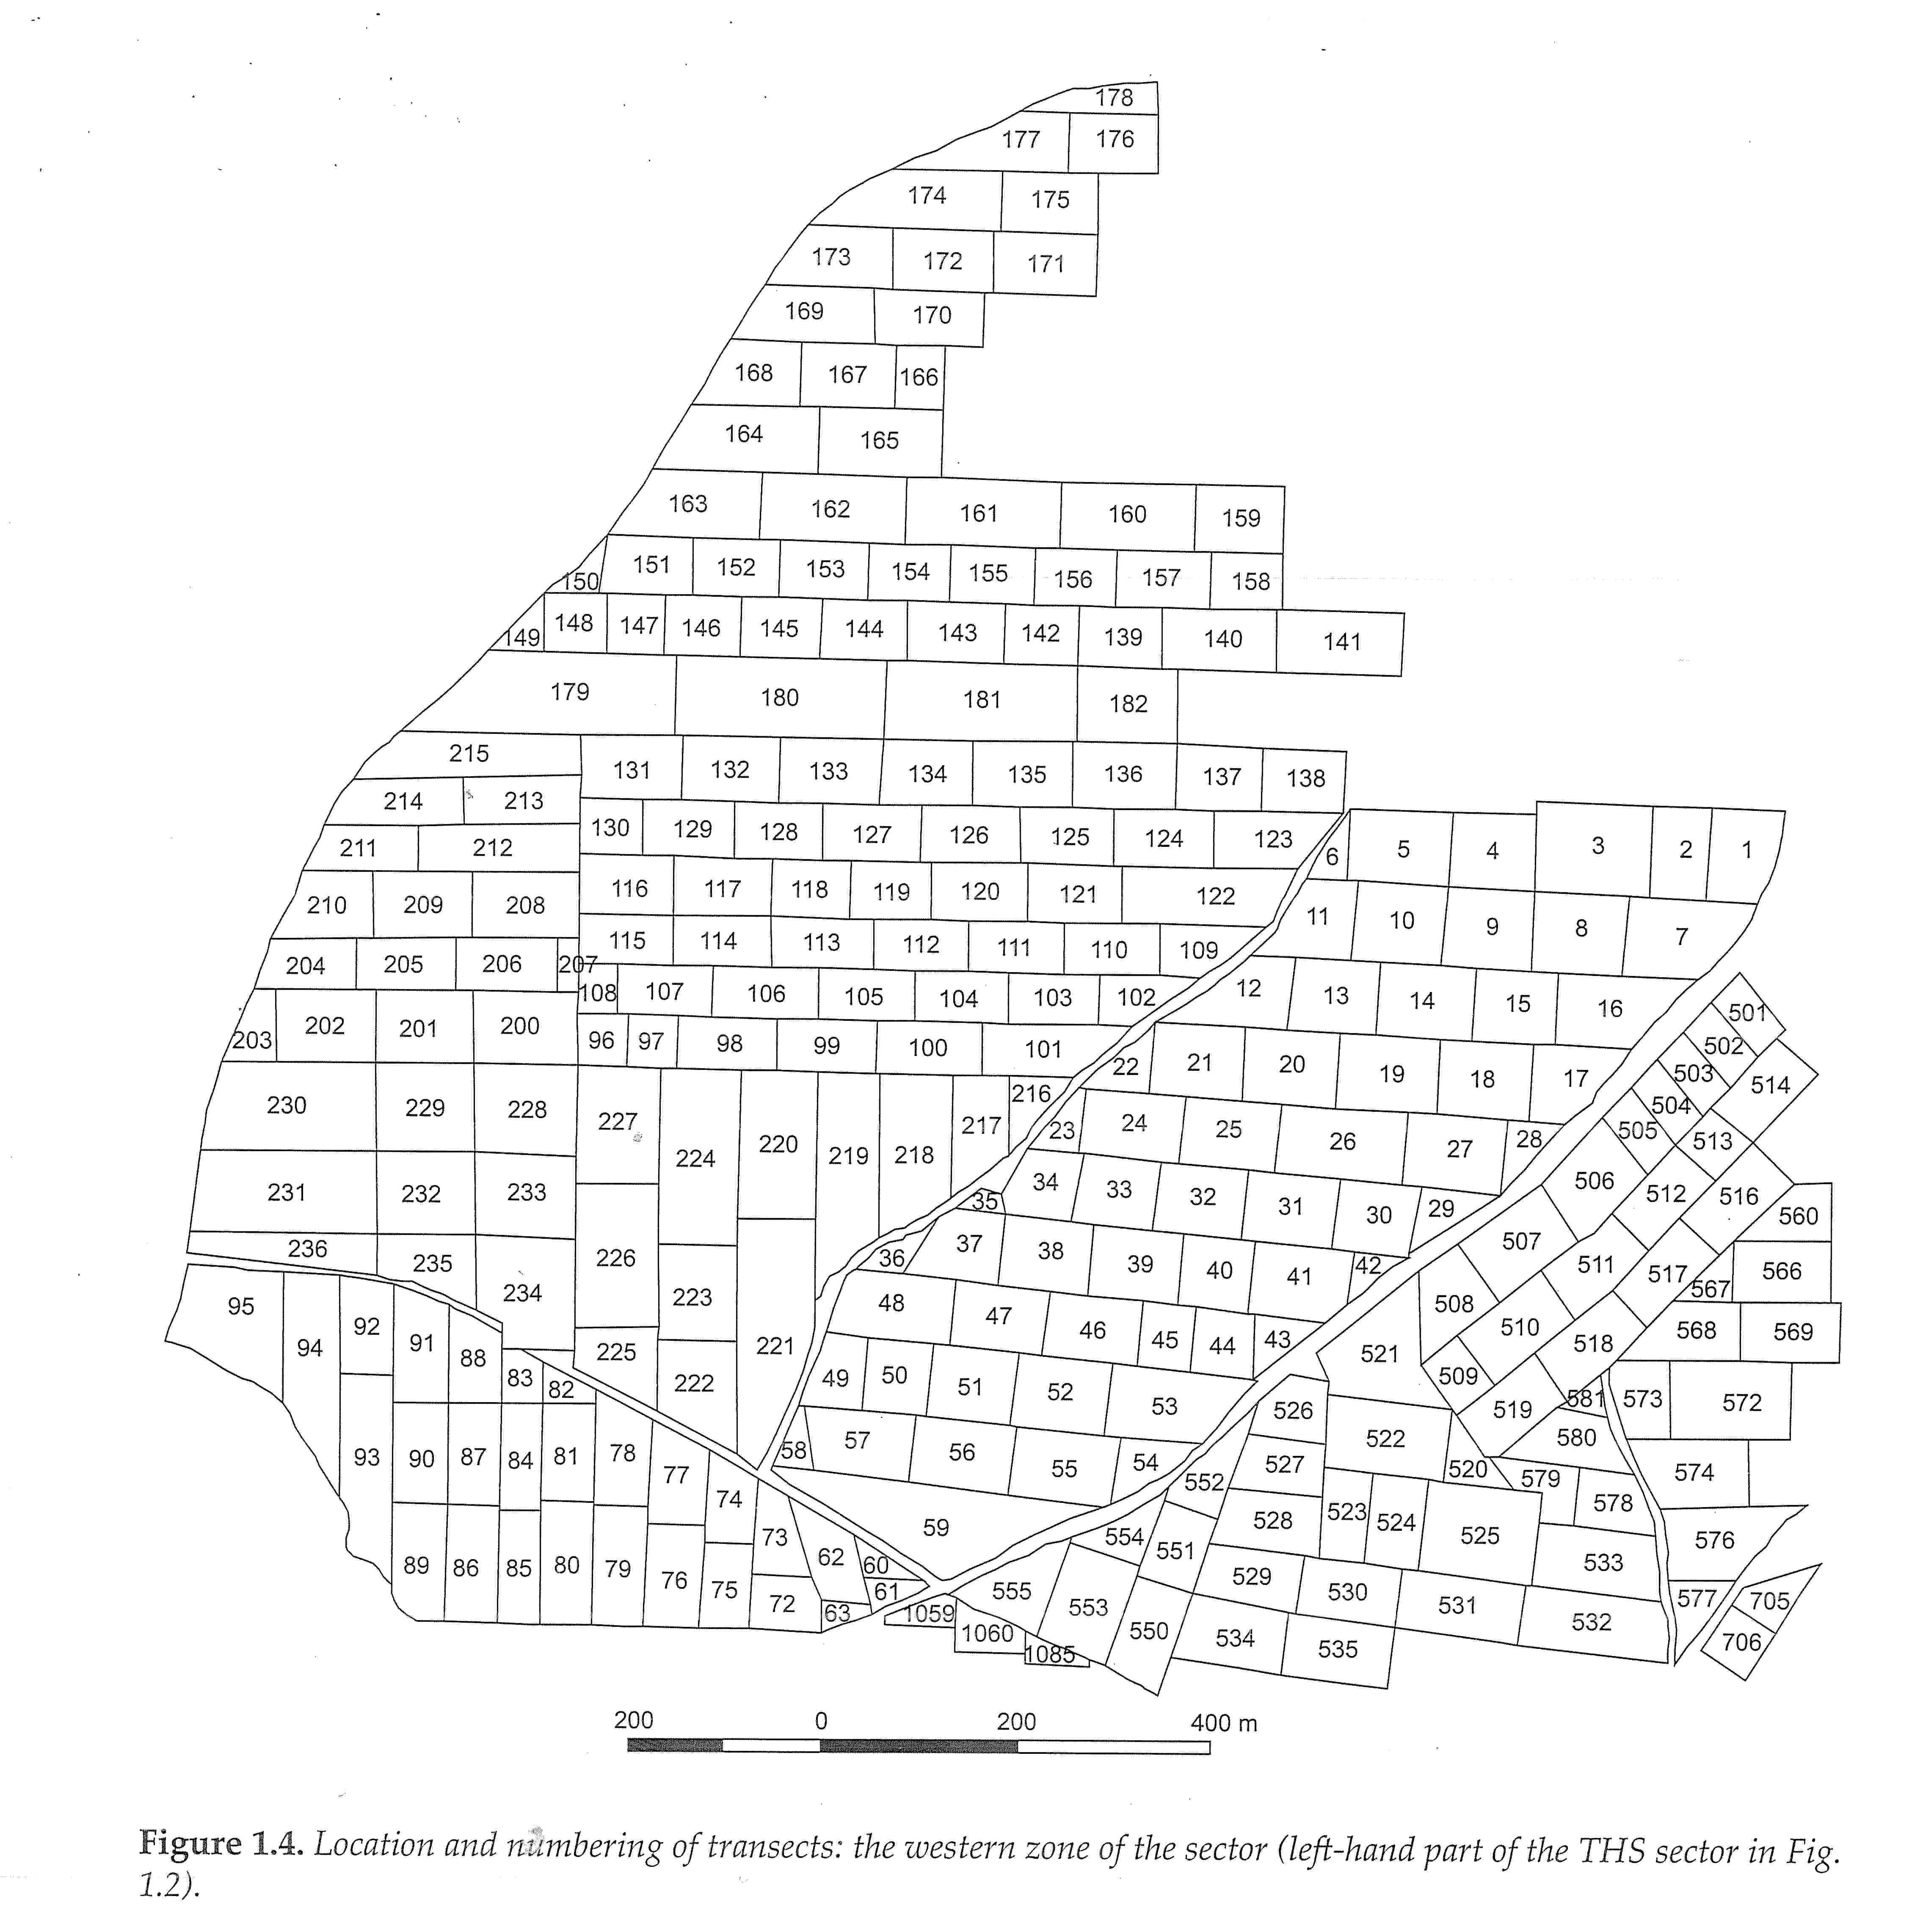
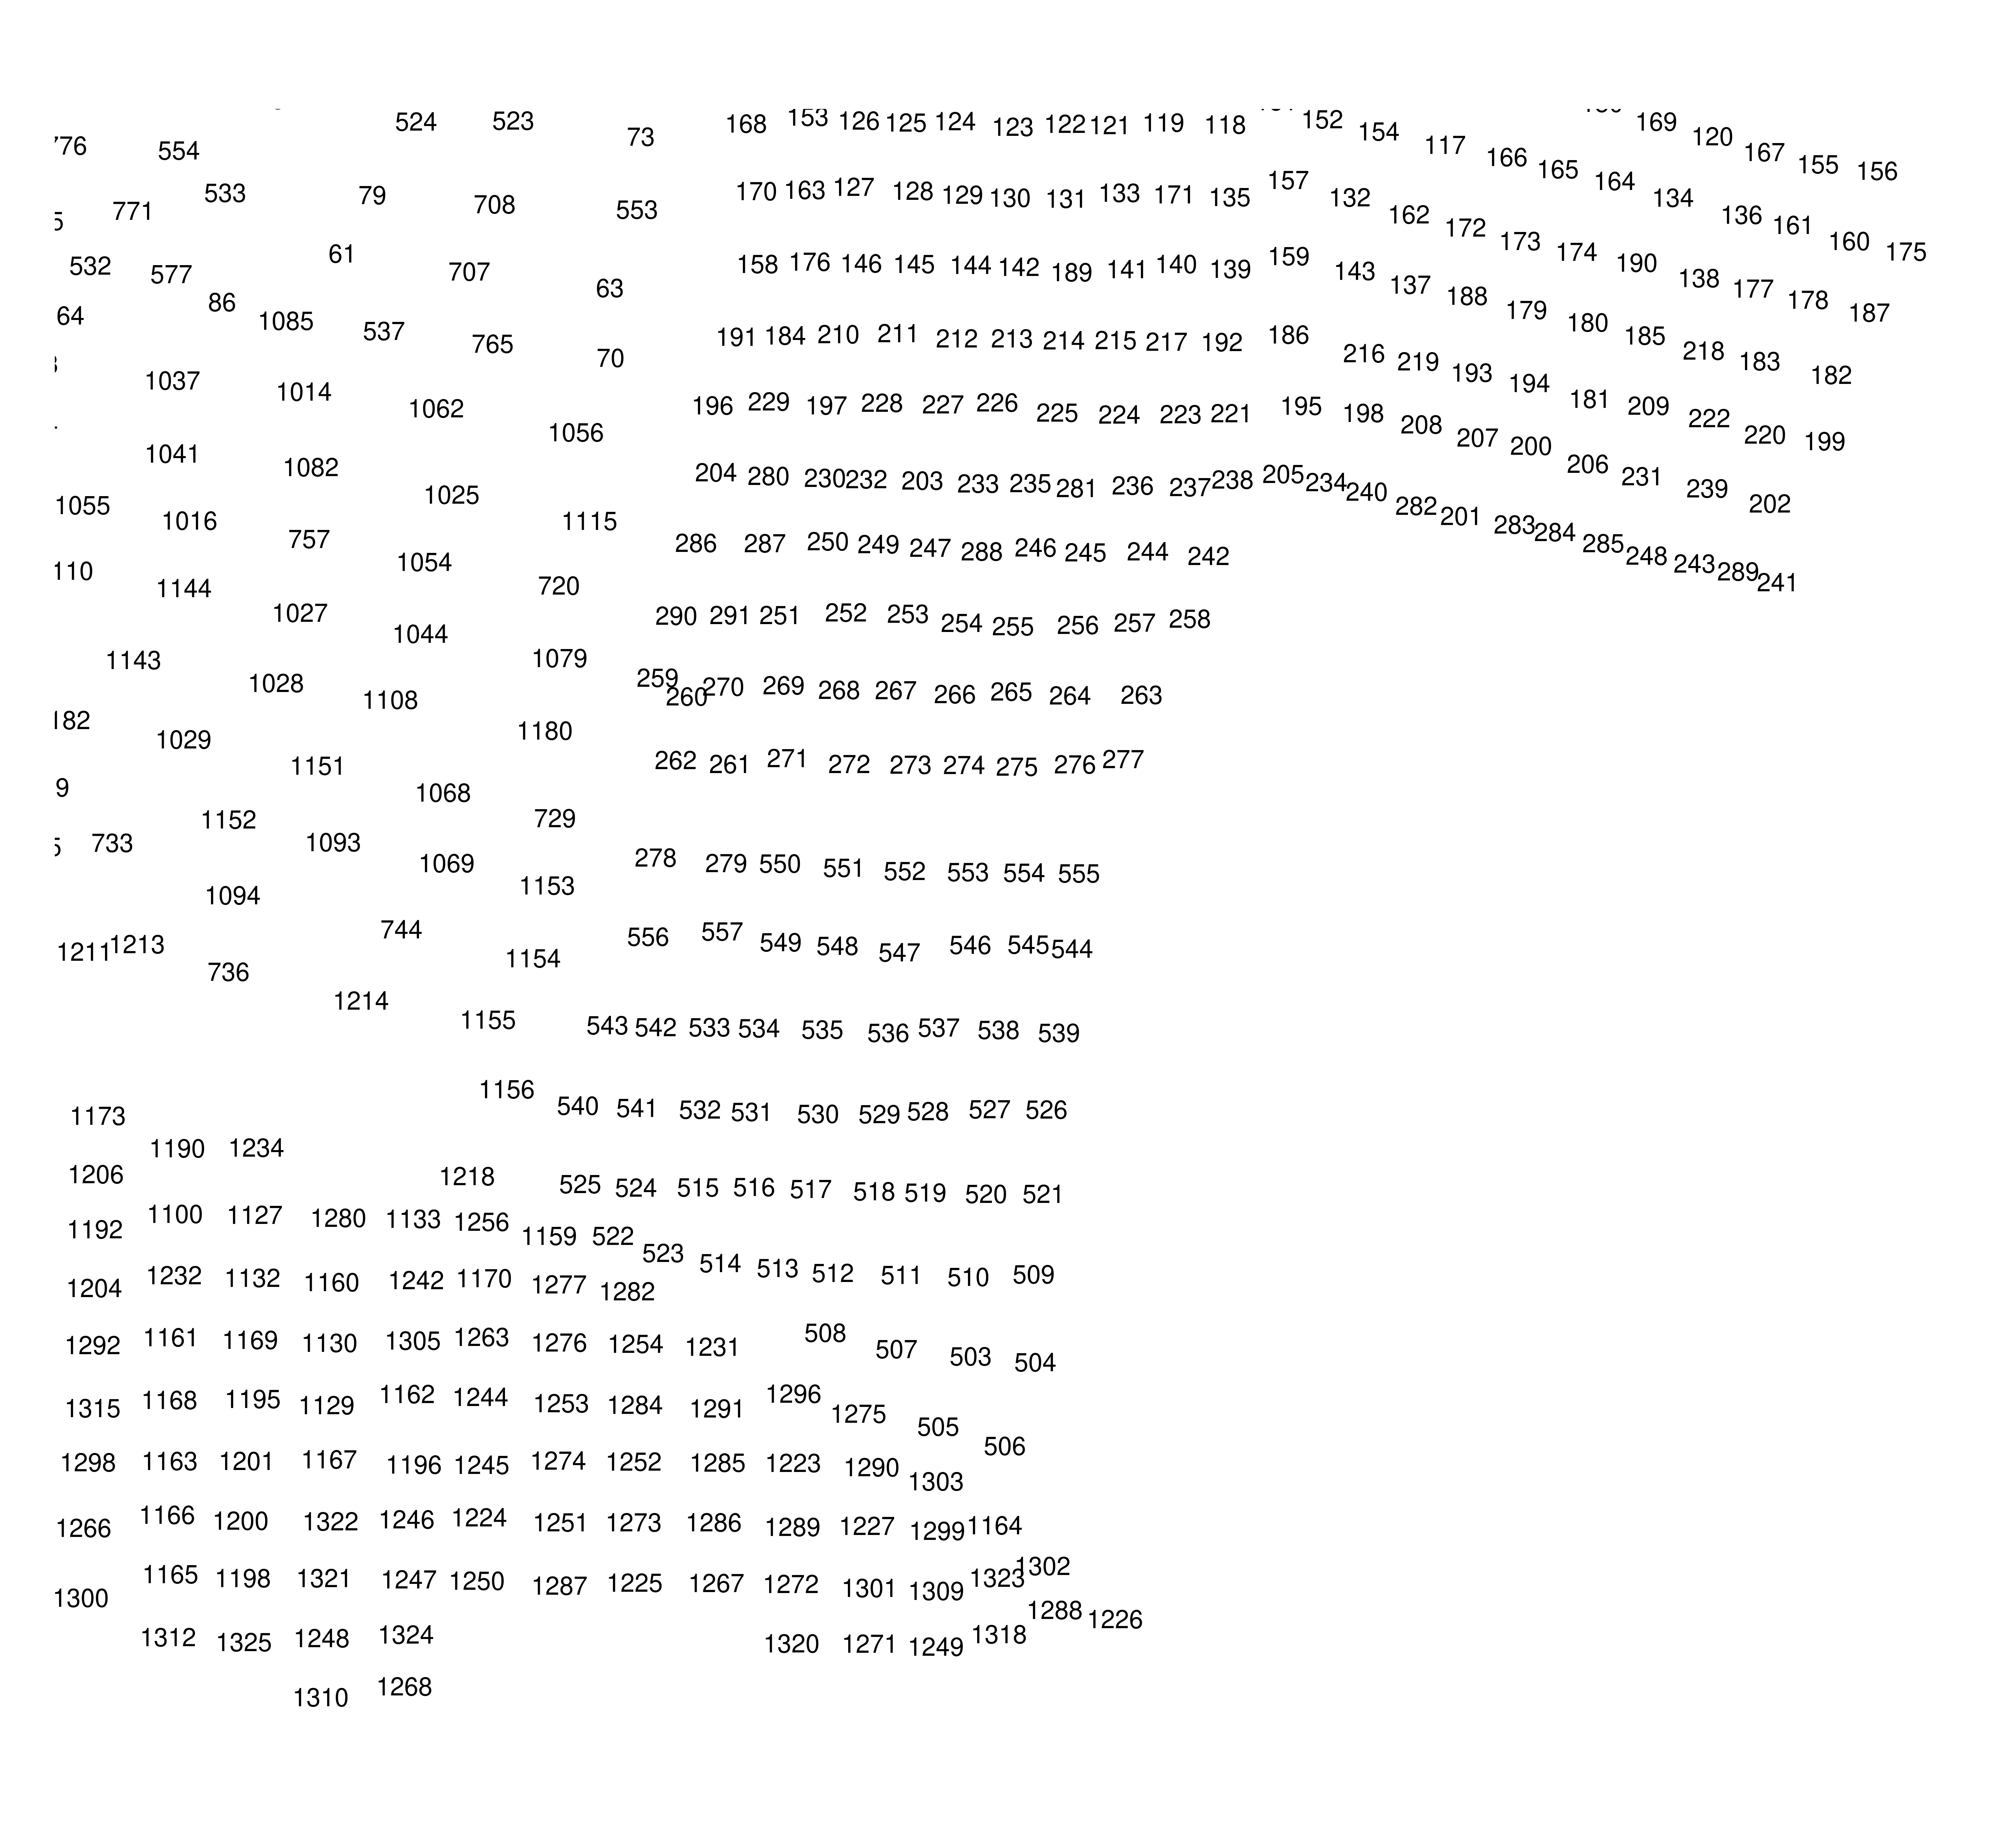
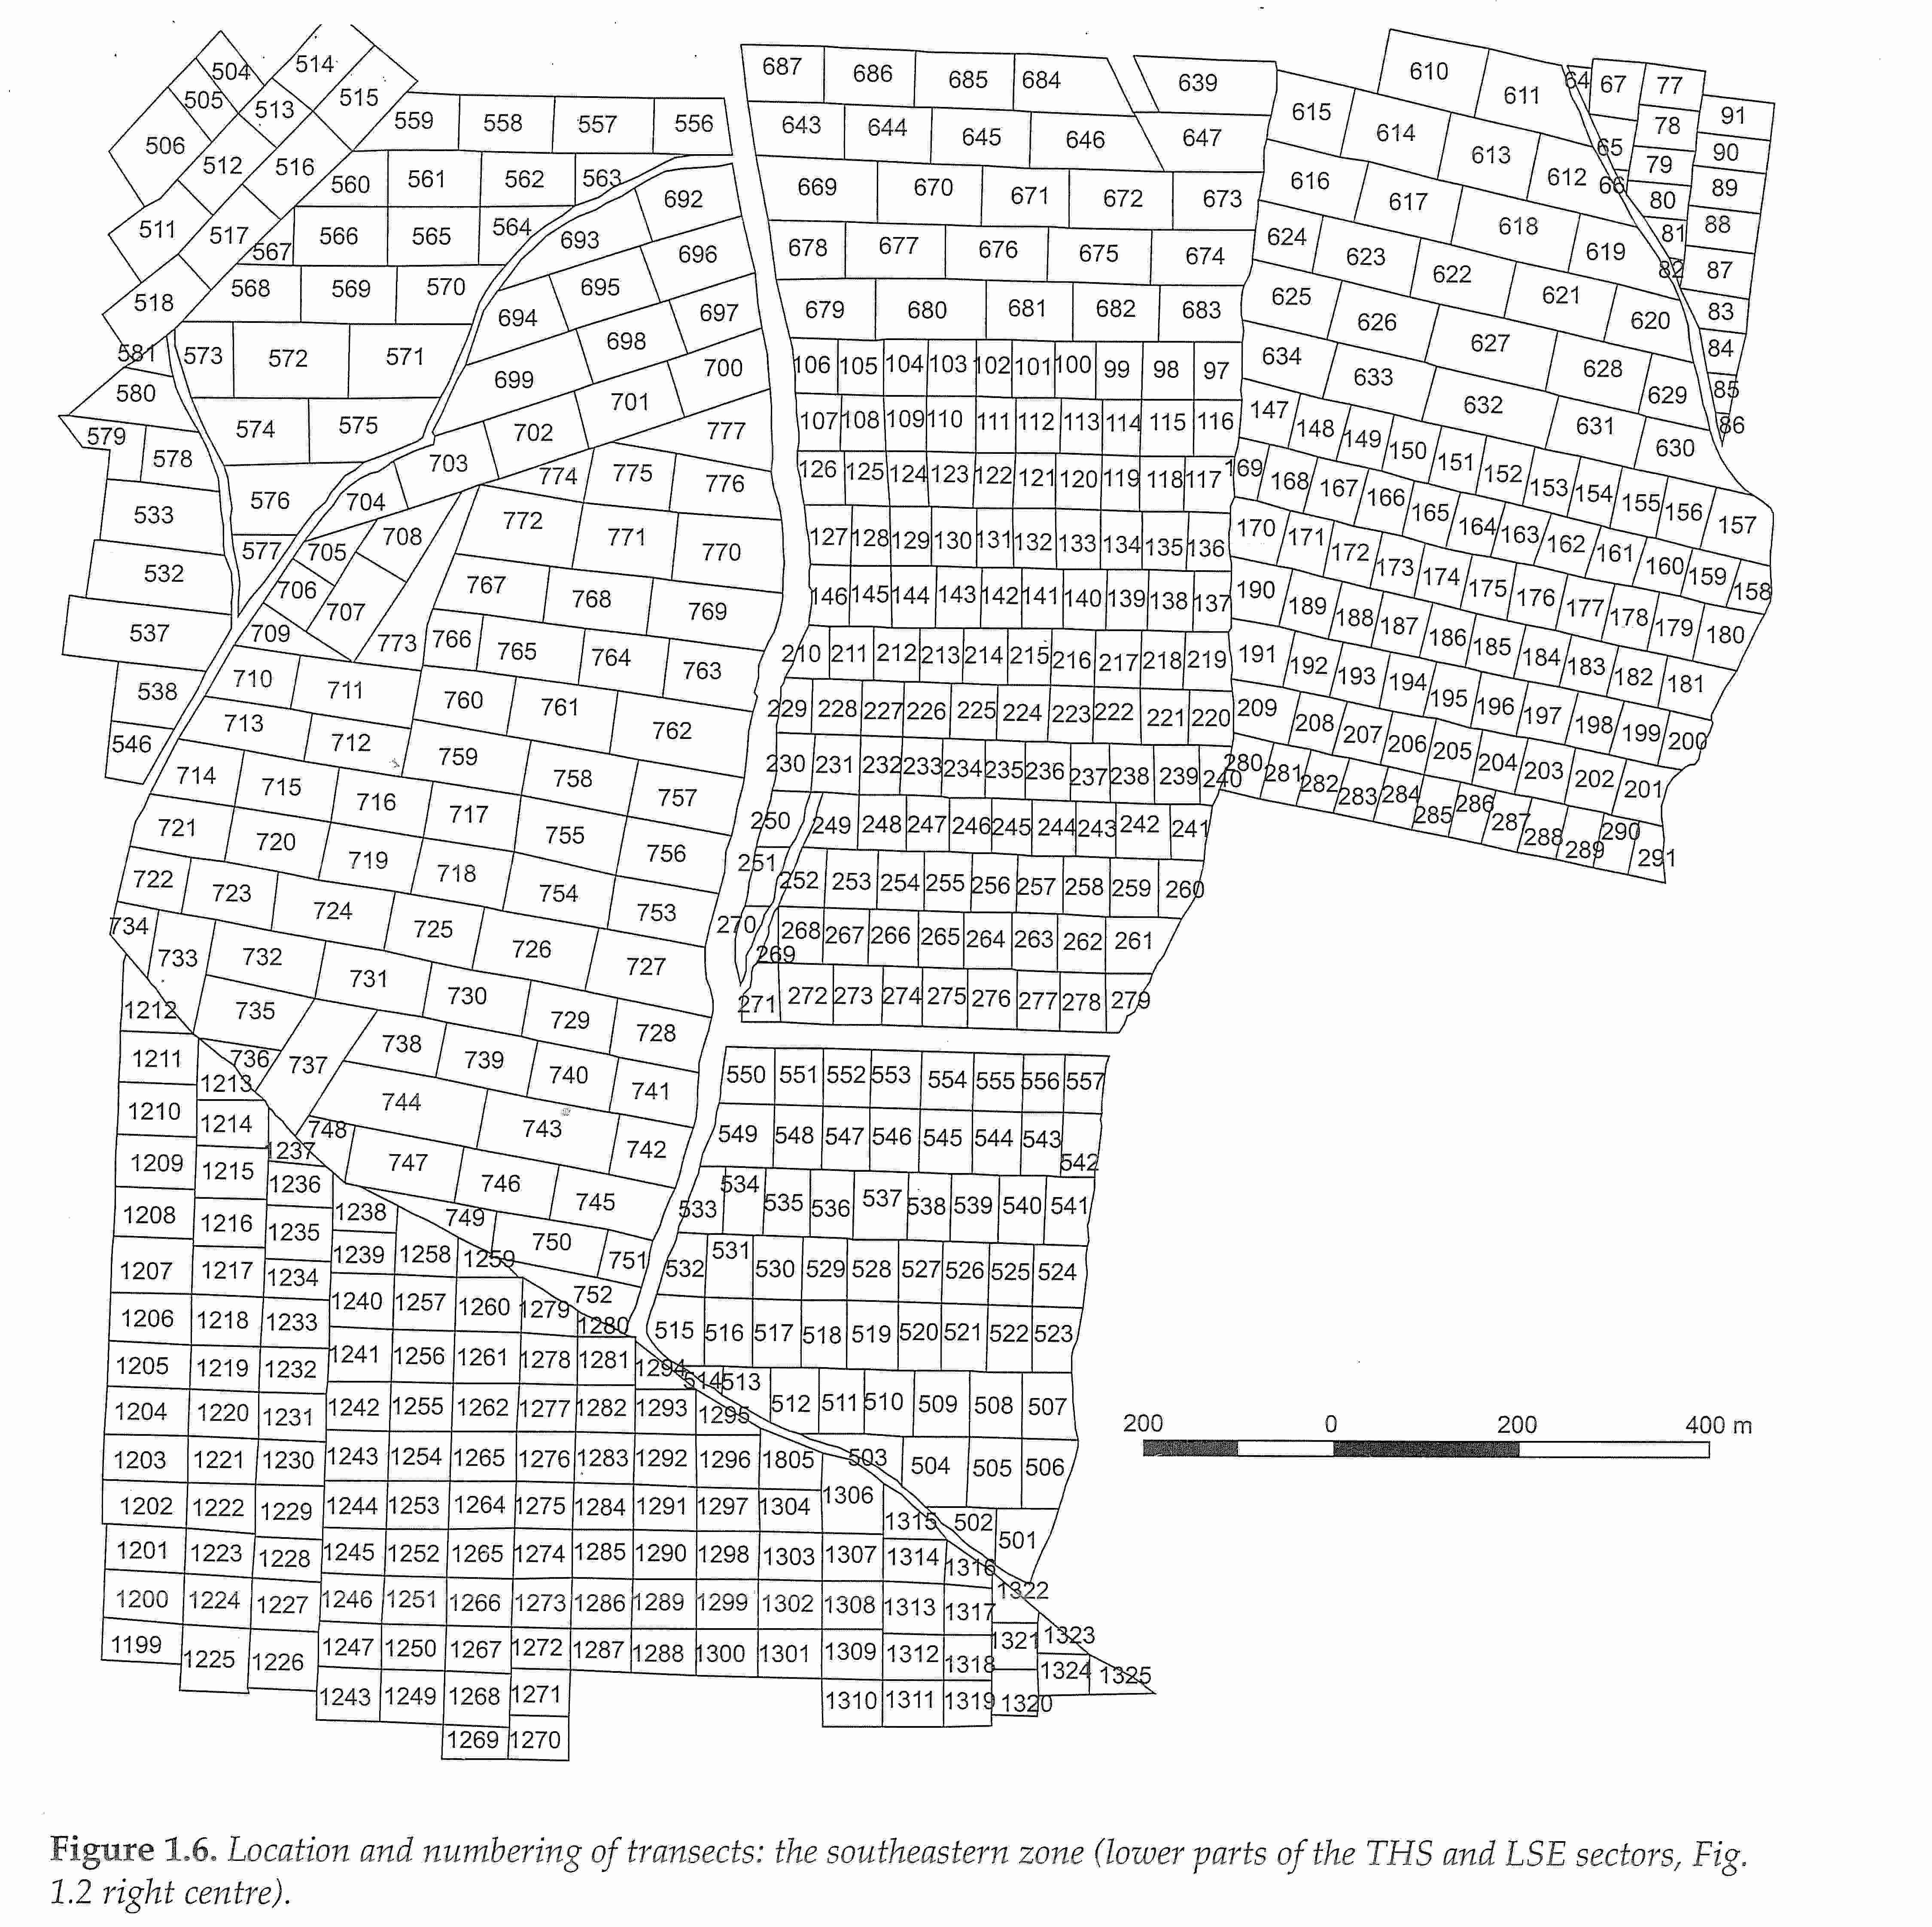
Surprisingly, I could not find the projection used for the geographic data, and I was not successful in guessing it, despite knowing it should be around the site of ancient Thespiae (WGS84: 38° 17' 36'' N, 23° 9' 4'' E; UTM 34S 688117 4240551). Nevertheless, in order to read the data in a GIS as geographical data, I considered the X and Y as UTM coordinates from the zone 34S. It is also surprising that each unit/transect is referenced by a unique point even though it is a surface. Therefore, in order to plot transects based on a unique pair of coordinates, I assumed that the point represented the geometric centre of each surveyed unit. (Within the GIS, I split a surface vector using a Dirichlet Tesselation (Baddeley and Turner 2005; Baddeley 2015) that I intersected with an outer hull.) By this method I succeeded in obtaining a figure that imitates the general shape of the publication. The publication provides a plot of each region of the survey with the transect ID, which I used to check if my results matched the publication (Figures 1 and 2). It is clear that the ID numbers between the publication and my reproduction do not correspond accurately.
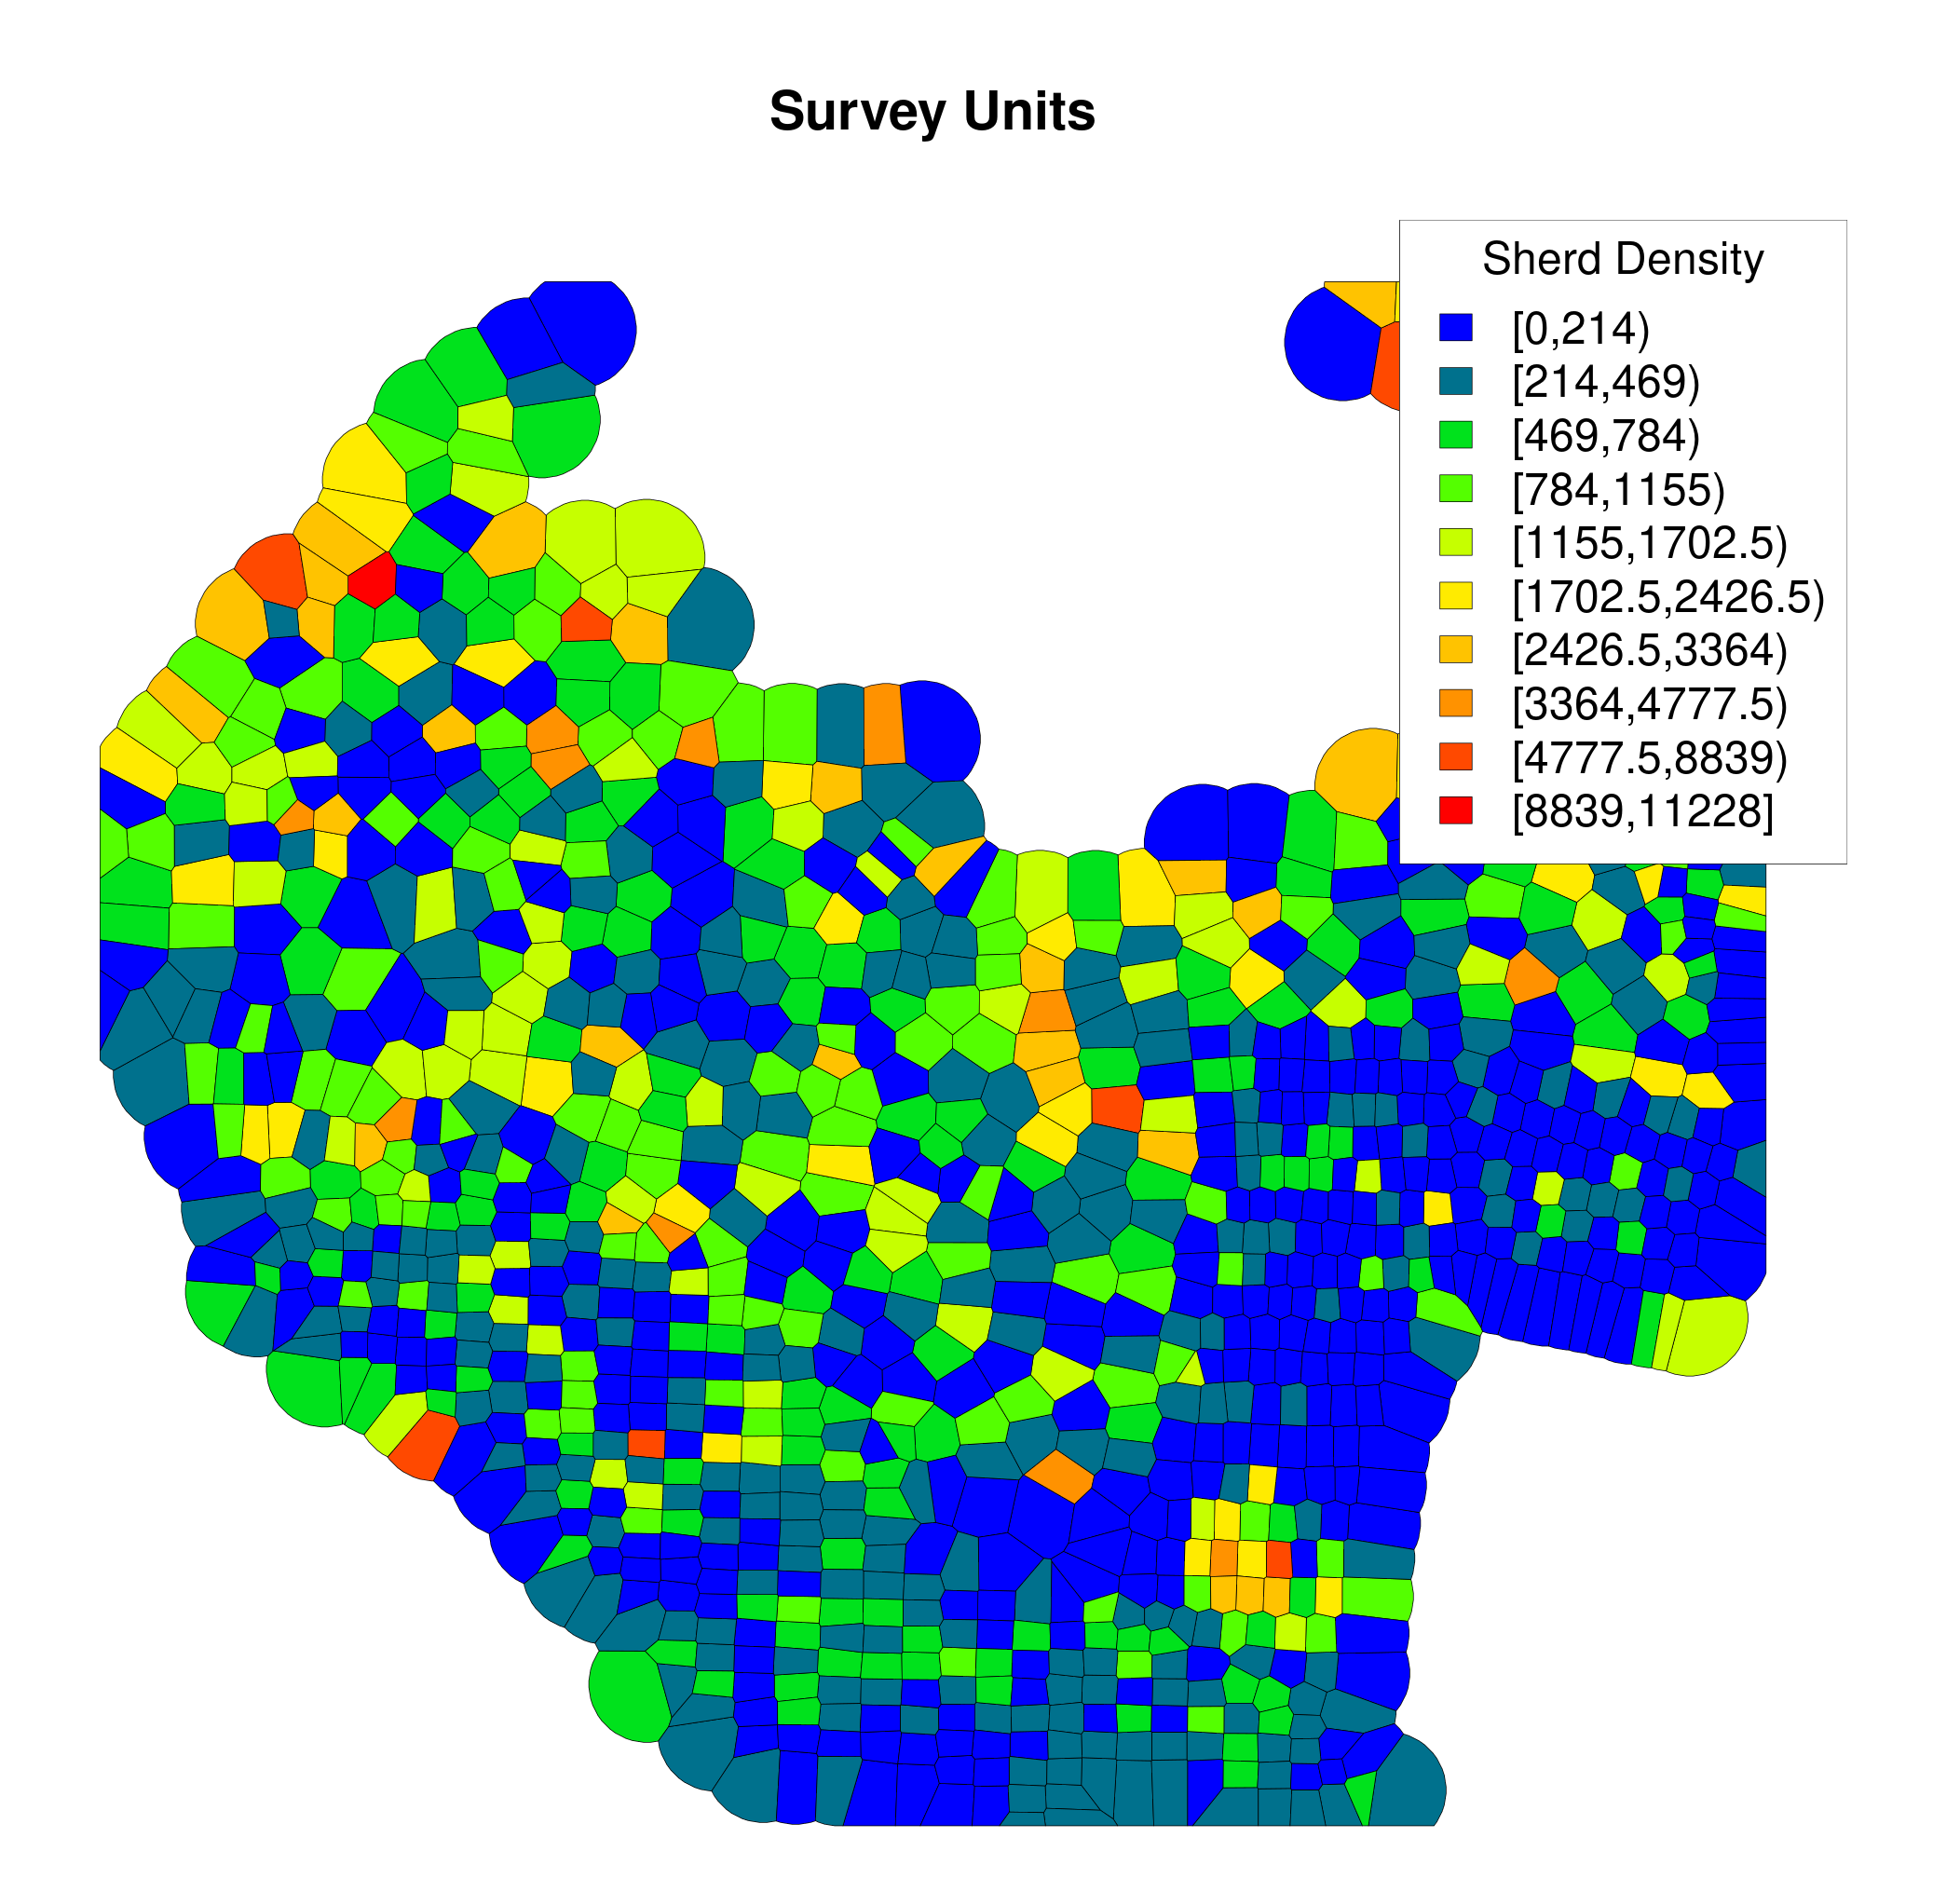
In order to test whether the problem was confined to the IDs, or was a more general problem, I created a plot of the sherd density (Figure 3). This shows a random distribution of sherd concentrations which does not match the results from the publication. I looked into possible errors (as with the projection), but the general shape of my plots indicates that my results are not completely erroneous. After having tried without success to see if I could find a means of re-associating the geographic coordinates with the information, I contacted the publishers of this dataset in November 2017. Surprisingly, despite the wide impact of the results of this project, no (known) previous attempt at reproducing the results had been made.
The case study presented here is not intended to raise doubts about the results of the project and there also is no reason to criticise the data producers. On the contrary, it is one of the first published datasets, and it is clear that this publication had a positive effect on the archaeological community, encouraging others to publish their datasets. While I could have tried to solve the problem by working with the authors, in the interests of surveying the state of the field more widely, I decided to test another dataset. Indeed, my results − willingly and frustratingly left unresolved − show that we, the archaeological community, failed to review the published results properly. This should be a warning to our community not to be too eager to 'consume' results without adequate scientific rigour in our reviewing of such projects.
The Sydney Cyprus Survey Project (SCSP) was an intensive field-walking survey that took place between 1992 and 1997 (Given and Knapp 2003). It was formerly hosted at Macquarie University, Sydney (hence the name), and from 1996 at the University of Glasgow. It was a seminal project for the implementation of some computational methods that have been employed in other projects, such as 'Chronotype', a feature also present in the Pyla-Koutsopetria Archaeological Project (see below).
The data files are curated by the Archaeology Data Service and can be freely downloaded. The files are presented according to how the project archived them; they have not been reorganised, in contrast to other online archiving services. For the SCSP, data are grouped by type i.e. tabular (.csv), text (.pdf), image (.jpg) and GIS Files (Knapp and Given 2003).
In this archive, data grouped in the category 'Text' provide explanations about the meaning of the variable names used in the project database as well as for the GIS files. There is also a file explaining how the GIS was set-up during the project. A good place to start working with the dataset are the GIS Files description. Amongst the details, we can see that the projection used is UTM 36N and that we are interested in the 'Units.shp' file, a geospatial vector file that provides the boundaries for the 1317 surveyed units/transects. The header of each file shows that variable names and values are encoded (Table 2), but the 'Text' folder provides all the necessary information to understand them.
Table 2: Head of the tabular data of the units file (Explanation of variable names is provided in the text files of the project archive)
| ID | SQM_CALC | YEAR | UNIT_ID | UNIT | MODERN_LAN | STATUSADD | SURVEY_DAT | TEAM_LEADE | METHODADD | SPACING | BACKGROUND | GROUND_VIS | TOPOADD | ASPECT_ADD | SLOPE_ADD | GEOLOGYADD | SURFACE_CH | EROSIONAL_ | SEDIMENT_C | SOIL_COLOR | TERRACES_T | TERRACE_US | GLASS_COUN | GROUNDSTON | LITHICS_CO | METAL_COUN | OREFLUX_CO | PITHOI_SHE | SHERD_COUN | SLAG_COUNT | SLAG_ESTIM | TILE_COUNT | TOTALSHERD | ADJVIZ | ADJBG | PROJVIZ | PROJBG | PROJSHERD | SHERDDENS | TILEDENS | SLAGDENS | LITHICDENS | GSDENS |
|---|---|---|---|---|---|---|---|---|---|---|---|---|---|---|---|---|---|---|---|---|---|---|---|---|---|---|---|---|---|---|---|---|---|---|---|---|---|---|---|---|---|---|---|
| 500 | 11972.79 | 95 | 500 | 500 | GA | SU | NA | BC | NA | 0 | + | 40 | Hillside | S | ST | CH | NA | notavai | Shallow | notavail | NIL | N/A | 0 | 0 | 0 | 0 | 0 | 0 | 0 | 0 | NA | 0 | 0 | 85 | 60 | 0 | 0 | 0 | 0.00 | 0 | 0 | 0.00 | 0 |
| 501 | 37246.83 | 95 | 501 | 501 | GA | SU | NA | BC | NA | 0 | + | 90 | Hillside | E | ST | CH | NA | notavail | Shallow | notavail | T | NA | 0 | 0 | 40 | 0 | 0 | 0 | 5 | 0 | NA | 0 | 5 | 98 | 60 | 5 | 8 | 8 | 2.15 | 0 | 0 | 10.74 | 0 |
All the information makes it straightforward to import the data into a GIS and to inspect visually whether the data correspond with the publication (Figure 4). As with the Boeotia and PKAP projects, the survey was organised in 5-metre transects. In order to sample a wider region, however, the units are not all adjacent, the teams covering long north to south strips roughly evenly spaced in the landscape. Units don't have a regular shape because they have been defined in the field according to geology, surface visibility, natural barriers, etc.
One of the distinctive features of the project is how the surface visibility of each unit has been incorporated into the analysis to weight the counted number of artefacts. In my analysis, I attempted to reproduce the implementation of the visibility weighting method.
There are two variables in the dataset about visibility: GROUND_VIS and ADJVIZ, for 'ground', and 'adjusted' visibility. The project recorded the visibility between 0% and 100%. For example, if you could not see the top soil when walking, due to heavy surface coverage, you attributed a value of 0% to the surveyed unit, while bare soil would be rated with 100% visibility. I did not find an explanation about how the adjusted visibility was obtained in the publication. By plotting the two variables it is clear that there is a linear relationship between them (Figure 5).

We can observe that the relationship between the two variables is a kind of 'rescaling' of the data to give an 'Adjusted Visibility' from 75% to 100%. Even though I could not find any reason why it is not strictly linear, I used this as the best approximation in order to weight the pottery counts, as in the publication.
The project applied a certain number of functions to weight the pottery counts based on the adjusted visibility and 'background confusion'. After having implemented the weighting functions as described in the publication (Myer and Gregory 2003) 1, the relationship of counted sherds against projected number of sherds can be plotted. The plot (Figure 6) shows the two variables as provided in the files on ADS (TOTALSHERD and PROJSHERD), with my reproduced data in light grey in the background.

From the reproducibility point of view, the experiments above show that it is possible to obtain similar results, even if they are not identical. There are very small differences between the data provided (shown in red, green and blue) and the reproduction results in light grey. In most cases, the reproduced data (light grey circle) is not visible because it is covered by the original data; the reproduced results are only visible when the results slightly diverge. The difference is minimal and relates to non-perfect matching in recalculating the adjusted visibility (Figure 7). If we plot the results of the adjusted pottery count from the data and from the reproduced data, the colour classifications are identical, even if the exact definition of each class varies2.


To conclude our discussion of the SCSP data, we will make two simple statements: the data are sufficiently documented and well published to be conveniently read and manipulated; and it is possible to verify how the results from the publication have been obtained and to transcode the data into 'ready-made reproducibility'. While not a perfect match, the differences are minimal and do not alter any conclusions drawn from the data. For a dataset published 18 years ago, this is remarkable and proof of the deep understanding of the data by the authors, as well as the care they took when publishing their results.
This project is located on the island of Cyprus and involves an intensive field-walking survey. Situated on the southern coast of the island, the aim of the project is to look at the relationship between the Pyla-Koutsopetria area and other coastal sites on the island. The first monograph about the survey was published in November 2014 (Caraher et al. 2014). This reported on the field work conducted between 2004 and 2011. The associated data were released on Open Context prior to the book's publication (Caraher et al. 2013). Open Context differs from ADS in that each published project is edited and standardised so it can also be available through the Open Context API endpoint. However, each project retains some of the particular features of the survey methods employed in the field, for example the use of 'batches' and 'chronotypes' for the PKAP survey.
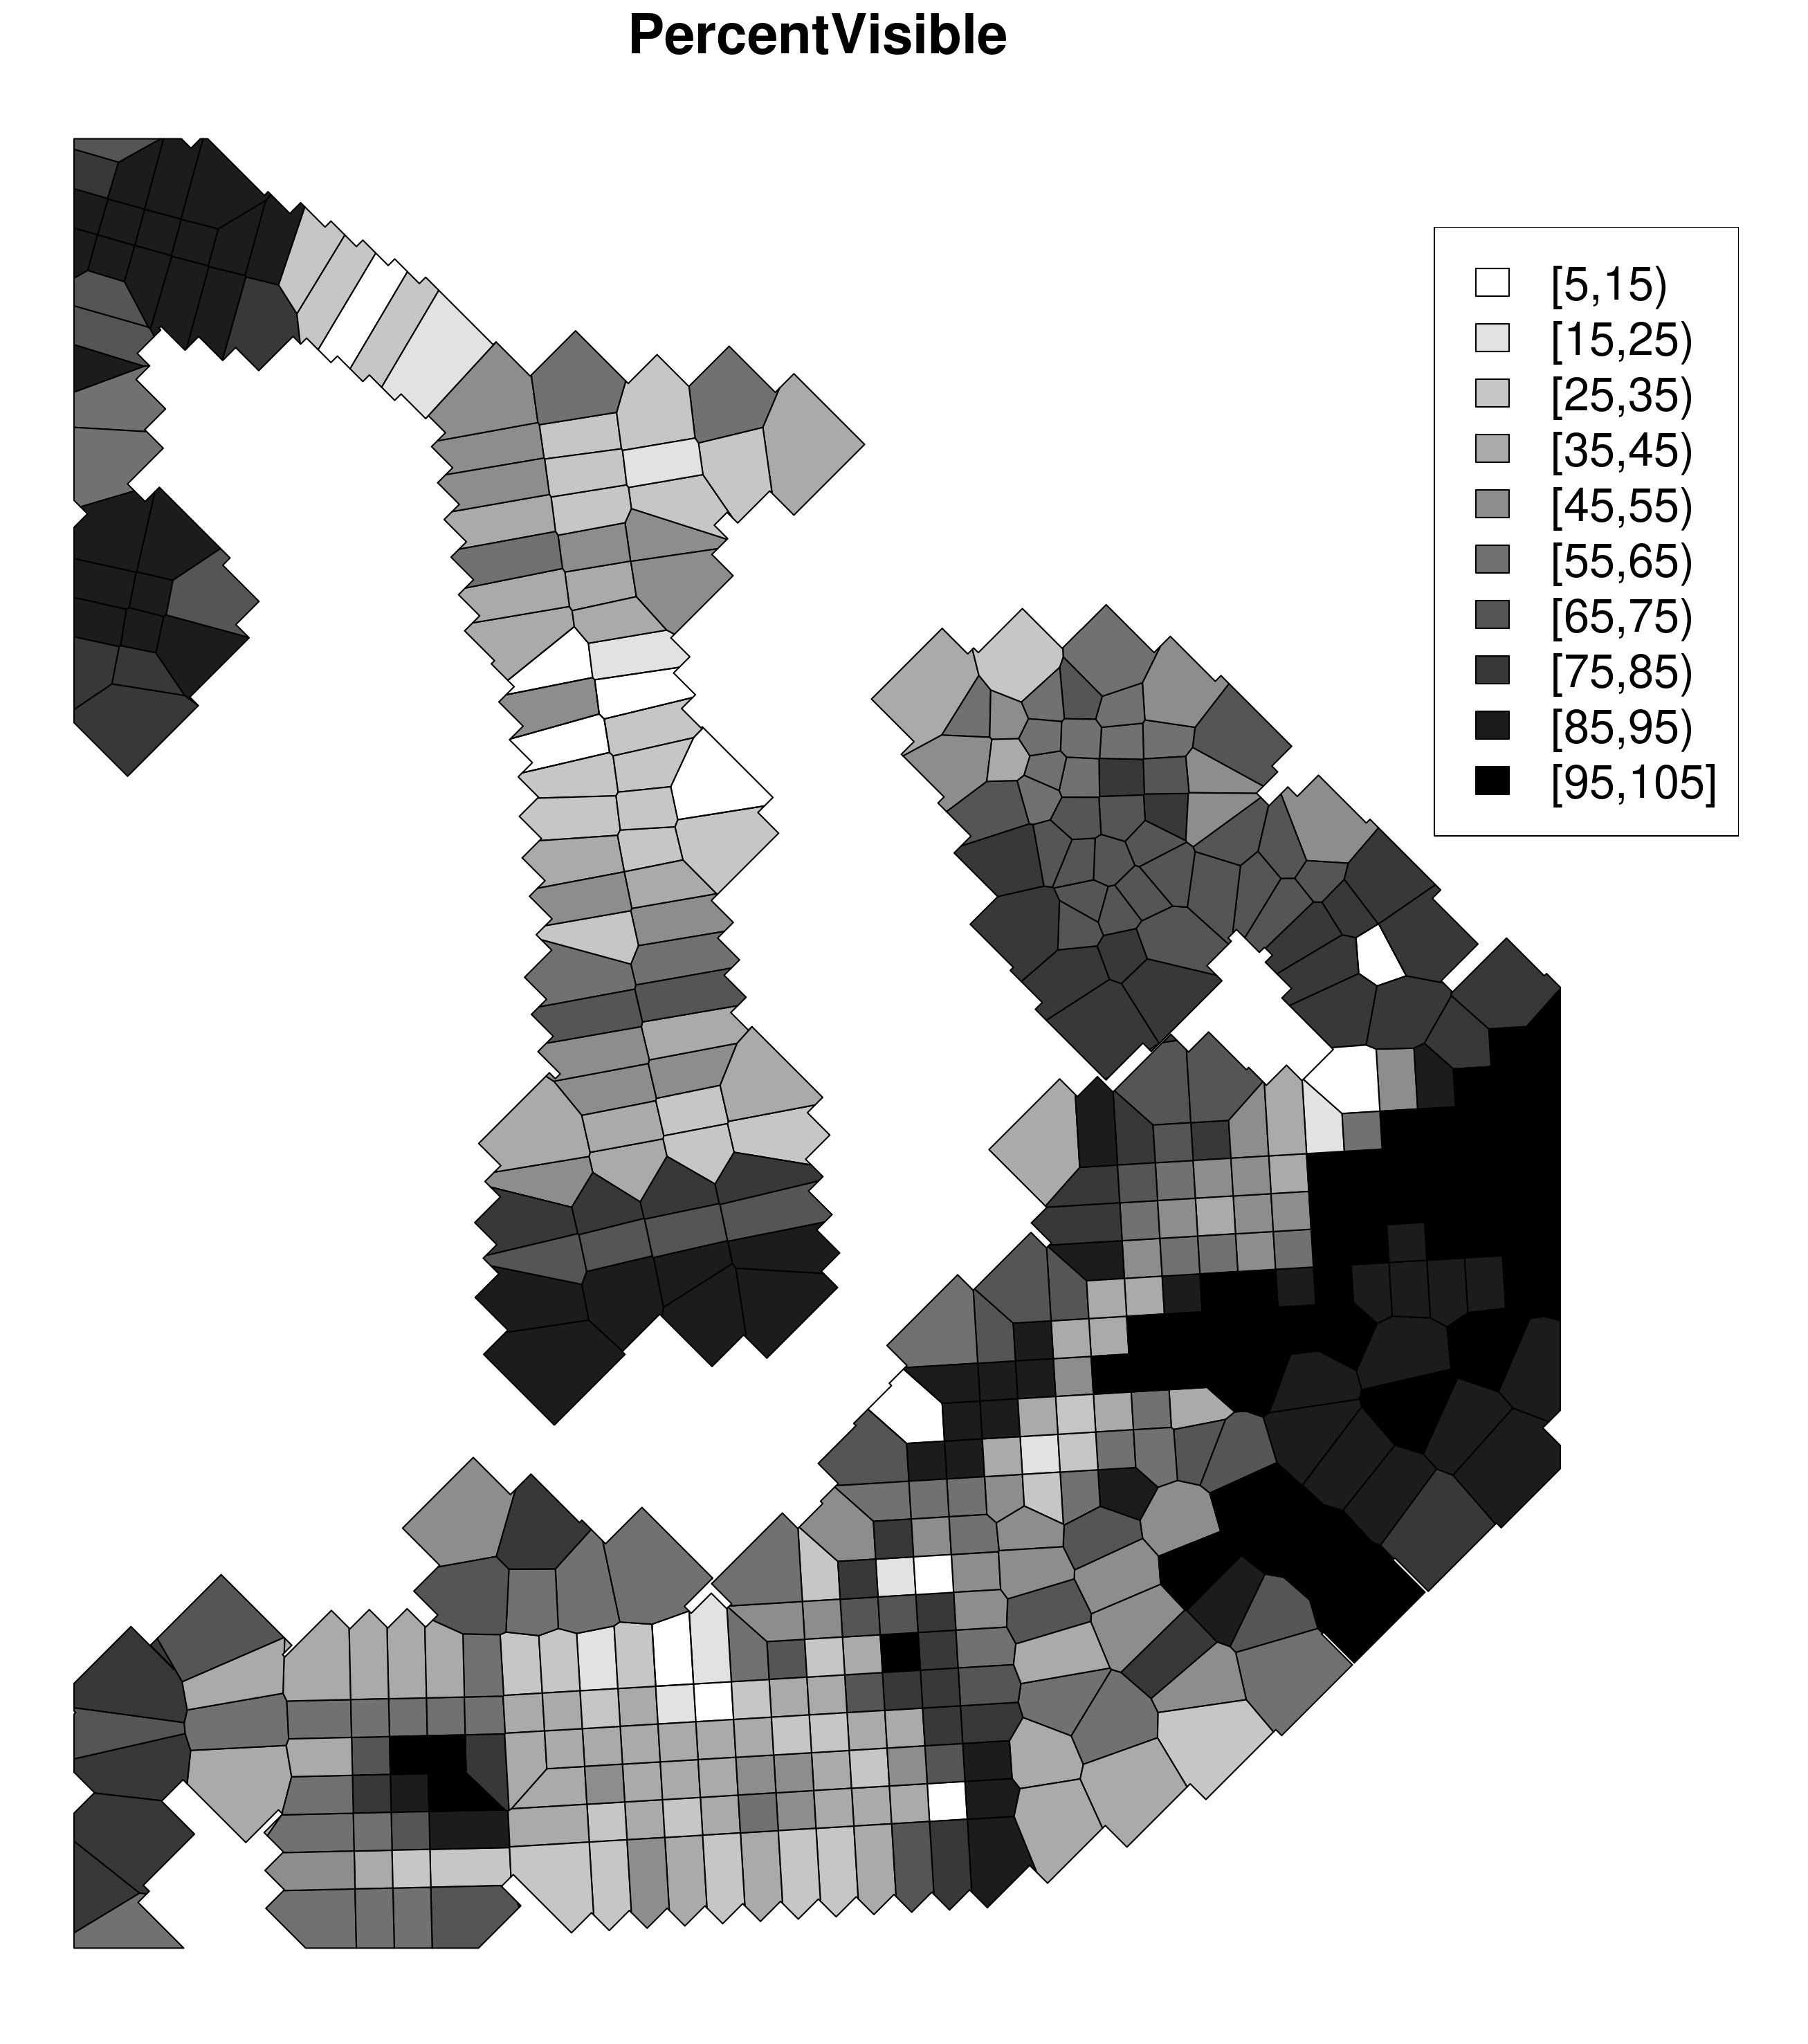
The intensive survey covers 100ha and over 15,000 artefacts have been recorded, as well as features in the landscape. The survey was organised in units of 40 x 40m that were inspected by teams of four field walkers separated by 10m intervals. In order to reproduce their data, we will import two of the files provided to recreate two maps from the book, one regarding ground-surface visibility, and the other finds from the Late Bronze Age period.
The main files published on Open Context are the PKAP Main Survey Unit Descriptions in which each row represents a survey unit and PKAP Main Finds Descriptions in which each row represents a 'batch' – a collection of similar 'chronotypes' (see Caraher et al. 2013, and also Caraher et al. 2014).
After importing and manipulating the data (Appendix PKAP), a sum of 16,785 artefacts was obtained. This is almost identical to the 16,784 artefacts mentioned in the book publication (Caraher et al. 2014, 174). No explanation could be found for the additional artefact.
In both tables (units and batches), each row is associated with a pair of spatial coordinates, i.e. it is represented by a single two-dimensional point. This is surprising as each unit should represent a polygon corresponding to the surveyed surface, as in the Boeotia Project. Therefore, in order to obtain polygons, the same method was employed of a tessellation based on the points. The final dataset of units is not a perfect fit with the publication, but it is sufficiently good to inspect the data and verify the results. The general shape of the imported and plotted data (Figure 8) does correspond to the published data, even if the spatial shape of the units differs as a result of missing information about the unit surfaces. In order to test the reproducibility of the results in the published book, a second file concerning the finds was used to reproduce another map.

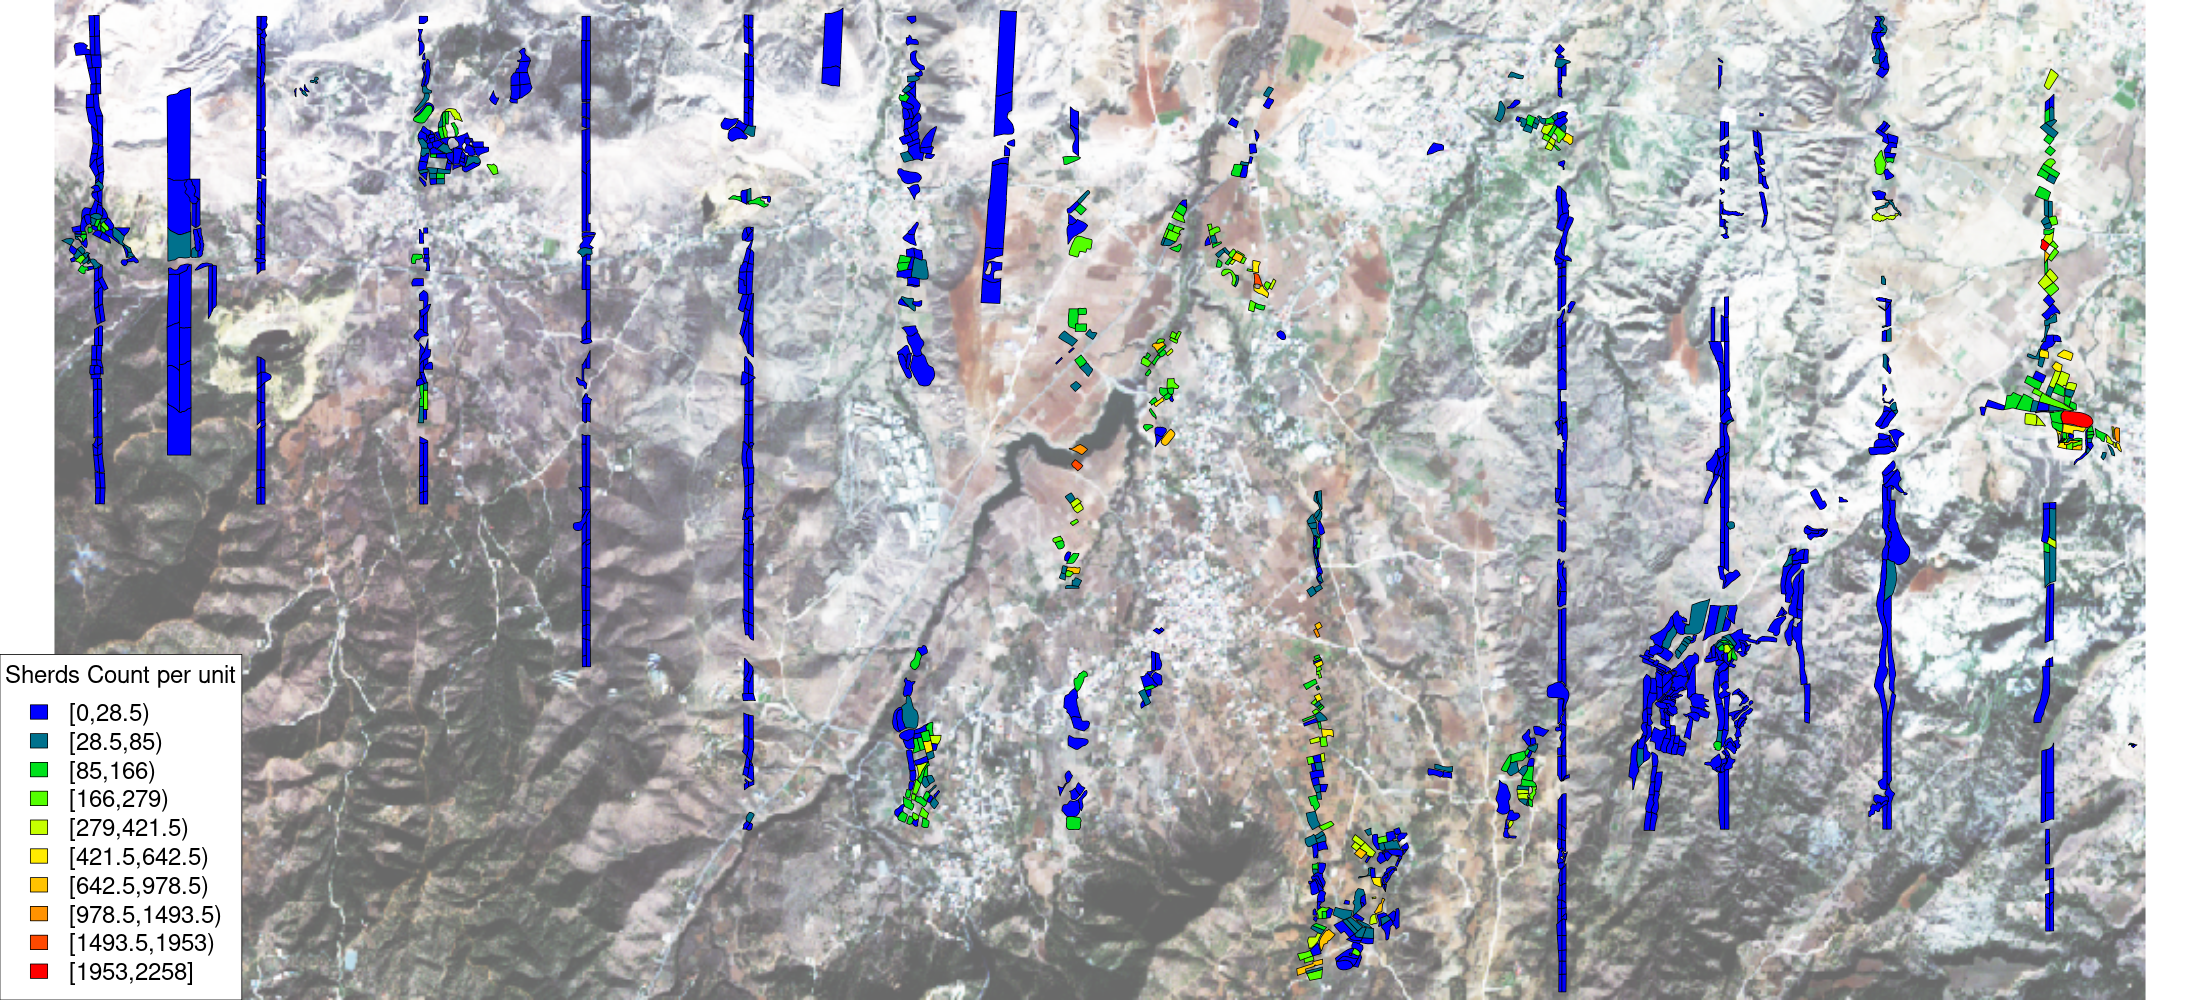
The project uses a 'chronotype system', which assigns every artefact a label referencing its typo-chronological class. It associates each type with the narrowest possible time range, such as 'Amphora, Roman late'. Depending on the context, it can be fine or broad, potentially covering millennia such as 'Pithos Ware, Late Bronze Age-Hellenistic'. During the survey walkers collected at least one example of each part (rim, base, handle, sherds) for each chronotype present in their transect and associated it with a 'batch'. In the dataset, each batch is identified by the coordinates of the unit from which it originates. Thus, a direct plot of the batch dataset results in numerous overlapping points, since instead of seeing 8110 points (i.e. the number of batches), we see 465 points, corresponding to the centre of each unit. To plot the data it was necessary to randomise the coordinates of the batches inside each unit. Moreover, as each batch contains multiple artefacts, I also created a points layer in which each artefact is represented by a unique point (i.e. 16,785 point-artefacts). The publication does not present a map of all recovered artefacts but only provides maps for specific periods. Accordingly, an example of the Bronze Age artefacts is reproduced here. When comparing the results of the original dataset map and the reproduced map, there seemed to be a surprising difference (Figure 9).
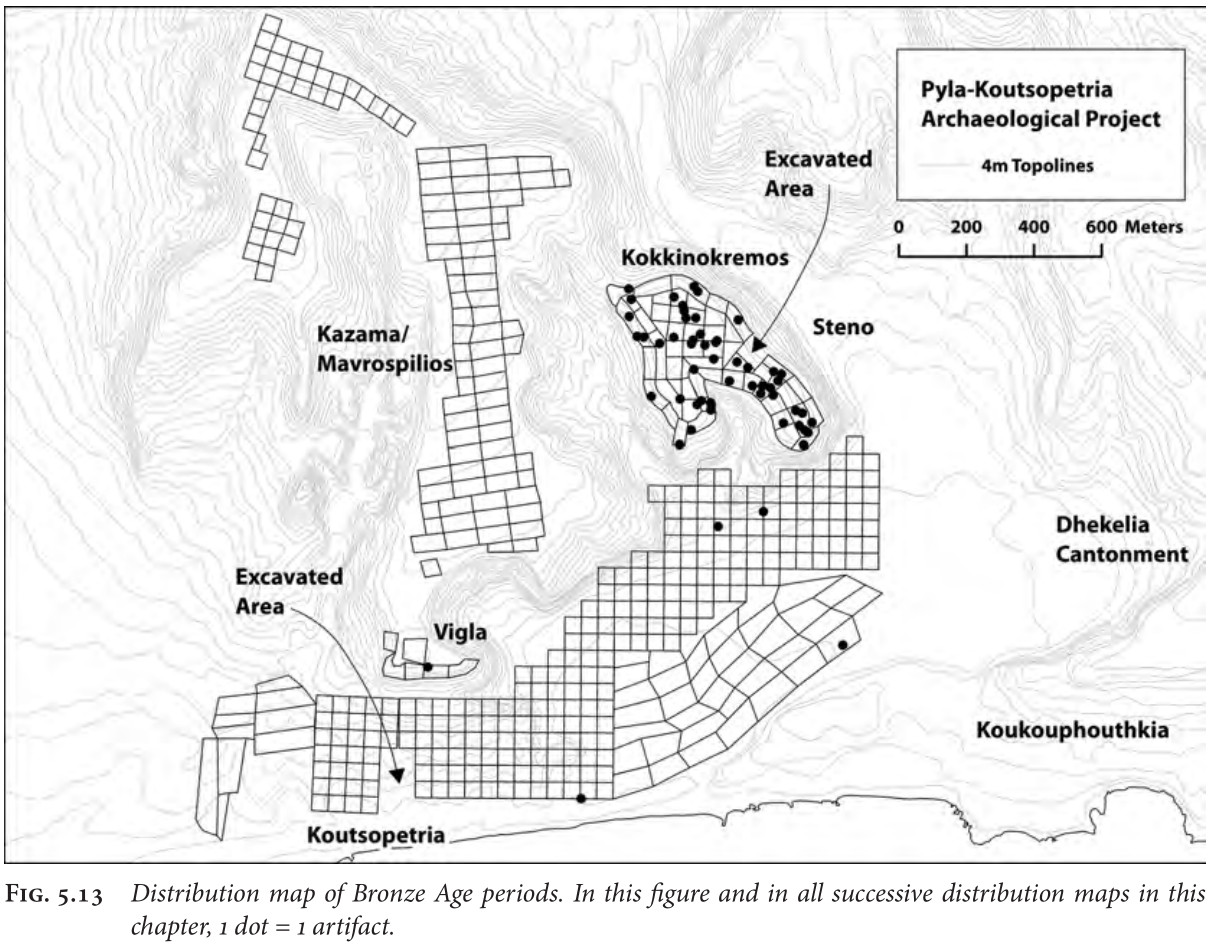
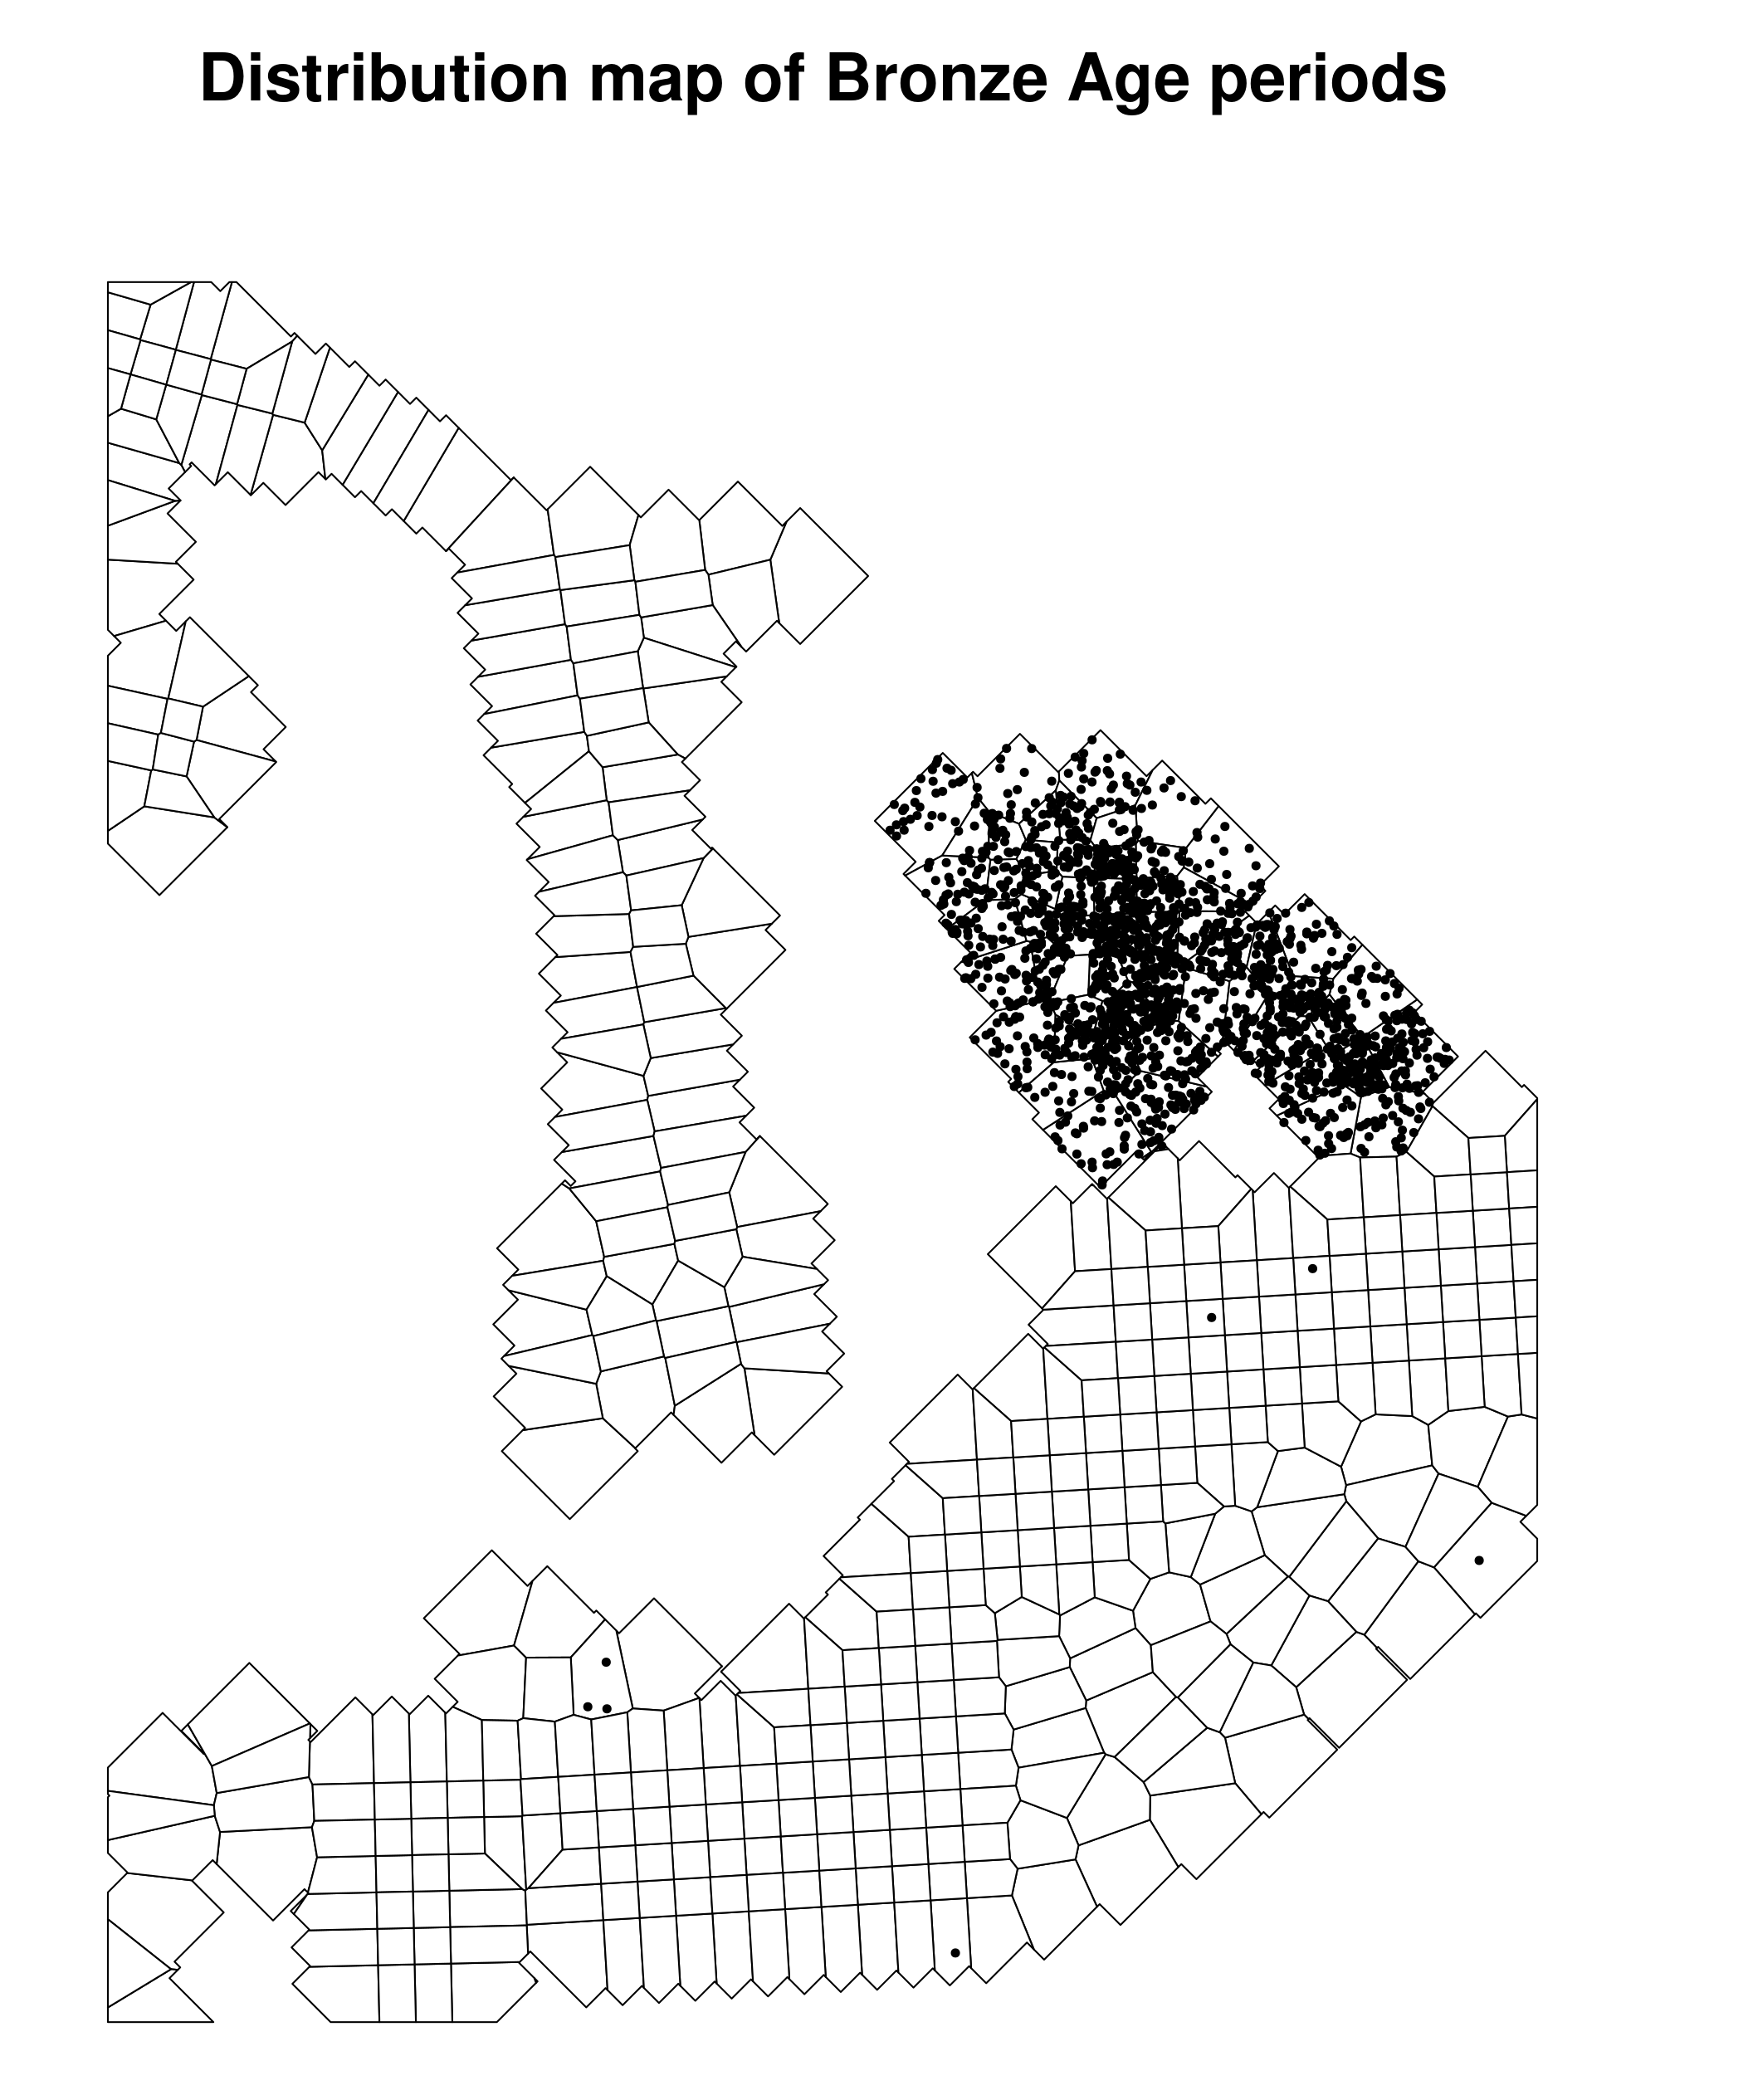
When searching for the origin of the difference, I first looked at the number of artefacts. On both maps, the same polygons have points (or do not); it is the number of points within the polygons where the difference occurs. If we look at an area with very few points, as in the south, we see that there are polygons with only one point in the book as well as in the reproduction. It diverges, however, when we have a lot of points. The caption from the book figure states that '1 dot = 1 artifact', indicating that a count of the different artefacts could provide a hint as to the origin of the difference.
Table 3: Bronze Age periods in the PKAP area. Table published in the monograph (Caraher et al. 2014, 203). It is divided into four main periods, each subdivided into three or four chronotypes.
| Material | Fabric | Chronotype | Part | Quantity | % | % Bronze Age (Inclusive) |
|---|---|---|---|---|---|---|
| Bronze Age (Chronotype) (2,500-1,000 BC) | ||||||
| Pottery | Coarse | Coarse Ware, Bronze Age | body | 1 | 14.3% | 0.5% |
| Pottery | Fine | Fineware, Bronze Age | body | 4 | 57.1% | 2.0% |
| Pottery | Fine | Fineware, Bronze Age | handle | 2 | 28.6% | 1.0% |
| Total | 7 | 100.00% | 3.4% | |||
| Late Cypriot (1,650-1,050 BC) | ||||||
| Pottery | Fine | White Slip, Late Cypriot | body | 2 | 33.3% | 1.0% |
| Pottery | Fine | White Slip, Late Cypriot | handle | 3 | 50.0% | 1.5% |
| Pottery | Med coarse | Wall Bracket, Late Cypriot | body | 1 | 16.7% | 0.5% |
| Total | 6 | 100.00% | 2.9% | |||
| Late Cypriot II (1,450-1,200 BC) | ||||||
| Pottery | Fine | Fineware, Mycenaen, Late Cypriot II | body | 12 | 63.2% | 5.9% |
| Pottery | Fine | Fineware, Mycenaen, Late Cypriot II | rim | 4 | 21.1% | 2.0% |
| Pottery | Fine | Fineware, Mycenaen, Late Cypriot II | stem | 1 | 5.3% | 0.5% |
| Pottery | Fine | Fineware, White Slip II, Late Cypriot II | body | 2 | 10.5% | 1.0% |
| Total | 19 | 100.00% | 9.3% | |||
| Late Cypriot II-Late Cypriot III (1,450-1,050 BC) | ||||||
| Pottery | Med coarse | Egyptian White Slip | base | 1 | 0.6% | 0.5% |
| Pottery | Med coarse | Egyptian White Slip | body | 160 | 92.5% | 78.4% |
| Pottery | Med coarse | Egyptian White Slip | handle | 9 | 5.2% | 4.4% |
| Pottery | Med coarse | Egyptian White Slip | rim | 3 | 1.7% | 1.5% |
| Total | 173 | 100.00% | 84.4% | |||
There is table in the book that outlines the data (Table 3), showing that there are 205 sherds for the Bronze Age period (7 Bronze Age + 6 Late Cypriot + 19 Late Cypriot II + 173 Late Cypriot II-Late Cypriot III). To verify that I was working with the same subset, I reproduced the table (Table 4) and obtained the exact same numbers. However, this reveals that 205 points should be plotted on the map. While at first glance the published map does not appear to display all 205 points, as the original dataset was published without randomising the coordinates, a large number of points would be overlapping. Thus, the combining of each artefact into a batch, which is then plotted by its central coordinates, means that '1 dot' on the published map does not equal '1 artifact'.
There is no doubt that our perception of the finds' distribution is very different between the two maps or are we to interpret the maps similarly? However, who has − until now − noticed that the table and the map did not match in the publication?
Table 4: The reproduced analysis showing the individual numbers as well as sums for each period, proving that the same subset of 205 sherds (7+6+19+173) is being used as in the monograph publication
| base | body sherd | handle | rim | stem | Sum | |
|---|---|---|---|---|---|---|
| Bronze Age | 0 | 5 | 2 | 0 | 0 | 7 |
| Late Cypriot | 0 | 3 | 3 | 0 | 0 | 6 |
| Late Cypriot II | 0 | 14 | 0 | 4 | 1 | 19 |
| Late Cypriot II-Late Cypriot III | 1 | 160 | 9 | 3 | 0 | 173 |
| Sum | 1 | 182 | 14 | 7 | 1 | 205 |
PKAP produced a robust dataset served by Open Context. The way some data are made available could be improved (such as sharing the polygons defining each survey unit or using more randomised coordinates), but these are minor criticisms that can be ameliorated. While the presentation of the dataset is generally good, the reproduction of one precise plot from the book shows, however, that the results generated from that data can differ greatly. It indicates an error in the plotting method in the publication, which I had not noticed when reading the book. I have to concede also that I most probably would not have seen the error if the dataset and the publication had been published in a 'ready-made' reproducible format. It is only the transcoding from 'latent' to 'ready-made' reproducibility and the divergent results that made it apparent. It is probably safe to say that this error does not affect the conclusions of the book: this is a 'systemic' problem and all the maps contain the same error. Therefore, comparing maps within the publication is like comparing distribution clusters rather than artefact distributions; problems will arise mainly when comparing the PKAP publication maps with other surveys.
All the projects discussed here have in common the fact that they shared their datasets. However, there is no guidance about how to deal with error discoveries. What should be done when 'errors' are found? How can be they communicated and to whom? To the data producers (if still active) or the data provider? How should these findings be published?
Of course studies about reproducibility or replication should not make headlines, failing as they do to bring the 'breakthroughs', 'path-breaking discoveries', or 'paradigm shifts' which attract attention (Jamieson 2018). On the contrary, an apprehension shared among researchers is that pointing out errors may cause more damage than benefit. It could harm the reputation of the data publisher or analyser and eventually the credibility of discipline itself. However, remaining inactive may prove even more counter-productive, as we will not be able to answer the question: 'Is archaeology a trustworthy discipline?' How is it possible to invert these potential damages into benefits for the people behind the dataset, the reproducers, and ultimately archaeology and its public?
Reproduction, however, is a difficult task. Recently, the FAIR principles have been developed to provide guidelines to improve the 'Findability', 'Accessibility', 'Interoperability', and 'Reuse' of digital assets by focusing on best practices for publishing data (Wilkinson et al. 2016). Such guidelines and their application to archaeological field-walking surveys may ease the effort needed for reproduction (Haas and Leusen 2020). However, the low number of reproduced studies indicates that incentives to reproduce are few and lack (direct) professional acknowledgement. Moreover, best practices are unknown because as soon as the reproduced results diverge from the expected, the attempt devolves into requests to track down and fix the error. Reproducers have the disadvantage of not being the authors of the data, therefore they have a more limited view of the raw dataset and the biases inherent to each dataset. The case studies presented here show that it is time-consuming to obtain even similar results through basic data manipulation and that reproduction also involves repeated close reading of the details of the analysis in order to understand the methods. Similar to writing and debugging a computer programme, when an error is found, one needs to check the data inputs, or the functions and the code, in order to evaluate how far off the result is from the intended outcome. At the same time, this is a useful process because by forcing a close reading of the data, it strengthens the results of the first publication. This is one of the benefits of external review and reproduction (Silberzahn and Uhlmann 2015; Wilensky and Rand 2007).
In a perfect world, reproduction would be included in the pre-publication review stage, to verify that the paper's claims match the data presented. The code involved for the reproduction becomes useful to the scientific community if it is published and available to the people interested in the dataset and related publications (as well as publicly acknowledging the work done by the reproducers). Currently, the number of publications that focus on reproducibility experiments is low. One reason could be that archaeological data have always been perceived as unique. It is impossible to recreate the same dataset: even two closely related fieldwork projects are different. The importance of supporting reproducible research must first be accepted.
In addition to publication of the reproduction, an optimal solution would be a citational link between the reproduction effort and the original publication. Following the 'credibility revolution', services have emerged recently to provide better acknowledgement of the review process (such as Publons), with some journals proposing (optional) public review (such as PeerJ, F1000Research or GigaScience: see Noorden 2014). In time (hopefully), we will see more reviews with a reproduction effort published by others authors and acknowledged and received by the community. However, few services offer post-publication reproduction publication avenues (such as ReScience C). What steps could be taken to encourage pre- and post-publication reproducibility?
Transcoding is a major tool for learning a subject in its own right and should also occur in post-publication procedures. This is well attested by the popular saying 'practice makes perfect', or an equivalent in any other language, such as the Russian повторение мать учения ('repetition is the mother of learning'). It attests to the almost universal acceptance of potential knowledge acquisition through imitation. By practising reproducibility, people obtain a tool that they can use in their own research. In addition, reproducing fosters shared concepts and practices among a community, helping to establish common practices and promoting mutual understanding (Wilensky and Rand 2007). As such, transcoding could be a part of the archaeological curriculum in order to teach students some caveats of reusing data before they take on the role of being a data producer.
Realistically, however, 'pure' reproducibility will almost never happen. Unlike 'ready-made reproducibility', creating a reproducibility experiment requires one to think about how to reproduce the results, probably in another language or with alternative software to that used by the original publication. As few examples of reproduced studies exist in the field of archaeology, there is no standard governing how and what should be achieved to consider the reproduction 'successful'. How much divergence between the reproduction and the original study is expected and acceptable? Even less explored in archaeology are the problems arising when reproduction 'fails'. Better guidance could ease this lack of clarity and as a result encourage reproducibility experiments.
What to do when the results diverge is complicated. First, the reason for the error must be established. Is it a voluntary or an unconscious mistake? The first, which should be very rare, would be classified as a violation of academic integrity. In this case, it would require contacting the authors and publishers to start a new review process. The second is more likely to be the case, as illustrated above. This requires the author to publicise the results without damaging the reputation of the dataset creators and to call for a careful evaluation of the situation. One of the main concerns is that failure to replicate could be perceived as a threat to the reputation of scientists (Ebersole et al. 2016). Therefore, one should consider carefully how to disclose problems with reproducibility and to try and find a positive process beneficial for the authors, the replicators, and science.
When researchers and reviewers are considering undertaking reproducibility experiments, perhaps one of the most important incentives might be to receive acknowledgement of their work, while at the same time promoting good practice without needlessly damaging the reputation of other researchers. For online publication, the model 'Publish and Push' proposed by Kansa et al. (2014) details the steps needed to update the dataset. The authors argue that datasets may be actualised after their first publication. As with programming, it encourages the use of version-control systems (like Git). These systems can be automated to manage and to track the details of authorship (Strupler and Wilkinson 2017). The principal weakness is in the lack of acknowledgement from the broader community and its sustainability for providing long-term archival storage. In order to increase the number of replication studies, it is important that this work is recognised not only by members of the computationally-inclined community. Otherwise, after updating the dataset, the replication may become obsolete. Moreover, this proposition is operable only if the datasets and the publication are already archived on a version-control system (VCS). For the three case studies presented here, the PKAP dataset is available on a VCS, but not the code in which an error is suspected.
At the beginning of this research in 2017, I began by contacting the authors of the datasets but due to a combination of lack of time and other priorities, I could not follow this up – mea culpa. In the meantime, I came to appreciate that contacting the authors first may not mitigate some of the problems that are emerging from the 'credibility crisis'. Research shows that public disclosure of reproducibility may not harm the reputation of the original authors in the way first thought. On the contrary, judgement for a research paper that could not be reproduced was instead based on the response to replication evidence and how the author accepted or improved their original paper (Ebersole et al. 2016). To investigate this claim, the interplay between the public and software maintenance provides some points to ponder the ramification of error disclosure for personal reputation.
In multiple ways, (Free) Software is considered to be similar to (Free) Science (Kelty 2005), and could provide some insights in to how to deal with reproduction problems. Finding an error in a dataset or (computational) analysis is similar to finding a bug in a computer programme. The correct method for properly publishing and disclosing bugs is a hotly debated topic focused on two practices: 'full disclosure' and 'coordinate disclosure'. The former procedure favours direct, open publication on the internet, with all the details explaining the flaw. It has the advantage of warning both users and producers and the reward is considered to be the reputation gain of finding the flaw in the first place. 'Coordinate disclosure', the second practice, seeks to contact the authors of the software first, giving them the opportunity to correct the software and release an update. Recent developments have seen an increase in coordinate disclosures in a move to avoid flaws being sold to criminals on the black market. Indeed, software companies are increasingly supporting 'bug bounty programs' for which each company publicly declares an offer to pay a certain amount of money for a coordinate disclosure. Importantly, with coordinate disclosure it is not necessary to acknowledge publicly the vulnerability or the people who find it. The reward will not be 'reputation' but real money. Moreover, it corroborates the idea that it is not the publication of the reproduction 'failure' that endangers reputation, but rather how it was dealt with. It is judged as a failure if a company does not adequately respond to a coordinate disclosure by taking the necessary steps to mitigate the problem.
However, beyond the world of computer security, direct monetary incentives are not the norm in science and archaeology. Instead, reputation, trust and integrity are the key values. Therefore it seems preferable to establish 'full disclosure' as a rule, but this should be done with an eye towards protecting the reputation of the data producers. Finding errors in a dataset or analysis does not have to carry negative connotations, but instead should be fully integrated into the process of science. Why does the archaeological community − and the public in general − not consider it as the standard method? It is necessary to create a beneficial atmosphere for data publishers to encourage them to publish the dataset. A dataset in which an error has been found should be interpreted as a dataset that is engaging and relevant. The datasets presented in this article provide varied but similar long-term information on landscape and human interaction in the Eastern Mediterranean. The publication of the datasets makes them a treasure trove of information. Publicising an error is beneficial and not only theoretically; as a proof of concept, this paper utilised 'full disclosure' and I hope that the authors of the datasets will find it acceptable.
More generally, everyone will profit if the process of science, rather than being stuck 'behind-the-scenes', is publicly recognised and affirmed. Science consists of errors rather than truth(s) and what makes science strong is a collaborative, respectful and critical community.
A trait in common across the three projects (and publication platforms) is that there is no direct indication about how to give feedback. It is important to consider the identification of the responsible party. Outside of just error reporting, projects need to clarify who will be in charge/responsible for implementing the corrections. Would a publisher/data-provider be entitled to carry out 'data modification' or should only the authors be allowed to modify their data? What should be done if the data creators do not respond or are no longer reachable?
Finally, what should be done if an 'error' is found, but cannot be mitigated, due to the absence of the required information? There is no perfect solution as to how to resolve all the questions that arise when problems are found and how to report them. As archaeologists will always reuse older data, these are questions that will become more frequent. Data producers and providers should discuss this point prior to publication and publicise it: this is a necessary step to render reproduction practices beneficial and ethical for all.
Reproducing the preliminary analysis of three archaeological survey projects illustrates some of the benefits that transcoding into 'ready-made reproducibility' provides:
If the code for the analysis had been provided, and even when running it, some errors could still be overlooked. However, this should not deter data creators from providing the code. Reproducibility is the minimum requirement for results to be plausible and code availability would already substantially improve the situation. In a perfect world, different reproducibility tests would happen (once) before and (forever) after publication.
It cannot be claimed that the three case studies presented here are representative of the current publication state in archaeology. All the projects and their editors must be thanked for the tremendous efforts invested in the projects and for providing well-organised and documented datasets which provide substantial information on East Mediterranean human dynamics. It is also welcoming to see that between 2004 and 2014 there were substantial improvements in the practices adopted to release datasets. With this background, we now have the chance to pave the way for more reproducibility. Numerous ideas for promoting replication studies and closer reviewing have been proposed, such as 'challenging mindsets that sustain the dysfunctional incentives' or 'journals with peer-review standards focused on the soundness, not importance, of research' (Nosek et al. 2012). Surely, the whole community (funding agencies, researchers, journals, public) should require an independent reproducing and review process. Seeing the (s)low adoption of open data, I doubt, however, that archaeologists will be interested in trying to replicate 'everything'. It is more realistic to encourage and expect in the near future that the reuse of datasets will become more common, especially with the development of 'data mining' and 'big data analyses', as these techniques need to check the data prior to analysis. Which datasets or publications will be reproduced will then be set according to the research agenda.
It is rare to conduct research in archaeology without reusing older datasets. This is still largely done based on syntheses of published material in 'text-form' rather than data. In the absence of a more thorough review, this has the risk of reusing data for which the correspondence between texts and data has not been verified, which could add to the general 'crisis credibility' in science. However, encouraging and rewarding transcoding has the potential to transform the field in providing a positive message when 'wrong' results are found. It is necessary to make this process public in order to reaffirm always that discoveries are not straightforward and that it takes errors and debates to progress.
Code used to reproduce the analyses
I am grateful for the support provided by the Research Center for Anatolian Civilizations (ANAMED) at Koç University (Istanbul, Turkey) with a post-doctoral fellowship in 2016–2017, during which most of the code and first reflections presented here were formulated. Without the support of the French Institute for Anatolian Research (Istanbul), the McDonald Institute for Archaeological Research, (Cambridge), and the Swiss National Science Foundation (SNSF) it would not have been nurtured, completed and published. I am especially grateful to Willis Monroe for improving the English and I would like to thank the reviewers for their helpful comments as well as the editor for the support throughout the editing process.
Bollen et al. (2015) define these as follows:
I will follow these definitions and add the term transcoding, describing the act of converting a message from one language to another. This means that information stored in a particular code (be that computer code or textual description or a mix of both) into another language (such as a script in the R language).
For this article, it is important to note that reproducibility does not imply that computer code is present. Therefore I will differentiate between ready-made reproducibility, when analyses are published with code that exactly reproduces the numbers and figures in a publication, and latent reproducibility when elements necessary to reproduce the numbers and figures are missing from a publication, but theoretically can be recreated from the available information.
An intensive field-walking survey is a transect sampling method widely employed by archaeologists to estimate the spatial abundance of artefacts on the ground surface (Banning 2002; Dieudonné 1989). Field-walking surveys are conducted by teams which systematically prospect a study area divided in units. Team members walk across the sample area, generally in regularly spaced parallel lines, and record visible artefacts.
1. A detail, however, needs to be corrected. The background confusion correction is 'pottery count' * (100/confusion) and not 'pottery count' * (100/(100-confusion)). ←
2. I use here a Jenks algorithm (Jenks 1977). This is somewhat similar to linear discriminant analysis: it tries to minimise within-class sum of squared differences, and maximizes between group sum of squared differences. ←
Internet Archaeology is an open access journal based in the Department of Archaeology, University of York. Except where otherwise noted, content from this work may be used under the terms of the Creative Commons Attribution 3.0 (CC BY) Unported licence, which permits unrestricted use, distribution, and reproduction in any medium, provided that attribution to the author(s), the title of the work, the Internet Archaeology journal and the relevant URL/DOI are given.
Terms and Conditions | Legal Statements | Privacy Policy | Cookies Policy | Citing Internet Archaeology
Internet Archaeology content is preserved for the long term with the Archaeology Data Service (ROR). Help sustain and support open access publication by donating to our Open Access Archaeology Fund.
 Home
Home