Cite this as: Sinclair, A. 2022 Archaeological Research 2014 to 2021: an examination of its intellectual base, collaborative networks and conceptual language using science maps, Internet Archaeology 59. https://doi.org/10.11141/ia.59.10
Science maps are a way of representing the nature of academic research based on networks of relationships identifiable from the metadata of academic documents. They visualise the relationships created by, for example, patterns of authorship, the choice of words used and the ties created from one document to others through citation. Science maps provide a mechanism for visualising the shape and examining the structure of a discipline in an age when academic research results in many millions of research outputs being published each year (see Petrovich 2021). Like an aerial survey of a landscape, science maps offer a perspective of breadth (of topic) and time depth that can identify aspects of a discipline's nature that will merit further investigation through more detailed reading and data collection. Despite the enormous potential of science mapping, and the persistent interest in the history and development of archaeology demonstrated by archaeologists over decades, the technique has been rarely used to map the discipline of archaeology. The first visualisation of archaeological research, based on the metadata of more than 20,000 documents published between 2004-2013, appeared in 2016 and provided a series of three maps based on co-citation relationships between source titles and between authors, as well as the co-occurrence relationships between terms extracted from titles and abstracts (Sinclair 2016). The current study, still only the second attempt to map archaeological research at a discipline level, examines the subsequent period, from 2014 to 2021. It is based on metadata from more than 50,000 documentary research outputs.
Ongoing developments in science-mapping software have increased the range of maps presented to include additional aspects of archaeological research such as co-occurrence networks based on author keywords, as well as the collaborations created by networks of co-authorship between individuals and their institutions. Moreover, an online version of the mapping software used now makes it possible to provide online examples of these maps so that readers can explore them in detail rather than having to zoom in and out of large, stitched images. In so doing it is now easy to search for individual authors, institutions, or terms, and to adjust the clustering parameters of nodes and to adjust the number of links represented between them.
This article will proceed with a brief discussion of the use of document metadata to reveal relationships between documents and provide a window on aspects of academic practice. It will be followed by a longer description of the dataset and the software used. A series of six science maps will then be presented and briefly described. At the end a series of larger issues are identified for more detailed discussion. These include reflections on the growth of archaeological research in terms of its documentary corpus, its academic diversity and the language of archaeology, made possible by comparing the maps presented for the first time here with new maps for the period 2004-2013 covered in the earlier study.
In brief, the maps demonstrate strong continuity in the discipline through time, along with important changes. Archaeology is revealed to be an extraordinarily diverse field of research with multiple specialties across the sciences while retaining strong connections into the social sciences and the humanities and arts. It is the nature of archaeology's engagement with approaches and methods from across the natural, formal and life sciences as well as the research collaborations that are necessary to this work that drives the shape of the discipline. Archaeological research is, in many cases, an inherently multidisciplinary and international activity creating extensive collaborative ties that span continents, between individuals as researchers as well as their institutions. The total number of research documents published is still increasing dramatically and as fast as any other scientific field measured; it is now also dominated by the production of journal articles. Women researchers are more visible among the most cited researchers, particularly in certain research specialties. However, there are certain research specialisms where these maps identify that this process is less visible or even absent. The language used by archaeologists in titles and abstracts presents archaeology as a multidisciplinary field with multiple named specialisms poorly classified within the wider research infrastructure. The impact of archaeology's engagement with other sciences is highly visible. The keywords used by archaeologists emphasise new types of data and technique over the essential processes of dealing with fragmentary and sampled data. Variability in the use of even basic methodological and conceptual terms suggests that archaeologists may need to think carefully about an active curation of their terminology as a controlled vocabulary, if only to aid future researchers in locating their work.
Science mapping uses the metadata for sets of related academic documents extracted from one of the major bibliometric databases such as the Web of Science and Scopus. These metadata are read and analysed as networks of relationships and then graphically represented as two-dimensional images (see Chen 2017 for a recent review of the field). The mapping process identifies academic elements within this metadata as nodes and the relationships between them as edges. Nodes might be authors, institutions, countries, funding bodies, individual documents or source titles - such as journal names, etc. Edges, or links, are the relationships between nodes as revealed by forms of citation, co-occurrence, co-authorship or funding, etc. (see Mickel et al. in press. for a discussion). A clustering process ('community detection') is then used to identify groups of more closely related nodes and these clusters can on occasion be evaluated in terms of their centrality within and betweenness across clusters according to standard network analysis (see Newman 2018). Time-slicing of data makes it possible to examine change through time.
The interpretation of science maps depends upon how relationships between nodes in the map can be interpreted as forms of academic practice (sociological relations) or as forms of intellectual structure (intellectual relations) within a research specialty, through the lens of the effect that these relations have on the nature of the documents produced - the documentary level (see Petrovich 2019). While science mapping itself has only become popular in the last 20 years, the method builds upon an established body of research starting in the 1950s that set out to study the nature and growth of science as both a social and intellectual enterprise, using the quantitative methods of science itself (scientometrics). Science maps explore the nature of the network links between elements of document metadata as a mechanism for examining the changing relationships between sets of academic communities and the knowledge networks they create.
A series of basic document to document relationships are usually at the basis of most science maps. For example,
Science mapping has become increasingly popular in the last 20 years because the enormous number of documents published has made it almost impossible for individual scholars to write histories of a discipline through the reading of individual documents, while the development of specialist software for the analysis of networks in bibliometrics data has resulted in the ability to analyse the relationships within and between documents quickly and at scale.
Science maps would ideally be based on metadata for the full set of documents produced within the area of academic research under investigation. While this may be possible where the focus is narrowly defined (the documents published within a specific journal, for example), as the area of investigation expands, to a research domain for example, the reality is that only a sample of that set will be available. The key requirement for such a sample will be the coverage of a field's literature, the quality of the key metadata (authors, affiliations, dates, titles, abstracts) available. Cited reference information is essential since many forms of science mapping are visualisations of network relationships generated through forms of citation. An additional factor is the ease with which the required bibliometric data can be identified, and then downloaded for visualisation using mapping software.
Most science mapping studies rely on data from the two long-established, subscription-based bibliometric databases (or citation indices). The Web of Science (hereafter WoS), now owned by Clarivate Analytics, traces its origins back to the original Science Citation Index created by Eugene Garfield. The original index was augmented by a Social Science Citation Index in 1973 and an Arts and Humanities Citation Index in 1978 to form the Core Collection. The other major index, Scopus, started in 2004 based originally on data derived from the journal publications of its owner, Elsevier. The scale of publication of academic literature, the original limitations of technology and labour in the process of creating citation databases and initial beliefs about the relative impact of different journals meant that both WoS and Scopus were highly selective in the journals and books they chose to index (see Garfield 1972; 1979; 1996 for the selection rationale behind the production of the WoS Citation Indices). It is widely acknowledged that both index a moderate percentage (15-20%) of journals published when the number indexed is compared to the broader, but still selective, listing of periodical publications compiled by Ulrich's (2022). Selection has a significant impact on all aspects of literature search, research evaluation and science-mapping. WoS and Scopus index many more journals and other documents from publishers based in the USA and Western Europe, along with documents in the English language (at least in terms of a translated title and abstract). Subject-wise, they are both more orientated towards research publications in the Sciences and Social Sciences. WoS and Scopus also require their indexed material to have been peer-reviewed (Delgado López-Cózar et al. 2019). Studies examining relative coverage have shown that Scopus is the larger database with a better representation of documents and books in the Social Sciences and the Arts and Humanities (Martín-Martín et al. 2018; 2021). Both WoS and Scopus have expanded greatly, especially in the last 20 years. This includes an increase in the number of journals indexed (see Bordignon 2019 for a summary of Scopus index additions by subject area) as well as in the range of academic literature indexed. WoS has added a Book Citation Index, an Emerging Sources Citation Index, as well as expanded its Science Citation Index; it has also added a number of specifically regional indices including a Chinese Science Citation Index, a Russian Science Citation Index, an index for South and Latin America, South Africa, Spain and Portugal (the SciELO Citation Index) and, most recently, a Korean Citation Index and an Arabic Regional Citation Index. WoS and Scopus actively curate their indices to ensure the reliability of their metadata. Beside WoS and Scopus, Google Scholar, which gathers document metadata from web pages during the process of indexing those pages for Google searches, is still recognised as holding information on the largest number of academic documents. However, it has always been difficult to use Google Scholar for bibliometric studies since there is no application programming interface through which to download datasets including cited reference data (Delgado López-Cózar et al. 2019; Visser et al. 2021). While there has been some progress in the ability to extract data from Google Scholar (Else 2018) and there is software available that allows for extraction of basic document data (without cited references) for individual scholars (i.e. Publish or Perish software, Harzing 2007), it is still not possible to identify and extract large sets of document metadata. Consequently, Google Scholar remains largely unused as a data source for science mapping. Microsoft Academic, created in 2005 and modified thereafter, provided a comparative dataset to Google Scholar and was compiled in the same way. It has been possible to download data from Microsoft Academic, where available, and it has been used in some science mapping (e.g. Chen 2020), but direct access to this dataset ceased at the end of 2021.
Since 2016, two other databases have become widely available: Dimensions (app.dimensions.ai) and Lens (lens.org). Dimensions has commercial subscriptions for institutions that allow complex analysis of science data, but, importantly, it is free for individual researchers to search for literature and download metadata sets of up to 2500 documents in size, useable for science mapping. Research on database coverage (Martín-Martín et al. 2018; 2021; Visser et al. 2021) demonstrates that Dimensions and Scopus are currently very similar in size and probable coverage. Lens aggregates metadata from a number of sources (including CrossRef, Semantic Scholar, OpenCitations and Microsoft Academic Services). It is free to use and allows downloads of metadata for sets of up to 50,000 documents. Lens now includes data from Microsoft Academic and as a result currently contains much more data on archaeological documents than WoS, Scopus or Dimensions. At first sight, Lens looks like the best source of data for science mapping archaeology. This may certainly prove to be the case in the future, but an examination of a set of downloaded metadata for a set of 50,000 documents in archaeology (collected in January 2022) revealed that more than 50% of the individual document records were missing information on cited references. In 2022, therefore, either Scopus or Dimensions is the best data source for science mapping archaeology. Scopus has been used here owing to its extensive coverage of archaeology in terms of journals and especially in terms of the better coverage of metadata for monographs.
The most common procedure used to locate a document set for discipline-specific science mapping is to undertake a search based on a specific subject category or for a set of journals indexed to a subject category. In Scopus, journals and books are assigned to one of 313 subject categories grouped into 27 larger thematic areas. The assignment of journals to subject categories is not static. New subject categories have been created and existing categories modified, allowing extra subject categories to be added or sometimes deleted from individual journal classifications. The complicated nature of research subject categories and the assignment of journals to such categories have been recognised as a problem for decades since changes (or not) of subject categories affect perceptions of the growth and importance of specific science areas (see Wang and Waltman 2016). This ought to be less of a problem for archaeology since its categorisation(s) by subject has remained essentially static, but it is particularly problematic for multidisciplinary or interdisciplinary research in a field that gets published in journals indexed in another subject category, and archaeology is one such discipline. This is further exacerbated by the increasingly multidisciplinary publication strategies of many high-profile and high-impact journals (e.g. Nature, PLoS One, PNAS, Science among others) that are difficult to assign to any subject category or set thereof but which are highly prized as venues for publication of a wide range of research, including archaeology. Subject categorisation within the bibliometric databases is potentially a significant problem when collecting data on archaeological research outputs; a search based on subject category alone identifies a much smaller number of documents – perhaps as little as 40% of the total (see discussion in Sinclair 2016). Fortunately, one route out of this problem lies in the distinctiveness of the term archaeology itself and its derivatives. Therefore, a document set was identified using a search for "archaeol* OR archeol*" in the title, keywords or abstract. It would also be possible to include the full text of documents in such a search, but this was rejected on the ground that the term archaeology might be mentioned in the full text of documents across multiple research fields as a metaphor for a form of study. The search identifies a series of documents related almost exclusively to archaeological research, but with one clear exception; a small number of documents in the subject categories of astronomy and physics are also included in search results. These documents relate to a research topic called 'stellar archaeology' or 'galactic archaeology', which is the study of galactic evolution through the study of stellar populations, using relative spatial position. These documents were eliminated prior to download by excluding all documents in sources categorised as astronomy or physics.
| Document Type | Scopus | Web of Science | Dimensions | Lens | ||||
|---|---|---|---|---|---|---|---|---|
| 2004-13 | 2014-21 | 2004-13 | 2014-21 | 2004-13 | 2014-21 | 2004-13 | 2014-21 | |
| Articles | 23,517 | 37,405 | 18,147 | 42,979 | 11,751 | 34,827 | 47,885 | 112,094 |
| Reviews | 3,641 | 5,207 | 1,333 | 1,281 | ||||
| Conference Papers | 3,464 | 3,014 | 3,793 | 4,074 | 36 | 158 | 272 | 1,075 |
| Book Chapters | 4,378 | 5,891 | 1,764 | 2,871 | 1,615 | 6,357 | 7,935 | 36,761 |
| Books | 1,438 | 1,750 | 227 | 319 | 519 | 1,547 | 4,227 | 4,834 |
| TOTAL | 36,438 | 53,267 | 25,264 | 48,075 | 13,921 | 42,889 | 60,319 | 157,764 |
A full set of document metadata including the cited references was downloaded for more than 53,000 documents as a series of comma-separated values (CSV) format files. This is a larger set of data than available from either WoS or Dimensions, but smaller than the set identified by Lens (Table 1). Research outputs have been identified as journal articles, books, book chapters and conference or proceedings papers. Journal articles are usually described as either research or review articles. In contrast to the earlier study, metadata for review articles has also been downloaded for mapping. Considerable variation in the number of both types of journal articles between Scopus and WoS, despite similarity in the total number of journal articles, indicates that the long-standing distinction made between review articles and research articles is not reliable, suggesting that research articles in archaeology now include a significant review of prior research as a requirement for acceptance in a peer-reviewed journal. Metadata from documents that are not necessarily research-related (i.e. book reviews, datasets, films, editorial material, and some poetry) were not downloaded.
Finally, as noted in 2016, apart from the absence of metadata for documents published in academic journals but indexed by Scopus, the most significant omission for visualising archaeological research relates to publications deriving from research conducted through the process of professional, developer-related archaeology. Most, though not all, of this research is not published in an academic venue and, even though its findings are beginning to be cited in documents that are academically published, indexed and research evaluated (REF 2022 66-7), remains invisible owing to its exclusion from the major bibliometric databases used for science mapping.
Once downloaded, document metadata are still not fit for mapping and analysis in their raw state. Despite the curated nature of metadata in a database such as Scopus (Baas et al. 2020), there remain, for example, variations in the names of authors owing to the variations in the recording of first name, initials or full first names and initials, or variations deriving from errors in the placement of commas between parts of names and so forth. Variations of the same author's name need to be reconciled to a single form prior to analysis and mapping. Without reconciliation, all variants will be recognised as separate nodes for analysis, clustering and mapping, leading to a fragmentation and possible misrepresentation of relationships. In addition to author names, variations exist in publication source titles, in author's institutional affiliations (due to the complexity of address details), and even to some extent with country names.
The problem of variation is more complicated for maps that hope to represent the language used in a research domain. Lists of terms extracted from titles and abstracts, as well as author keywords include singular and plural versions as different terms (i.e. ceramic, ceramics), letter acronyms along with fully expanded acronym names (i.e. 3rd, x ray diffraction, x-ray diffraction), compound terms (i.e. sediment, archaeological sediment), and so forth. These lists of terms also contain variations in site names (sometimes whole and sometimes fragmented; e.g. sima de los hues; los huesos, sima; sima de), variations in the form of date terms (fifth century bc, 5th century bc), and so forth. They also contain non-content related terms such as publisher names and places, page numbers and so forth. The identification of terms to be mapped must not only reconcile variants to a single form as is the case with authors, institutions, source titles, etc. but should also exclude non-relevant terms that do not help identify discipline-specific terminology. The process of reconciliation requires appropriate subject expertise and judgement concerning the purpose of the interpretive map. For these maps advice has been sought from colleagues with subject expertise in specific areas of archaeological research.
Several free-to-use software packages exist specifically for science mapping, of which the best known are currently VOSviewer, CitNetExplorer, CiteSpace and Bibliometrix (van Eck and Waltman 2010; 2014a; Chen 2016; Aria and Cuccurullo 2017). VOSviewer, created by van Eck and Waltman at the Centre for Science and Technology Studies at the University of Leiden, is now the most widely used science mapping software (Pan et al. 2018). It has been employed in more than 200 published studies. VOSviewer's key strengths lie in the quality of its visualisation of large datasets (up to 10,000 - nodes or edges), and the ease with which users can refine their maps by varying the number of nodes and edges to be mapped or by exploring the possible clusters of nodes through an iterative adjustment of clustering parameters. VOSviewer also provides a mechanism for pre-processing data prior to mapping. VOSviewer has received regular updates over the last ten years. In 2022, it can use datasets from a greater range of sources: WoS, Scopus, Dimensions, Lens, CrossRef, Semantic Scholar. It can map direct citation, co-citation, bibliographic coupling and co-occurrence relationships. It is now able to recognise the full set of authors from multi-author documents, and to read both author and index keywords where they exist. An online version of VOSviewer was launched in July 2021. Readers can now access the maps presented here online and interrogate these maps directly (zoom in on, search for particular nodes, adjust clustering parameters, etc.) rather than explore large image files, or having to download the datasets and run them within their own version of the program. The online version of VOSviewer has also made it possible for users of Dimensions to generate science maps to examine the metadata of sets of documents they have identified through searching the database – although these maps will have no pre-processing of these metadata to reconcile any of the possible variation problems described above. For this study, maps were created using VOSviewer 1.6.18, released in January 2022.
Science maps involve the identification of a complex set of multi-dimensional network relationships between nodes and their representation in two dimensions. Van Eck and Waltman have published extensively about the processes used by VOSviewer (van Eck and Waltman 2007; 2009; 2010; 2011; 2014b; Waltman and van Eck 2013; Waltman et al. 2010; Perianes-Rodriguez et al. 2016), and a manual is available for users (van Eck and Waltman 2022). A few aspects of the processes used are worth noting. VOSviewer starts by generating an adjacency matrix of relationships between nodes (authors, institutions, documents, sources, terms, etc.) based on forms of citation or co-occurrence and using a measure of association strength on normalised data. Mapping and initial clustering happens using the VOS (Visualisation of Similarities) mapping technique, and a form of weighted and parametrised, modularity-based clustering; both processes are derived from the same underlying mathematical principles, thereby avoiding potential conflicts that can arise if based on different principles. VOSviewer allows users to refine the clusters initially identified by adjusting the clustering resolution and/or the minimum cluster size. The manual recommends that this be done using subject expertise and an iterative refinement of the clustering resolution between 1.0 and 2.0. In each visualisation, VOSviewer scales the size of nodes according to citations, occurrences, or link strength (in co-authorship relations for example). It presents labels for nodes to the extent that the labels will not overlap and obscure each other. The number of labels offered will be partly determined by the maximum number of characters in any label specified by the user. Here, this has been set at 30 characters for all maps. Please note, VOSviewer only presents labels in lower case and without character accents.
When mapping the relationships between authors, VOSviewer allows users to specify a maximum number of authors to be considered in case of multi-author documents (set at 25 for this study), and whether author relationships should be based on full or fractional counting. In full counting, each author of a multi-author document is given a weighting equivalent to a single author document (1.0); in fractional counting, authors of multi author documents are given a weighting proportionate to the number of authors of the document (0.2 for an author of a five-author document). Fractional counting is recommended to eliminate the impact of multi-author documents on the mapping of author relationships and this has been used here since the document dataset for archaeology includes both single, joint- and multi-author documents. Terms maps can be constructed using either keywords (author and/or index) attached to a document, or using terms extracted from titles and/or abstracts by natural-language processing (NLP). NLP-extracted terms can be fully counted recording the many times that a term might be used in the text examined, or binary-counted to record the presence/absence of a term. Binary counting is used here.
VOSviewer offers a simple and effective system for pre-processing bibliometric data: the thesaurus file. This is a two-column spreadsheet that helps VOSviewer read an item of metadata (as a potential 'label' for a specific node) and, if necessary, change this to an alternative - 'replace by', or to ignore it if the 'replace by' column is left empty. In this way, a thesaurus file reconciles the variations in metadata discussed above for authors, institutions and so forth. The thesaurus file is used when reading the metadata prior to the recognition of any citation or occurrence relationship and the subsequent creation of any adjacency matrix upon which a science map is drawn. Since thesaurus files exist independently from the mapping of any single dataset (not the case for all other science mapping software), they can be improved over time for mapping particular areas of research. The creation of thesaurus files becomes an ongoing iterative process with the possibility for future development. The thesaurus files used in this study are a development of files first developed in 2016 but now addressing many thousands of variations (author names – 3600+ variations; source titles – 2000+ variations; terms – 2300+ variations; institution names – 4800+ variations). Even so, on detailed inspection of the maps readers will still find examples of variants on author, source and institution names that will be improved upon in future.
In the maps presented in this article, author labels are reconciled to the family name and the maximum number of identifiable initials (to distinguish between authors sharing the same family name). Institutional affiliations are reconciled to the institution rather than a department or research group within, since the inclusion of this more detailed information is highly variable. Source title names are now abbreviated according to the internationally agreed list for the abbreviation of words in serial publication titles set out in ISO 4 of the International Standards Organization. No list of agreed abbreviations exists for the title words of monographs; these maps use a form of abbreviation that will, hopefully, allow specialists to recognise the monograph easily from its label. For maps of terms, thesaurus files are used to change plural to singular forms and to standardise terms such as variants of method terms. Where necessary, term labels have been abbreviated to reduce node label length to less than 30 characters (i.e. geographical information system to 'geogr. inf. system'). Thesaurus files have also been used to eliminate geographical terms, country names and site names wherever possible to focus on the type of evidence, methodology, the interpretive language and the period.
Finally, and perhaps counter-intuitively, the terms 'archaeology'/'archeology' and 'archaeological'/'archeological' have been excluded from these maps using a thesaurus file. These terms were the basis for the selection of documents in the set, so their inclusion and level of use is not a surprise. However, as the most common terms, used in all types of archaeological research, they are difficult to cluster, while the relative size of their nodes will obscure others. Where these terms would have been mapped is noted in the discussion, below, on the basis of a trial mapping using a modified thesaurus file.
A series of six different forms of science map have been prepared. These cover the intellectual base of archaeology by means of two co-citation maps of cited sources and of cited authors; the conceptual language of the discipline through two co-occurrence maps of terms, one of terms extracted from titles and abstracts by NLP; and, finally, the nature of collaboration through two co-authorship maps representing individual authors, and institutions linked through co-authorship. For most maps, readers will find an annotated figure that presents a screenshot image of the map, with separate colour-coded clusters identified, along with a table listing the clusters and cluster colours identified. The most visible clusters in the maps have been labelled in the same colour as the cluster nodes to provide an interpretation of what they represent. In certain maps, the key dimensions that affect the layout of the maps are identified in one of the upper corners of the map. In addition, readers can access the online version of the map to explore. For each map, figures, tables and online maps use the same series of colours for clusters allocated by VOSviewer in order of decreasing cluster size. For the co-citation maps of sources and authors, and the co-occurrence maps of terms, clusters have been given an interpretive description based on a review of the nodes contained within the cluster. The screenshot figures include these same interpretive descriptions presented close to the most visible clusters. For all maps, the number represented has been chosen to facilitate legibility of node labels: readers can adjust this number in the online map. When discussing change over time reference is made back to the period 2004-2013 covered in the earlier study (Sinclair 2016) and an equivalent map for that period is also presented. Since the maps for the original study were fewer in number and based on WoS data, a new dataset for the period was downloaded from Scopus to ensure comparability and these data were pre-processed using the same set of thesaurus files as used for 2014-2021. Figures, tables and online maps are made available here for both the earlier and later periods.
Here the maps will be presented and described in brief, along with a comparative map covering the earlier period from 2004-2013. In Section 6, there is a longer discussion examining the shape of archaeology between 2004 and 2021 through three themes: (1) the growth of archaeological research, (2) changes in the representation of women as highly cited researchers, and (3) the language of archaeology.
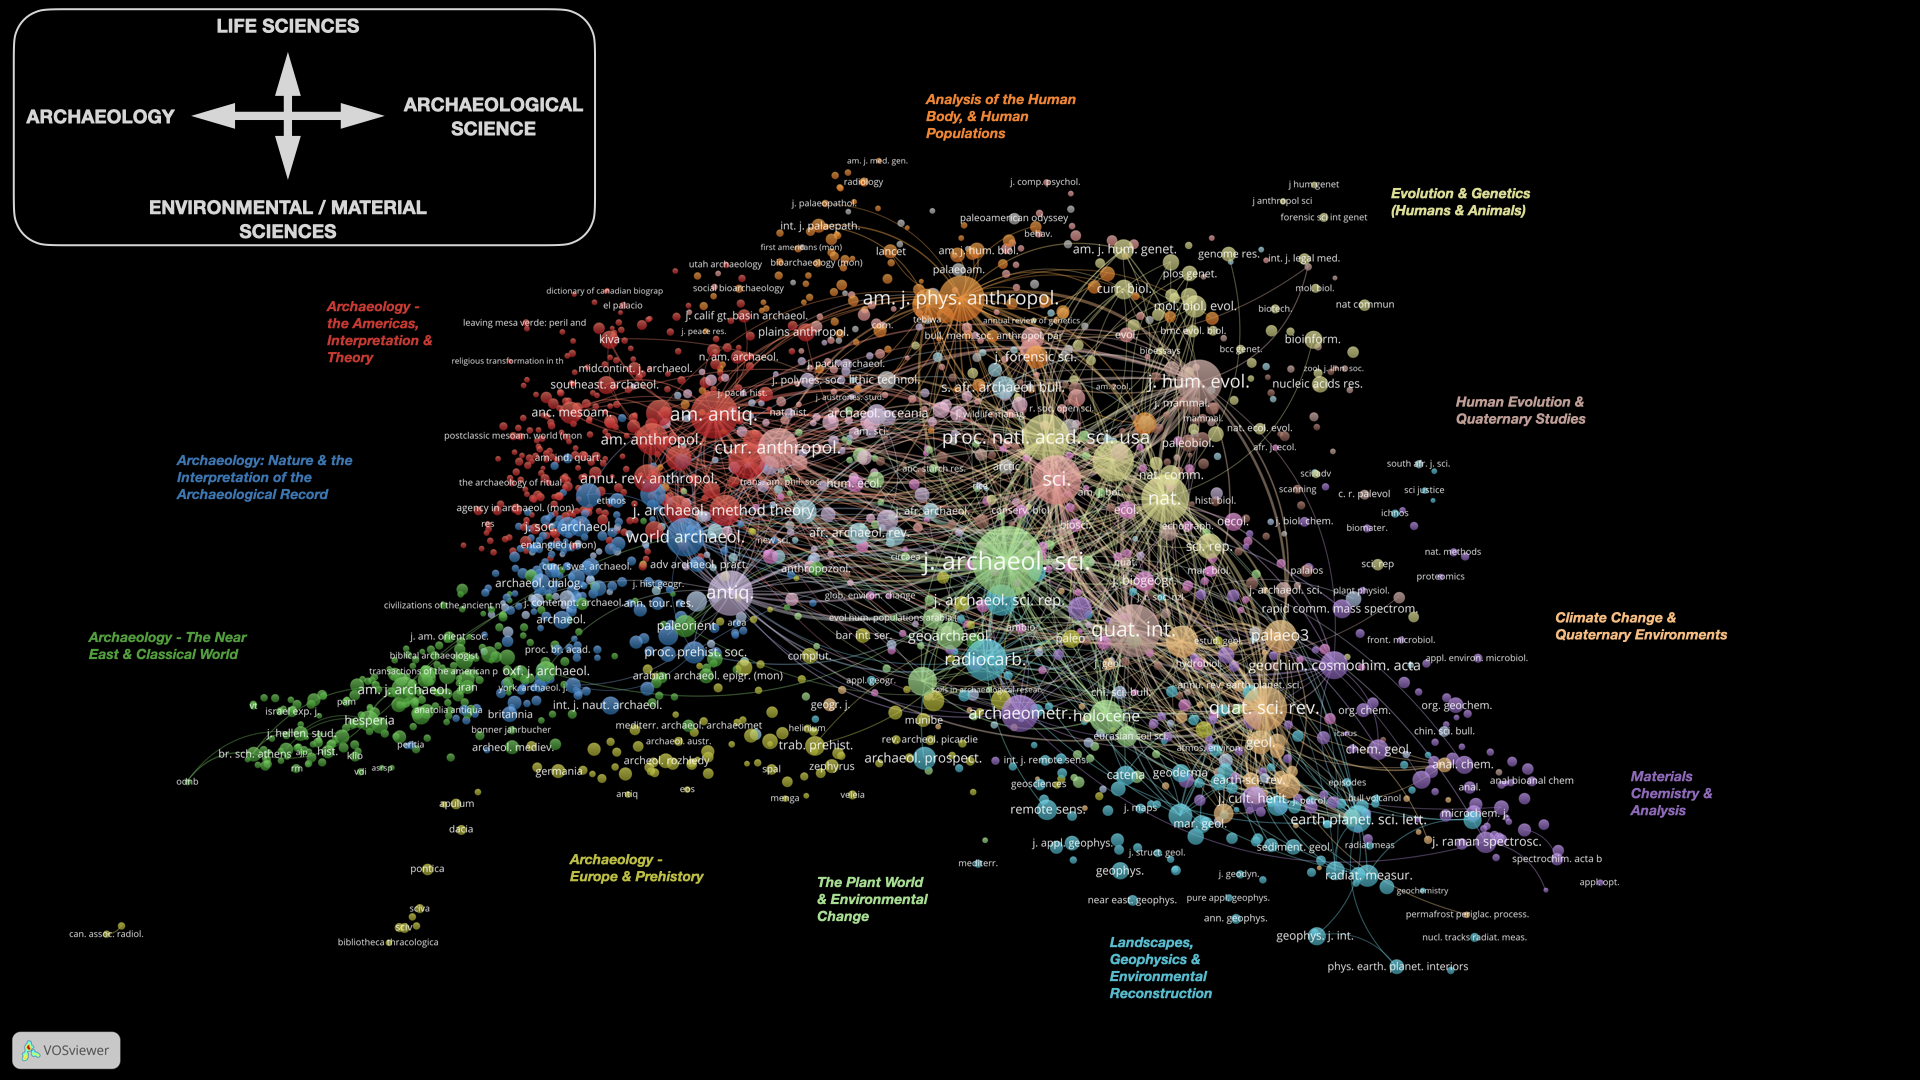
The map of cited sources presents the 1800 most referenced titles from more than 1 million cited. These have been grouped into 19 separate clusters using a minimum cluster size of 35 items, a clustering resolution of 2.00 and a threshold for inclusion set at 80 citations (Figure 1, Table 2). A series of well-known journals are visible as nodes, and the majority of the strongest co-citation links - the edges - links these major titles. The most cited 20 sources are all serials, with 12 of these being focused on archaeological research. The major general science journals (Nature, Science, PLoS One and PNAS) are all present in this group. The Journal of Archaeological Science, situated in the centre, provides not only the most documents in the dataset but is also most cited, with more than 70,000 citations recognised in Scopus. The first monographs do not appear until much later, with the Encyclopaedia of Global Archaeology and then Palaeoamerican Odyssey, A History of Archaeological Thought, Archaeological Theory Today, and Outline of Theory of Practice. All have fewer than 650 recognised citations.
| Node Colour | Cluster Theme | Example Sources within Cluster |
|---|---|---|
| Cluster 1. (282 items) | Archaeology: the Americas, Interpretation & Theory | Agency in Archaeology, Am. Anthropol., Am. Antiq., Anc. Mesoam., Archaeol. Of Ethnicity, Cahokia: domination & ideology, Early Mesoam. Village, J. Archaeol. Method Theory, Peer Polity Interaction, Archaeology of Ritual |
| Cluster 2. (248 items) | Archaeology: the Near East & Classical World | Am. J. Archaeol., Anatol. Stud., Antike Welt., Atlal, Civilizations of the Ancient Near East, Egypt. Archaeol., J. Am. Orient. Soc., J. Hellen. Stud., Near East. Archaeol., Pap. Br. Such. Rome, Z. Papyrol. Epigr. |
| Cluster 3 (186 items) | Archaeology: Nature & the Interpretation of the Archaeological Record | Archaeol. Dialog., Compan. Soc. Archaeol., Archaeol. Theory Today, Art & Agency, Camb. Archaeol. J., J. Conflict Archaeol., J. Mat. Cult., Nor. Archaeol. Rev., Pub. Archaeol., Rethinking Materiality, World Archaeol. |
| Cluster 4 (113 Items) | Archaeology: Europe & Prehistory | Archaeol. Polon., Antiq., Bull. Soc. Prehist. Fr., Consuming Passions, Gallia Prehist., J. Dan. Archaeol. J. Iber. Archaeol., Munibe, Proc. Prehist. Soc., Pyrenae, Trab. Prehist., Zephyrus |
| Cluster 5 (109 items) | Materials Chemistry & Analysis | Anal. Chem., Appl. Clay Sci., Appl. Geochem., Appl. Spectrrosc., Corros. Sci.,Eur., Int. J. Mass Spectrom., J. Soil Sci., Food Chem., J. Am. Ceram. Soc., J. Cult. Herit., J. Raman Spectrosc., Proteomics, Stud. Conserv. |
| Cluster 6 (109 items) | Landscapes, Geophysics & Environmental Reconstruction | Aeolian Res., Ancient TL, Bull. Vulcanol., Front. Earth Sci., Geophys. Res. Lett., J. Appl. Geophys., J. Field Archaeol., J. Struct. Geol., Prog. Phys. Geogr., Remote Sens., Sedimentol.,Z. Geomorphol. |
| Cluster 7 (95 items) | Analysis of the Human Body, & Human Populations | Adv. Dent. Anthropol., Am. J. Clin. Nutr., Anthropol. Sci., Arch. Oral. Biol., Bioarchaeology of Violence, Demography, Hum. Biol., Int. J. Leg. Med., J. Forensic Sci., Lancet, Spine, Yearb. Phys. Anthropol. |
| Cluster 8 (82 items) | Formation Process of the Archaeological Record (esp. concerning deep time) | Am. Zool., Ann. Palaeontol., Bill. Lett., Fossils in the Making, Geobios, Hunters or (the) Hunted, J. Mammol., J. Morphol., J. Taphon., Quat. Rev. Bill., Vertebra. Taphon., Cool. J. Linn. Soc. |
| Cluster 9 (78 items) | Evolution, Ecology and Genetics | Afr. J. Ecol., Annu. Rev. Ecol. Syst., Clim. Change, Ecol., Ecol. Evol., Front. Ecol. Genet., Hum. Ecol., J. Anim. Ecol., Mar. Biol., Niche Construction, Plant Ecology, Trends Ecol. Evol. |
| Cluster 10 (74 items) | Behaviour and Cognition (including hominins & primates) | Am. J. Primatol., Anim. Behav., Biometrika, Curr. Anthropol. Evol. Anthropol. Evol. Biol., J. Theor. Biol., Primates, Proc. R. Soc. b., Trends Cogn. Sci. |
| Cluster 11 (61 items) | The Plant World & Environmental Change | Anc. Starch Res., Ann. Bot., Circaea, Environ. Archaeol., Holocene, J. Archaeol. Sci., J. Ethnobiol., J. Experiment. Bot., New Phytol., Pollen Anal. Pollen Spores, Taxon, Veg. Hist. Archaeobot. |
| Cluster 12 (60 items) | Archaeology in the East including China & India | Acta Geogr. Sinica, Companion to Chinese Archaeology, Archaeol. Res. Asia, Chi. Sci. Bull., Early China, J. Asian Stud., Kaogu, S. Asian Stud., The Silk Road, Wenwu |
| Cluster 13 (57 items) | Evolution & Genetics (Humans & Animals) | Anim. Genet, Am. J. Sci., Bill. Lett., Funct. Ecol., Genome Res, Geobios, J. Mammal., J. Morphol., J. Palaeontol., Palaeoecol., PLoS One, Proc. Natl. Acad. Sci. USA, Syst. Biol. |
| Cluster 14 (46 items) | Archaeology of Australia & the Pacific | Anthropos, Archaeol Oceania, Asian Perspect., Aust. Archaeol., J. Pacif. Archaeol., N.Z. J. Archaeol., oceania, Rapa Nui J., Rock Art Res., Terra Australis |
| Cluster 15 (45 items) | Archaeology of Africa | Afr. Archaeol. Rev., Afr. Stud., Archaeology of South Africa, Azalea Archaeol. Res., J. Afr. Archaeol. J. World Prehist., Name Akuma, S. Air. J. Sci., Sudan and Nubia |
| Cluster 16 (43 items) | Climate Change & Quaternary Environments | Annu. Rev. Earth Planet. Sci., Clim. Dyn., Clim. Past, Int. J. Climatol., J. Quat. Sci., Palaeo3, Quat. Res., Quat. Sci. Rev., Tracking Environmental Change Using Sediments |
| Cluster 17 (38 items) | Human Evolution & Quaternary Studies | Axe Age, Before Farming, C.R. Palevol., Human Career, J. Appl. Physiol., J. Hum. Evol., J. Archaeol. Sci., J. Quat. Sci., Quat. Int., When Neanderthals (&) Modern Humans Met |
| Cluster 18 (37 items) | Archaeology of South America | Andean Archaeol., Arqueol., Bol. Arqueol. Pucp., Chungara, Dialog. Andino, Estud. Atacam., Magellania, Napa Pacha, Rev. Chil. Antropol. Rev. Mus. Antropol. |
| Cluster 19 (37 items) | Archaeology of the First Peoples of North America | Alaska J. Anthropol., Arctic Anthropol., Can. J. Earth Sci., Clovis: Origins & Adaptations, First Americans, Palaeoam., Tebiwa, The Palaeoindian and Early Archaic Southeast |
At a broad scale the map reveals a structure that places the recognisable archaeological sources to the left (including almost all the books) and titles for the publication of aspects of science to the right. These science-based titles occupy about two-thirds of the map's distribution of nodes. There are four major clusters of archaeological publications visible dealing with Europe and its prehistory, the Near East and the Classical World, archaeology in the Americas with a clear interest in interpretive debate, and a cluster that can be interpreted as more about the interpretation of the record. In the science side of the map, we can see clusters related the analysis of the human body and populations, genetics, climate change, the plant world and environmental change, landscapes and geophysics and materials analysis. The exception to this division is a cluster of titles related to the study of human evolution typified by the Journal of Human Evolution and Quaternary International. Within the map, but less immediately visible are smaller clusters of nodes that relate to the archaeology of specific regions (Africa, Australasia and the Pacific, and China and the Far East, and the earliest colonisation and occupation of North America) as well as a science cluster related to behaviour and cognition within which Current Anthropology, Evolutionary Anthropology and Science are clustered. The relative placing of science-focused titles also points to a second broad division between research that relates to the human body and its associated life sciences at the top, and research related to the environmental and material sciences at the bottom.
| Node Colour | Cluster Theme | Example Sources within Cluster |
|---|---|---|
| Cluster 1. (297 sources) | Archaeology - the Americas, Interpretation and Theory | A Phenomenology of Landscape, Agency in Archaeology, Archaeol. of Communities, Archaeological Ethics, Camb. Archaeol. J., Engendering Archaeology, Our. J. Archaeol., How Societies Remember, J. Archaeol. Method Theory, J. Soc. Archaeol. Native Americans and Archaeologists, Reading the Past, Social Theory & Archaeology, Social Logic of Space, Theatre/Archaeology, World Archaeol. |
| Cluster 2. (284 sources) | Archaeology - The Near East and Classical Civilisations | Am. J. Archaeol., Anatol. Stud., Antike Welt., Archeologia, Bull. Inst. Class. Stud., Civilizations of the Ancient Near East, Class Quart. Egypt. Archaeol., J. Am. Orient. Soc., J. Hellen. Stud., Near East. Archaeol., Pap. Br. Such. Rome, Z. Papyrol. Epigr. |
| Cluster 3 (168 sources) | Latin American Archaeology | A Forest of Kings, Anc. Maya pol. Econ., Arqueol. Mex., Boletin. De Lima, Chan Chan Andean Desert City, Chungara, Economies Politics Aztec Realm, Stud. Cult. Maya, Early Mesoam. Village, J. Archaeol. Res., J. Field Archaeol., Napa Pacha, Revisit Andina, Zapotec Civilisation |
| Cluster 4 (155 sources) | Materials Chemistry and Analysis | Anal. Chem., Appl. Clay Sci., Appl. Geochem., Appl. Spectrrosc., Corros. Sci.,Eur. J. Mineral., J. Am. Ceram. Soc., J. Cult. Herit., J. Mass Spectrom., J. Nuc. Mat., J. Raman Spectrosc., Pottery în Archaeology, Stud. Conserv. |
| Cluster 5 (150 sources) | Landscapes, Geophysics and Environmental Reconstruction | Ann. Geophys., Appl. Geogr., Archaeol. Prospect., C.R. Geosci., Geoarchaeol., Geophys. J. Int., J. Clim., J. Soil Sci., Prog. Phys. Geogr., Z. Geomorph. |
| Cluster 6 (130 sources) | North American Archaeology (prehistoric) | Am. Antiq., Am. Anthropol., Archaeol. Method Theory, Cahokia, El Palacio, Histories of Maize, Hopewell Archaeology, Kiwa, Mississippian Political Economy, Plains Anthropol., Archaeology of Death, Wis. Archaeol. |
| Cluster 7 (130 sources) | Zooarchaeology and Animal Biology | Am. Zool., Ann. Palaeontol., Biol.. Lett., Cladistics, Episodes, Geobios, Glob. Ecol. Biogeogr., J. Mammol., J. Morphol., J. Zool., Mammal, Mar. Biol., Palaeogeogr., Palynol., Syst. Biol., Zooarchaeology and Conservation Biology |
| Cluster 8 (115 sources) | Archaeology in the UK & Europe | Acta Archaeol., Anglo-Saxon England, Archaeol. J., Britannia, Europe's First Farmers, J. Dan. Archaeol., Offa, Oxf. J. Archaeol., Proc. Prehist. Soc., Proc. Soc. Antiq. Scot., Slov. Archaeol., Ulster J. Archaeol. |
| Cluster 9 (89 sources) | Scientific Analysis of the Human Body | Adv. Dent. Anthropol., Am. J. Clin. Nutr., Am. J. Phys. Anthropol., Anthropol. Sci., Arch. Oral. Biol., Archaeology of Disease, Forensic Sci. Int., Hum. Biol., Int. J. Leg. Med., J. Archaeol. Sci., J. Forensic Sci., Lancet, Spine, Yearb. Phys. Anthropol. |
| Cluster 10 (88 sources) | Palaeolithic archaeology and quaternary environments in Europe | Anthropol. (Fr)., Boreas, Bull. Soc. Prehist. Fr., Clim. Past., ERAUL, Honour Among Thieves, Human Revolution, J. Quat. Sci., Munibe, Neanderthal Legacy, Pyrenae, Rethinking the Human Revolution, Trab. Prehist., Zephyrus |
| Cluster 11 (82 sources) | North America Palaeoindians | Alaska J. Anthropol., Arctic Anthropol., Complex Hunter-Gatherers, Entering America, Foraging Spectrum, Inuit Studies, J. Anthropol. Archaeol., Lithic Technol., Projectile Technology, Theory Building in Archaeology |
| Cluster 12 (69 sources) | The Origins of Agriculture (esp. China & S.E. Asia) | Acta Geogr. Sinica, Ancient Jomon of Japan, Antiq., Early China, Foraging and Farming, J. Asian Stud., J. E. Asian Archaeol., Kaogu, The Archaeology of Ancient China, Village on the Euphrates, Wenwu |
| Cluster 13 (69 sources) | Ancient DNA, and studies of change in Plants and Humans | Am. J. Bot., Anc. Starch Res., Ann. Bot., Ann. Hum. Genet., Bioinform., Crop Sci., Environ. Microbiol., Eur. J. Hum. Genet., Genome Res., J. Mol. Evol., Palaeoethnobotany: a Handbook of Procedures, PLoS Genet., PLoS ONE, Proc. Natl. Acad. Sci. USA |
| Cluster 14 (66 sources) | Evolution of Behaviour in Humans and Primates | Am. J. Primatol., Anim. Curr. Anthropol., Curr. Biol., Evol. Anthropol. Evol., Int. J. Primatol., J. Theor. Biol., L'Homme, Phil. Trans. Roy. Soc. B., Primates, Proc. R. Soc. b., Trends Cogn. Sci. |
| Cluster 15 (58 sources) | The Archaeology of Africa | Afr. Archaeol. Rev., Afr. Stud., Archaeology of South Africa, Azanea Archaeol. Res., J. Afr. Archaeol. J. World Prehist., Nyame Akuma, S. Air. J. Sci., Sudan and Nubia |
| Cluster 16 (50 sources) | The Archaeology of Australia and New Zealand | Archaeol Oceania, Asian Perspect., Aust. Archaeol., J. Pacif. Hist., J. Polens. Soc., Man and Culture in Oceania, N.Z. J. Archaeol., Oceania, Prehistory of Australia, Rapa Nui J., Rock Art Res., Terra Australis, The Archaeology of Rock Art |
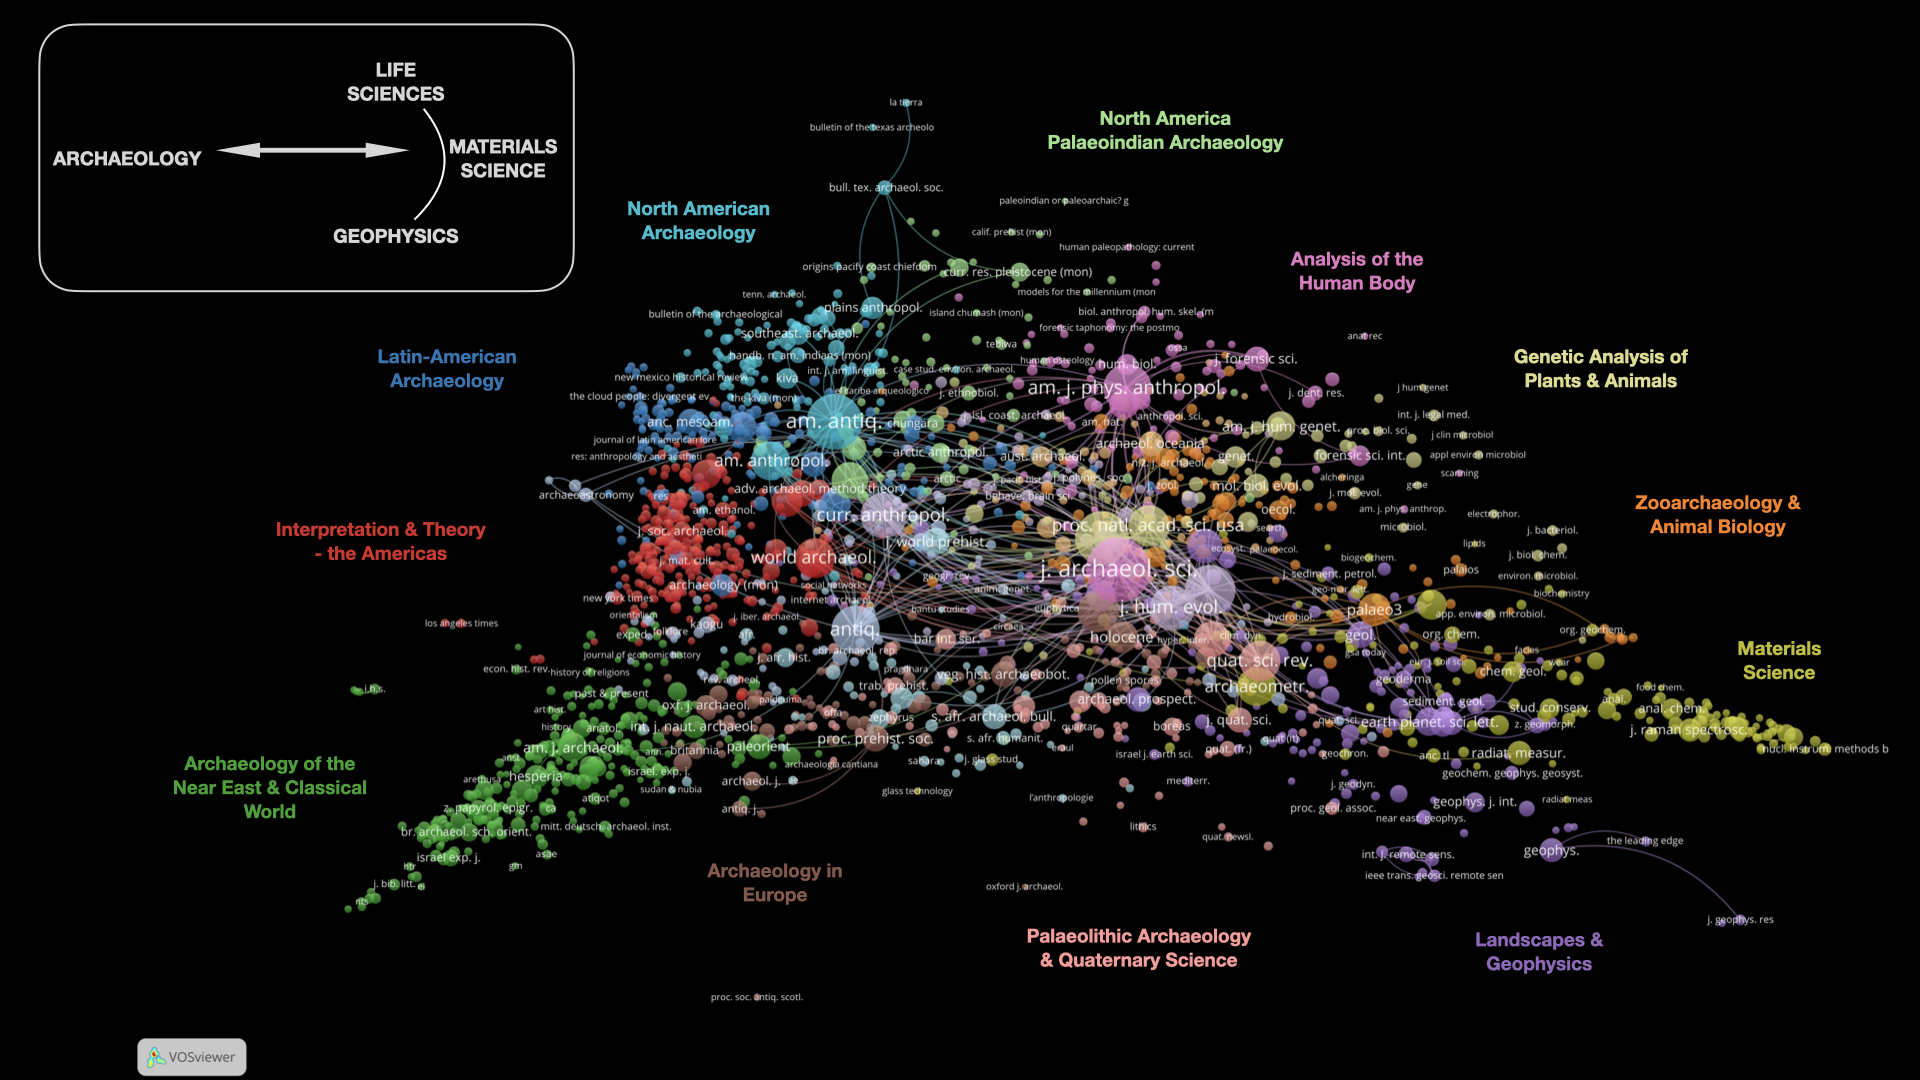
If we compare this to the map for 2004-2013 (Figure 2, Table 3), we see the same basic arrangement of titles and pattern within them, with some minor changes to the composition of clusters including separate clusters for the archaeology of the Americas. While science was identified as a significant side to the nature of the intellectual base for archaeology in 2004-13, the influence of the sciences is still growing, together with the major high-impact science journals. Of the 2000 most highly cited sources in archaeology visible in these co-citation maps, in both cases more than 700 titles (~40%) are science sources that would not be classified as archaeological in nature.
| Node Colour | Cluster Theme | Example Authors within Cluster |
|---|---|---|
| Cluster 1 (234 authors) | The Archaeology of Early Hominins (Europe) | Andrews, P.J., Arsuaga, J.L., Bahain, J.-J., Bermudez de Castro, J., Blasco, R., Boeda, E., Carbonnell, E. Connard, N.J., Dibble, H.L., Falgueres, C., Camble, C.S. Higham, T.F.G., Hublin, J.-J., Kuhn, S.L., Moncel, M.-H., Olle, A., Peresani, M., Pettitt, P.B., Stiner, M.C., Zilhao, J. |
| Cluster 2 (216 authors) | Absolute Dating (esp Carbon dating) & Chronology | Bailey, G.N., Bard, E., Bayliss, A., Beck, J.W., Blackwell, P.G., Bogaard, A., Bronk-Ramsey, C., Buck, C.E., Lambeck, K., Mercuri, A.M., Reimer, P.J., Stuiver, M., van der Plicht, J. |
| Cluster 3 (176 authors) | Social & Symbolic Archaeology (Europe) | Bourdieu, P., Bradley, R.S., Foucault, M., Gosden, C., Hamilakis, Y., Hodder, I., Ingold, T., Kristiansen, K., Latour, B., Lucas, G., Meskell, L., Olsen, B., Renfrew, A.C., Schmidt, P.R., Shanks, M., Smith, A.B., Thomas, J.S., Tilley, C., Trigger, B.G., Whittle, A. |
| Cluster 4 (168 authors) | The Analysis of Human Remains (including stable isotopes & diet) | Ambrose, S.H., Bentley, R.A., Bocherens, H., Buikstra, J.E., Cerling, T.E., denier, M.J., Evans, J., Hedges, R.E.M., Larsen, C.S., Lee-Thorp, J.A., Lewis, M.E., Montgomery, J., Price, T.D., Richards, M.P., Roberts, C.A., Ruff, C.B., Schoeninger, M.J., Schwarcz, H.P. |
| Cluster 5 (161 authors) | Early Hominins in Africa (esp. the evolution of modern humans & modern human behaviour) | Behrensmeyer, A.K., Braun, D.R., Brooks, A.S., Bunn, H.T., Clark, J.D., d'Errico, F., de la Torre, I., Dominguez-Rodriguez, M., Grun, R., Harris, J.W.K., Henshilwood, C.S., Jacobs, Z., Klein, R.G., Lombard, M., Lycett, S.J., Marean, C.W., McPherron, S.J.P., Mitchell, P.J., Parkington, J.E., Potts, R., Stringer, C.B., Vanhaeren, M., Villa, P., Wadley, L. |
| Cluster 6 (157 authors) | Social & Symbolic Archaeology (N. America) | Chase, A.F., Chase, D.Z., Earle, T.K., Feinman, G.M., Hayden, B., Kennett, D.J., Kohler, T.A., Neff, H., Pauktet, T.R., Pearsall, D.M., Piperno, D.R., Schiffer, M.B., Smith, B.D., Smith, M.E. |
| Cluster 7 (143 authors) | DNA & AncientDNA related research | Buckley, M., Collins, M.J., Cooper, A., Dobney, K., Hofreiter, M., Krause, J., Li, H., Mallick, S., Meyer, M.R., Orlando, L., Patterson, N., Reich, D., Richards, M., Rohland, N., Skoglung, P., van Neer, W., Willerslev, E., Zeder, M.A. |
| Cluster 8 (124 authors) | Archaeology & Organic Residues | Colombini, M.P., Craig, O.E., Evershed, R.P., Glascock, M.D., Martinon-Torres, M., Pernicka, E., Pollard, A.M., Rehren, T. |
| Cluster 9 (111 authors) | The Archaeology of China & the Far East | Chen, X., Cheng, H., Fuller, D.Q., Gao, X., Jones, M.K., Li, X., Li. Y., Liu, L., Liu, X., Wang, H., Wang, X., Wang, Y., Zhang, J., Zhang, Y. |
| Cluster 10 (96 authors) | Evolutionary Approaches to Human Behaviour (esp. in the Americas) | Bettinger, R.L., Binford, L.R., Buchanan, B., Collard, M., Eren, M.I., Erlandson, J.M., Grayson, D.K., Jones, G.T., Kelly, R.L., Lyman, R.L., Rick, T.C., Shennan, S.J., Southon, J.R., Waters, M.R. |
| Cluster 11 (94 authors) | The Colonisation of the Americas | Araujo, A., Borrero, L.A., Dillehay, T.D., Guilderson, T.P., Nunez, L., Politis, G.G., Reinhard, K.J. |
| Cluster 12 (85 authors) | Archaeology of the Near East (esp. Israel) | Albert, R.M., Bar-Matthews, M., Bar-Oz, G., Bar-Yosef, O., Barkai, R., Belfer-Cohen, A., Berna, F., Boaretto, E., Finkelstein, I., Goldberg, P., Karkanas, P., Macphail, R.I., Madella, M., Shahack-Gross, R., Weiner, S. |
| Cluster 13 (83 authors) | Archaeology of Australasia & the Pacific | Allen, J., Anderson, A.J., Barker, G., Bellwood, P., Clarkson, C., David, B., Fitzpatrick, S.M., Fullagar, R., Hiscock, P., Holdoway, S.J., Jones, R.E., Kirch, P.V., O'Connor, S., Smith, M., Spriggs, M., Torrence, R. |
| Cluster 14 (54 authors) | Archaeology of the Near East | Bevan, A., Conolly, J., Doneus, M., Lasaponara, R., Masini, N., Remondino, F., Saris, A., Verhoeven, G., Wilkinson, T.J. |
| Cluster 15 (49 authors) | Archaeology of Arabia | Boivin, N.L., Butzer, K.W., Cremaschi, M., Di Lernia, S., Groucutt, H.S., Martin, L.B., Petraglia, M.D., Shipton, C. |
| Cluster 16 (49 authors) | Luminescence Dating | Aitken, MJ., Duller, G.A.T., Galbraith, R.F., Levy, T.E., Mercier, N., Murray, A.S., Roberts, R.G., Wintle, A.G. |
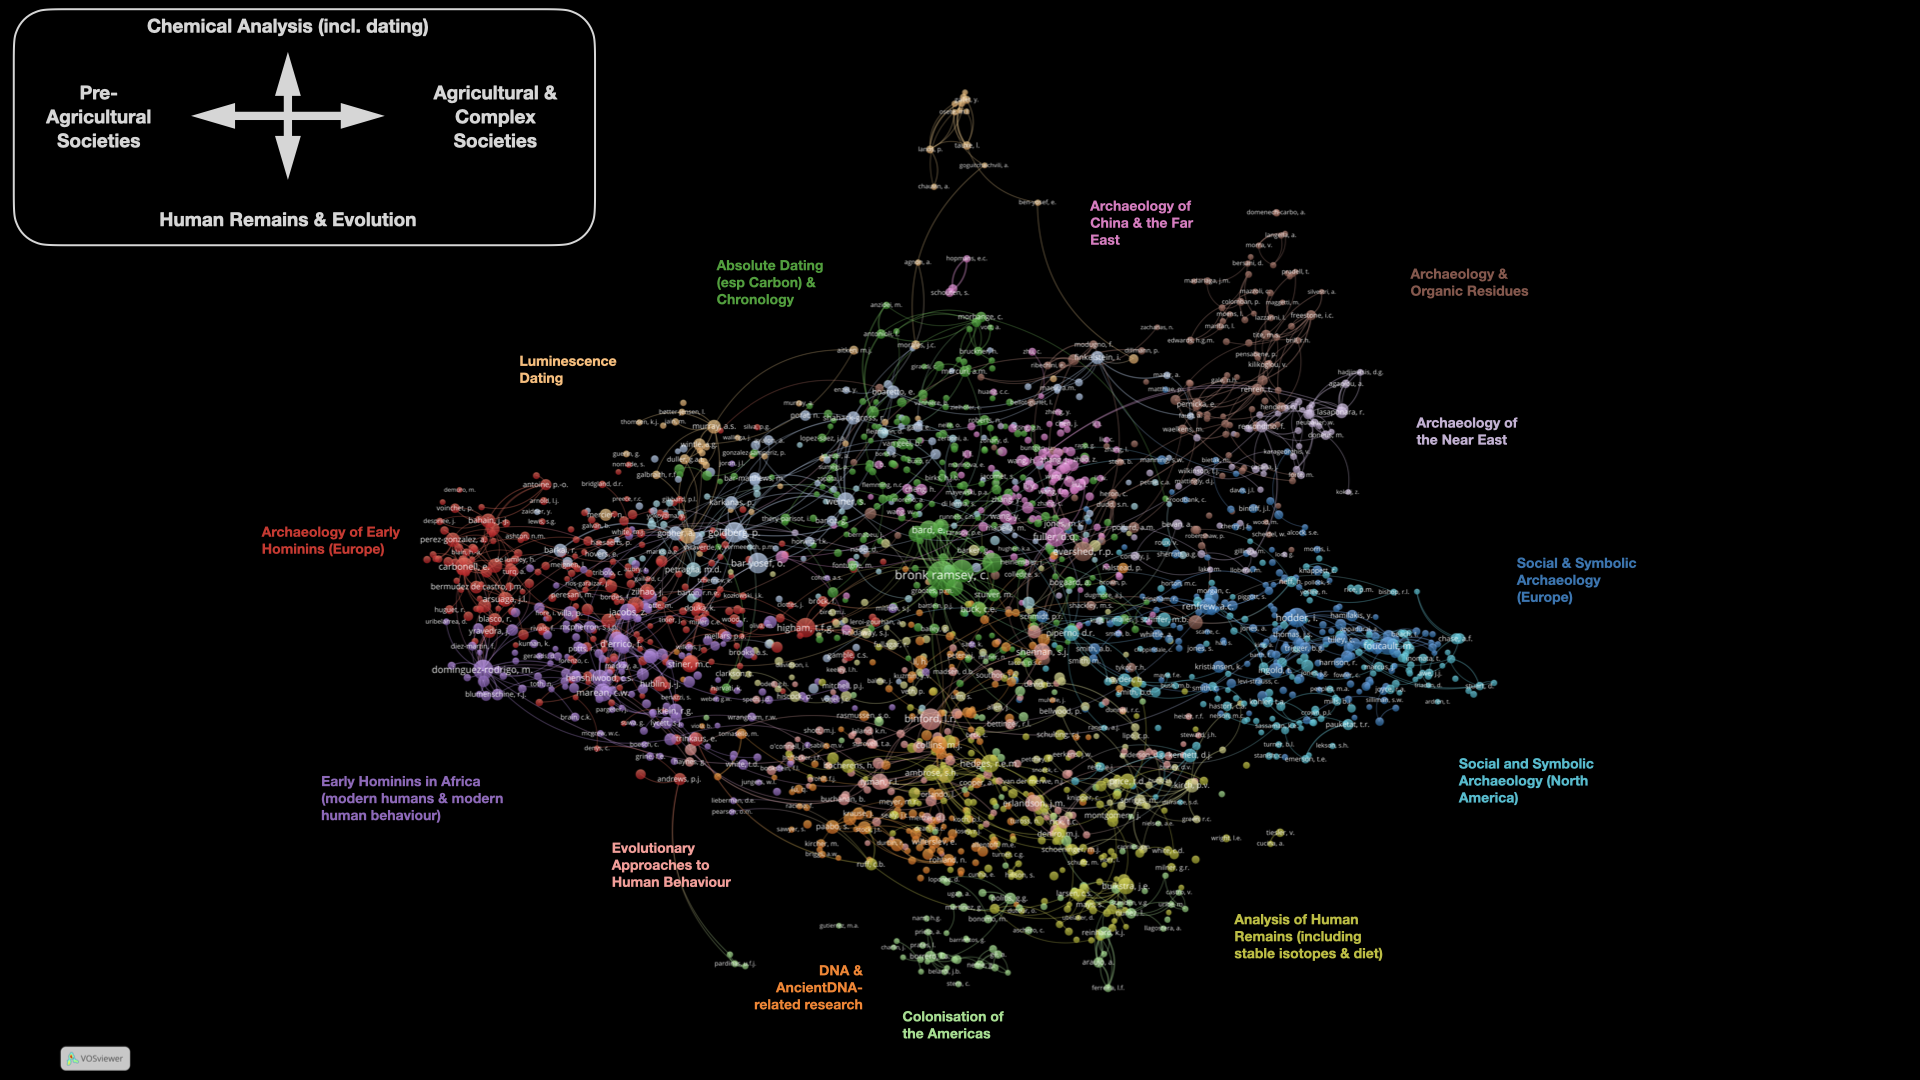
The map of co-cited authors presents the 2000 most referenced authors out of nearly 1 million cited. Authors have been grouped into 19 clusters using a minimum cluster size of 30 authors along with the 800 strongest links between them visible, using a clustering resolution of 2.00 and a threshold for inclusion set at 150 citations (Figure 3, Table 4). The most cited authors are researchers whose work relates to aspects of science in archaeology including absolute dating (Bronk-Ramsey, Reimer, Higham, Bard and Blackwell), the analysis of sediments and minerals (Goldberg, Weiner), the microscopic analysis of bones (Dominguez-Rodrigo), residue analysis (Evershed), stable isotopes (Hedges, M.P. Richards), proteins (Collins) and plant remains (Fuller). There are several frequently cited authors present whose work is not focused on archaeological material, but anthropology (Foucault, Ingold, Bourdieu and Latour). At a broad scale this map recognises a clear difference between researchers based on their temporal interests, and on whether their research focuses on the animate or the inanimate. To the far left we can see two major clusters of researchers looking at the record of the earliest hominins and pre-agricultural societies, with a distinction made between those working in Africa and those working elsewhere. To the right we can see researchers who consider settled societies and issues of the nature of social complexity, with a distinction drawn between scholars examining the Americas and others. We can also see distinct small clusters related to aspects of scientific research (luminescence dating, organic residues, DNA and ancientDNA, and human remains) and three clusters that possess a clear regional or time focus (China and the Far East, the Near East, and the colonisation of the Americas). The intellectual base of archaeology rests on the research of a number of authors who stopped publishing research some time before the period under analysis (Binford, Childe, J.D. Clark, Foucault). Remarkably, Binford remains the third most cited author after Bronk-Ramsey and Reimer. His location in the centre of the map reflects the number of citations received, since the mapping process of VOSviewer usually places the largest nodes in the centre. Relative to other prominent authors, this central placing also clearly captures the citation of Binford's work across a wide range of archaeological research including by scholars examining the archaeology of early hominins, by those exploring an evolutionary approach to human behaviour and finally by those examining the social and symbolic side of archaeology. Hodder and Dominguez-Rodrigo, however, are cited almost as often as Binford but are placed on opposite sides, reflecting their considerably more circumscribed citation catchments.
| Node Colour | Cluster Theme | Example Authors within Cluster |
|---|---|---|
| Cluster 1 (263 authors) | The Archaeology of Early Hominins | Behrensmeyer, A.K., Carbonnell, E. Clark, J.D., Conard, N.J., d'Errico, F., Dominguez-Rodrigo, M., Gamble, C.S., Dibble, H.L., Goren-Inbar, N., Grun, R., Harris, J.W.K., Kuhn, S.L., McBrearty, S., Marean, C.W., Mellars, P.A., Moncel, M.-H., Pettitt, P.B., Stiner, M.C., Stringer, C.B., Trinkaus, E., Valladas, H., Villa, P., White, T.D. |
| Cluster 2 (214 authors) | Absolute Dating & Establishing Chronologies | Baillie, M.G.L., Bard, E., Bayliss, A., Beck, J.W., Blackwell, P.G., Bronk-Ramsey, C., Higham, T.F.G., Lambeck, K., Murray, A.S., Reimer, P.J., Stuiver, M., Wintle, A.G. |
| Cluster 3 (179 authors) | Development of Human Societies in North & Central America | Ashmore, W., Blanton, R.E., Brenner, M., Brumfiel, E.M., Clark, J.E., Dillehay, T.D., Earle, T.K., Feinman, G.M., Flannery, K.V., Glascock, M.D., Hasdtorf, C.A., Joyce, R.A., Marcus, J., Neff, H., Pearsall, D.M., Rice, P.M., Smith, M.E., Willey, G.R. |
| Cluster 4 (168 authors) | Social & Symbolic Archaeology in Settled Societies (esp. in Europe) | Bourdieu, P., Bradley, R.S., Childe, V.G., Clarke, D.L., Dietler, M., Foucault, M., Gosden, C., Kall, M., Hodder, I., Ingold, T., Johnson, M.H., Jones, S., Latour, B., Meskell, L., Miller, D., Renfrew, A.C., Shanks, M., Thomas, J.S., Tilley, C., Trigger, B.G., Wylie, A. |
| Cluster 5 (118 authors) | Evolutionary Approaches to Human Behaviour (esp. in N. America) | Arnold, J.E., Bettinger, R.L., Binford, L.R., Boyd, R., Erlandson, J., Frison, G.C., Grayson, D.K., Hawkes, K., Hayden, B., Kelly, R.L., Lyman, R.L., O'Brien, M.J., O'Connell, J.F., Richerson, P.J., Shennan, S.J., Winterhalder, B. |
| Cluster 6 (115 authors) | The Origins of Domesticates & Agriculture | Bar-Yosef, O., Belfer-Cphen, A., Fuller, D.Q., Goldberg, P., Gopher, A., Guillaine, J., Jacomet, S., Jones, M.K., Macphail, R.I., Payne, S., Potts, D.T., Rowley-Conwy, P., Sherratt, A.G., Zeder, M.A., Zohary, D. |
| Cluster 7 (115 authors) | DNA analysis & the Origins of Modern Humans | Bandelt, H.-J., Bradley, D.G., Cavalli-Sforza, L.L., Cooper, A., Diamond, J., Foley, R.A., Forster, P., Horfeiter, M., Kivisild, T., Krause, J.,Lahr, M.M., Macauley, V., Paabo, S., Richards, M., Stoneking, M., Torroni, A., Willerslev, E. |
| Cluster 8 (112 authors) | Archaeology in the Central & Eastern Mediterranean (inc. the Classical World) | Alcock, S.E., Barker, G., Bintliff, J.L., Boardman, J., Boaretto, E., Brown, P., Cherry, J.F., Cunliffe, B., Davies, W., Davis, J.L., Finkelstein, I., Halstead, P., Knapp, AB., Levy, T.E., Manning, S.W., Mazer, M., Morris, I., Osbourne, R., Runnels, C.N. |
| Cluster 9 (104 authors) | Archaeology of Australasia & the Pacific | Allen, J., Anderson, A.J., Bellwood, P., David, B., Field, J., Fullagar, R., Hiscock, P., Jones, R.E., Kirch, P.V., O'Connor, S., Roberts, R.G., Spriggs, M., Steadman, D.W., Torence, R. |
| Cluster 10 (97 authors) | The Analysis of Human Remains | Armelagos, G.J., Brothwell, D.R., Buikstra, J.E.,Hillson, S., Larsen, C.S., Lovejoy, C.O., Mays, S., Molleson, T.I., Roberts, C.A., Rose, J.C., Ruff, C.B., Ubelaker, D.H., Walker, P.L. |
| Cluster 11 (90 authors) | Archaeology and Organic Residues & Ceramics | Clark, R.J.H., Dudd, S.N., Edwards, H.G.M., Evershed, R.P., Freestone, I.C., Henderson, J., Heron, C., Pernicka, E., Pollard, A.M., Shackley, M., Tite, M.S., Waelkens, M., White, R. |
| Cluster 12 (78 authors) | Archaeology in Africa (not early hominins) | Brooks, A.B., Butzer, K.W., Cruz-Uribe, K., Deacon, H.J., Gifford-Gonzalez, D., Henshilwood, C.S., Huffman, T.N., Jacobs, Z., Klein, R.G., Lombard, M., McIntosk, S.K., Mitchell, P.J., Parkington, J.E., Smith, A.B., Vogel, J.C., Wadley, L., Wendorf, F. |
| Cluster 13 (76 authors) | Analysis of Human Diet (esp. stable isotope analysis) | Ambrose, S.H., Bentley, R.A., Bocherens, H., Collins, M.J., Craig, O.E., Deniro, M.J., Hedges, R.E.M., Lee-Thorp, J.A., Price, T.D., Richards, M.P., Schoeninger, M.J., Schwarcz, H.P., Sealy, J.C., van der Merwe, N.J. |
| Cluster 14 (74 authors) | Archaeology of China and the Far East | Brantingham, P.J., Chen, X., Cheng, H., Derevianko, A.P., Gaffney, V., Higham, C., Goodman, D., Kuzmin, Y.V., Liu, L., Sarris, A., Wang, Y. |
| Cluster 15 (71 authors) | The Development of Complex Societies in North America | Anderson, D.G., Brown, J.A., Chapman, J., Dunnell, R.C., Griffin, J.B., Milner, G.R., Pauketat, T.R., Peebles, C.S., Reitz, E.J., Sassaman, K.E., Smith, B.D., Thomas, D.H., Wing, E.S. |
| Cluster 16 (68 authors) | Prehistoric Archaeology in North America | Anyon, R., Cordell, L.S., Hegmon, M., Kintigh, K.W., Kohler, T.A., Longacre, W.A., Martin, P.S., Mills, B.J., Redman, C.J., Schiffer, M.B., Shepard, A.O. |
If we compare this map (Figure 3) to that for 2004-2013 (Figure 4, Table 5) we see clear similarities both in terms of the authors included, their place in the map, as well as the nature and shape of the clusters of researchers. There is a similar high-level structure in terms of timespan from research on earliest humans on the left to research examining later more complex societies on the right, and from chemical analysis of inanimate materials at the top to the analysis of animate evidence (bones, plant remains and DNA at the bottom). The increase in the number of documents published in archaeology and the number of references made has led to an increase in the citation threshold for inclusion in the map of cited authors. In 2004-2013 160 citations were needed for inclusion in the map; for 2014-2021, more than 300 citations are needed. Likewise, the highest number of citations received by any author has more than doubled from nearly 3000 to more than 7500.

| Cluster Colour | Cluster Theme: The Language of... | Examples of Terms Within Cluster | ||||||||||||
|---|---|---|---|---|---|---|---|---|---|---|---|---|---|---|
| Cluster 1 (299 terms) | Interpretation & Theory | actor, agency, artist, capitalism, colonialism, concept, cultural history, dialogue, ethnicity, gender, hierarchy, ideology, materiality, narrative, nationalism, ontology, polity, power, prestige, science, social identity, social process, subjectivity, temporality, theory | ||||||||||||
| Cluster 2 (200 terms) | The Classical & Historical Worlds | acropolis, ancient world, architecture, basilica, Byzantine, cathedral, christianity, classical antiquity, construction phase, crypt, empire, epigraphy, Etruscan, forum, fresco, goddess, iconography, manuscript, monumentality, pilgrimage, public space, road, Roman Empire, textual source, urban space | ||||||||||||
| Cluster 3 (186 terms) | Physical Landscapes, the Environment & Climate Change | altitude, anthracology, arid environment, basin, biodiversity, climate change, deforestation, dendrochronology, erosion, firewood, forest, geoarchaeology, historical ecology, holocene, human impact, irrigation, landscape change, palaeoenvironmemt, sea level, sedimentation, terrace, vegetation change | ||||||||||||
| Cluster 4 (178 terms) | Scientific Analysis of Artefacts & their Manufacture | alloy, analytical study, bronze, calcite, chemical analysis, clay, cluster analysis, corrosion, craftsman, X-ray fluorescence, elemental analysis, firing temperature, geochemistry, glass, ice mass spectrometry, laboratory, microscopy, non-destructive technique, petrography, pottery, provenance, recycling, slag, workshop | ||||||||||||
| Cluster 5 (154 terms) | Professional Practice & Heritage Management | architectural heritage, audience, authenticity, citizen, cultural resource, developer, digital archaeology, expertise, field research, funding, government, guidance, heritage, infrastructure, legislation, museum, professional, public engagement, regulation, sustainability, tourism, world heritage | ||||||||||||
| Cluster 6 (148 terms) | Survey, Mapping & Forms of Visualisation (esp. digital) | 3D model, aerial photography, augmented reality, camera, cartography, digital elevation model, drawing, geographic information system, global positioning system, lidar, machine learning, photogrammetry, remote sensing, satellite imagery, unmanned aerial vehicle, virtual reality, wreck | ||||||||||||
| Cluster 7 (133 terms) | Human evolution (species, cognition & technology) | Acheulean, assemblage, biface, blank, bone tool, butchery, chaine operatoire, debitage, flake, formation process, functional analysis, geological context, Levallois, lithic artefact, lithic technology, Oldowan, palaeolithic, prey, sequence, site formation process, taphonomy, use wear | ||||||||||||
| Cluster 8 (125 terms) | Domestication & Food Production of Plants and Animals | agriculture, animal, anthropology, archaeobotany, cattle, crop, cultivation, domestication, economic system, farming, food production, harvest, hunter-gatherer, intensification, neolithic, phytolith, plant use, starch, subsistence, wild animal, wild plant | ||||||||||||
| Cluster 9 (111 terms) | The Development of Social Complexity (esp. in Prehistory) | 1st millenium bc, archaeological culture, arrowhead, bead, burial, cemetery, cremation, cultural contact, elite, figurine, grave, hill fort, hoard, kurgan, mirror, ornament, rank, ritual, Scythian, social complexity, social inequality, sword, symbolism, warrior, weapon | ||||||||||||
| Cluster 10 (103 terms) | Human Remains, Forensics & Human Health | adult, anatomy, ancient Egypt, bioarchaeology, body size, computed tomography, cranium, diagnosis, exhumation, forensic, fracture, geometric morphometric, health, infancy, inhumation, injury, juvenile, mass grave, mummy, palaeopathology, sexual dimorphism, tuberculosis, vertebra, victim | ||||||||||||
| Cluster 11 (76 terms) | Genetics & Ancient Populations |
admixture, affinity, ancient DNA, colonisation, demography, dispersal, dog, ethnic group, evolutionary history, gene flow, haplotype, kinship, lineage, mitochondrial DNA, phylogenetic analysis, population density, population structure, sequencing, species
| Cluster 12
(65 terms) |
Organic Materials and Residue Analysis |
acid, biomarker, burial environment, cellulose, decay, decomposition, dye, fibre, fungi, lipid, leather, mass spectrometry, organic residue, oxidation, pottery vessel, protocol, substance, textile, wood | Cluster 13
(62 terms) |
Dietary Analysis using Stable Isotopes |
13c value, 15n value, baseline, C4 plant, collagen, diagenesis, diet, ecology, enamel, imigrant, isotope, life history, marine resource, protein, ratio, seasonality, signature, stable isotope analysis, tooth enamel, variation | Cluster 14
(51 terms) |
Geophysical Survey |
anomaly, calculation, cavity, cross section, ditch, electrical resistance tomography, geophysics, ground penetrating radar, imaging, inversion, magnetometry, parameter, prospection, subsurface, susceptibility, verification | Cluster 15
(31 terms) |
Absolute (Scientific) Dating |
14c date, absolute chronology, accelerator mass spectrometry, age range, bayesian analysis, calibration, cultural layer, luminescence dating, radiocarbon dating, stratigraphy, timing | |
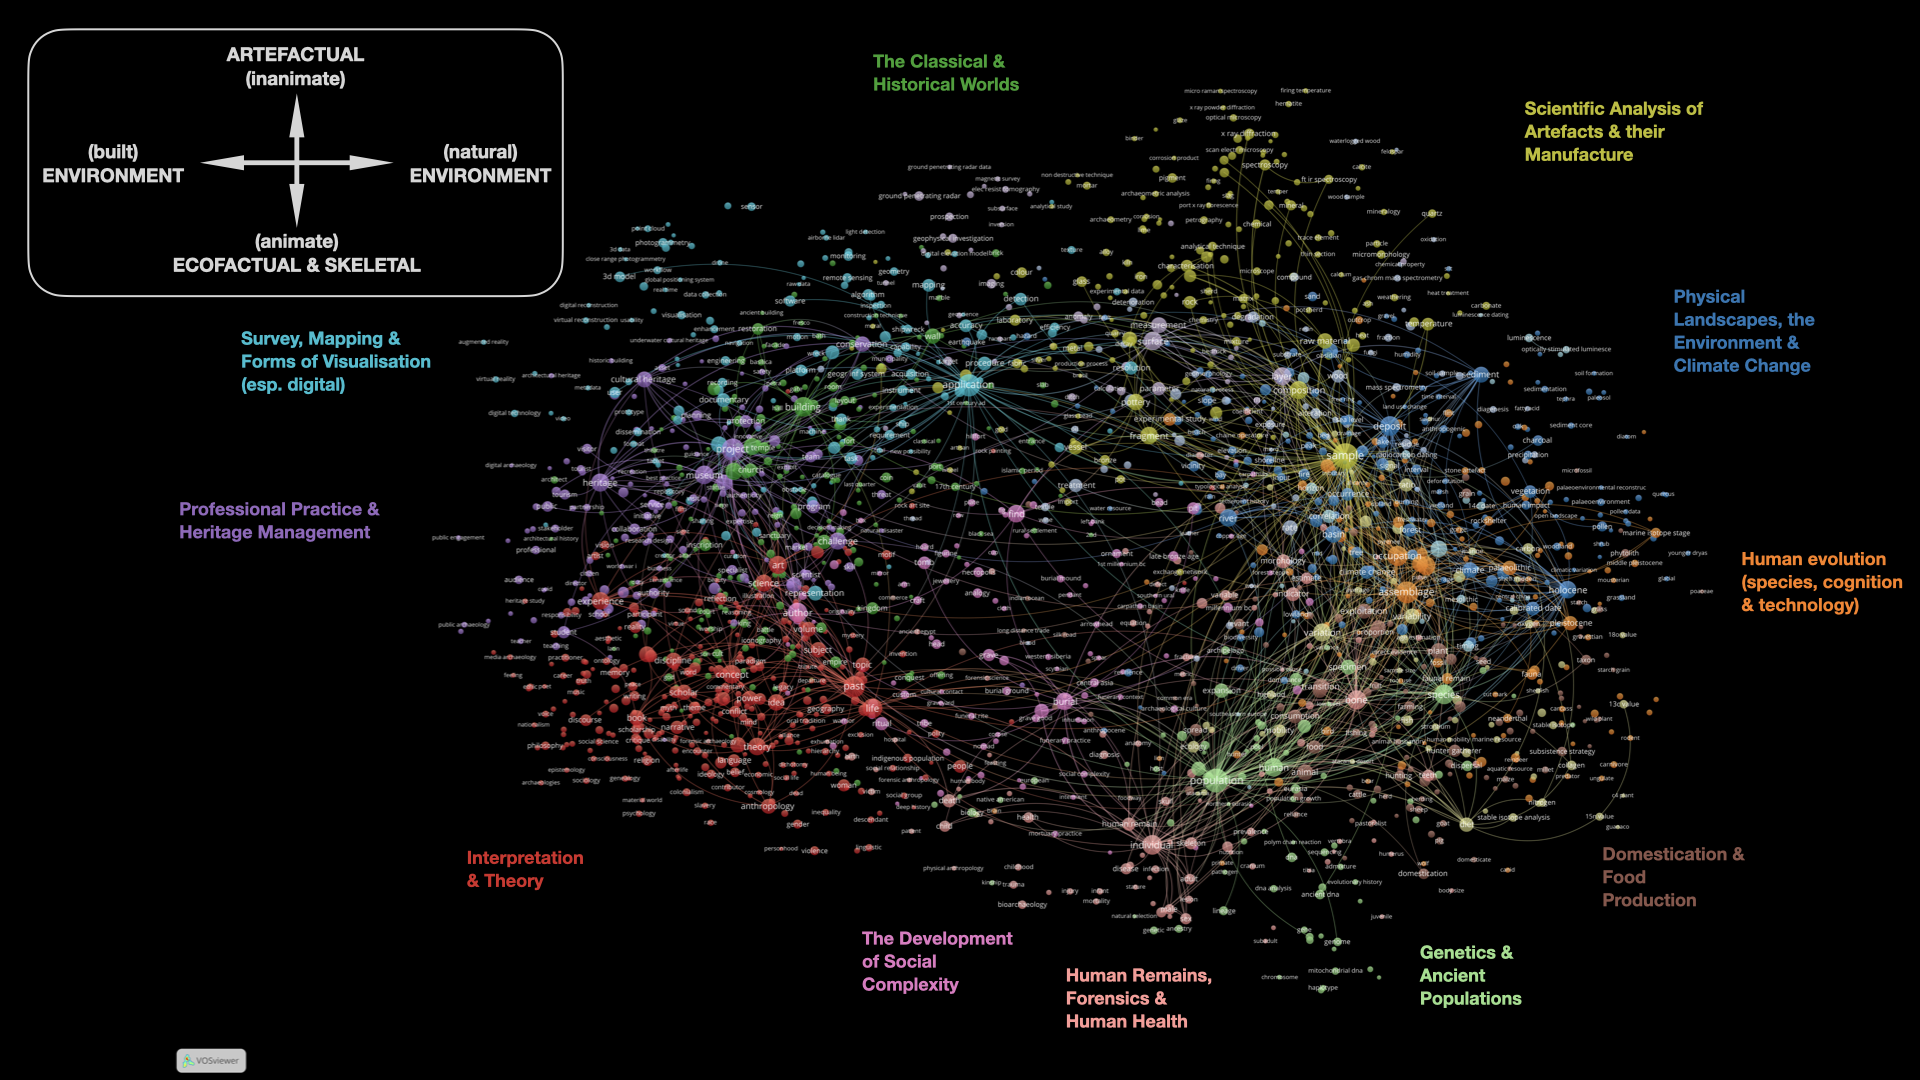
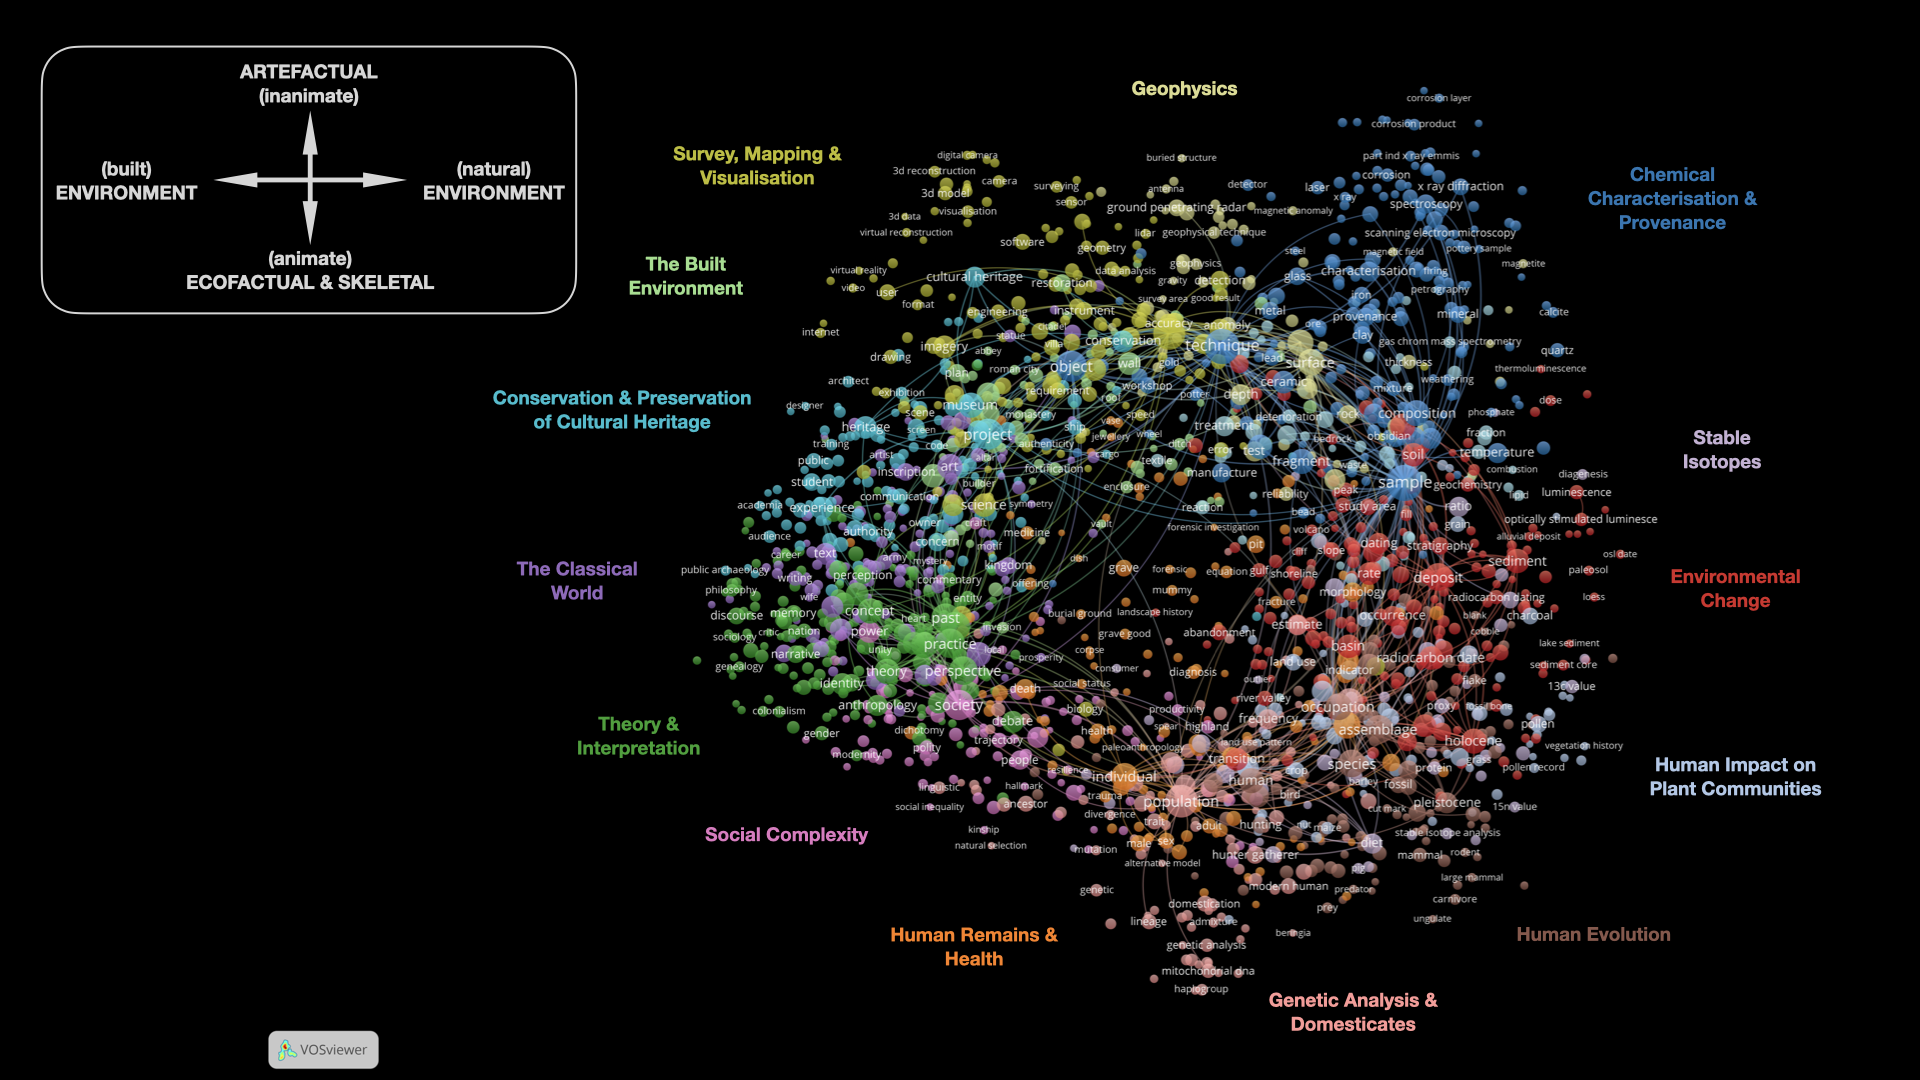
The co-occurrence map of NLP-extracted terms from titles and abstracts contains more than 1900 terms grouped into 15 clusters, using a clustering resolution of 1.5 and a minimum cluster size of 30 terms (Figure 5, Table 6). The terms are arranged in a clear ring shape with terms related to archaeological interpretation and theory as the largest cluster situated on the lower left-hand side next to terms related to professional practice in archaeology and heritage management. If the term 'archaeology' is included it would be the largest node and located in cluster 1. Terms associated with survey, mapping and digital visualisation are also on this left-hand side, intermingled with terms related to the archaeology of the classical and historical worlds. On the right-hand side we can see clusters of terms related to the physical environment and climate intermingled with the conceptual language of the archaeology of early hominins. There is a clear cluster of terms related to the scientific analysis of archaeological artefacts. In the lower part of the map, we can see terms associated with the analysis of human remains and human health and the origins of domestication and food production, with a cluster related to genetics and ancient populations in between. Smaller clusters of terms related to absolute dating, the isotopic analysis of diet, the analysis of organic residues and geophysics are recognised but less visible. The low-density spread of terms in the centre of the map includes terms related to the study of social complexity and especially the analysis of finds from cemeteries. This map presents a very clear image of the extraordinary breadth of conceptual language that encompasses archaeological research today, as well as highlighting some of the clear distinctions that exist between the natural and built environments, the animate and the inanimate.
| Cluster Colour | Cluster Theme: The Language of... | Examples of Terms Within Cluster |
|---|---|---|
| Cluster 1 (196 terms) | Environmental Change (incl. dating & climate change) | basin, climate, dating, climate change, correlation, deposit, holocene, layer, occurrence, radiocarbon date, rate, sediment, soil, transition |
| Cluster 2 (194 terms) | Theory & Interpretation | agency, argument, anthropology, biography, concept, debate, discipline, historian, idea, life, materiality, material culture, meaning, narrative, notion, past, perspective, practice, story, theory, warfare, world |
| Cluster 3 (190 terms) | Chemical Characterisation & Provenancing of Artifacts | ceramic, characterisation, clay, composition, concentration, determination, fragment, glass, manufacture, metal, object, pigment, pottery, provenance, sample, spectroscopy, technique, X-ray diffraction |
| Cluster 4 (159 terms) | Survey, Mapping & Visualisation of artefacts & Space | accuracy, acquisition, application, detection, documentary, geographic information system, imagery, map, photogrammetry, photograph, procedure, remote sensing, representation, resolution, satellite imagery, science, solution, topic |
| Cluster 5 (147 terms) | The Classical World (incl. Textual Sources) | art, book, Christianity, empire, Hellenistic, iconography, inscription, language, religion, ritual, sanctuary, scholar, shrine, symbolism, text, tradition, translation, wall painting |
| Cluster 6 (132 terms) | Conservation & Preservation of Cultural Heritage | conservation, cultural heritage, experience, government, heritage, infrastructure, intervention, law, museum, planning, policy, project, sustainability, tourism, training, university |
| Cluster 7 (130 terms) | Human Remains & Health in Past Societies | adult, death, disease, fracture, grave, health, individual, morphology, necropolis, pathology, proportion, sex, skeleton, specimen, teeth, violence |
| Cluster 8 (129 terms) | The Evolution and Life of Early Hominins | adaptation, assemblage, fauna, habitat, hominin, human, hunting, lithic artifact, marine isotope stage, Neanderthal, occupation, palaeolithic, pleistocene, site formation process, species |
| Cluster 9 (111 terms) | Understanding Social Complexity (esp. North America) | craft, cultural change, competition, elite, emergence, frontier, hierarchy, household, intensification, Mesoamerica, people, polity, power, social organisation, society, sphere |
| Cluster 10 (105 terms) | Genetic Analysis and Archaeology (esp. the evolution of domesticates) | ancestry, ancient DNA, DNA, dispersal, domestication, estimate, expansion, frequency, genetic analysis, haplogroup, lineage, mitochondrial DNA, population, population growth, sequence, spread, timing |
| Cluster 11 (87 terms) | The Built Environment | architecture, acropolis, building material, castle, church, enclosure, fort, harbour, layout, monument, palace, plan, restoration, roman villa, ruin, tower, urban area |
| Cluster 12 (83 terms) | Agriculture & Human Impact on Plant Communities | agriculture, charcoal, crop, cultivation, farming, forest, grain, human impact, indicator, neolithic, phytolith, pollen analysis, seed, vegetation, woodland |
| Cluster 13 (71 terms) | Geophysics | anomaly, depth, geophysical investigation, ground penetrating radar, imaging, magnetic survey, measurement, parameter, prospection, reliability, surface, target, tomography, validation |
| Cluster 14 (58 terms) | Stable Isotope Analysis | carbon, collagen, consumption, diet, ecology, fish, food, isotopic data, marine, nitrogen, oxygen, ratio, shell, signature, stable isotope analysis, subsistence |
| Cluster 15 (52 terms) | Residue Analysis | acid, alteration, biomarker, contamination, degradation, deterioration, extraction, experimental study, fraction, lipid, mass spectrometry, organic material, residue, substance |
The map for 2004-2013, includes more than 1800 terms, also grouped into 15 clusters using a clustering resolution of 1.5 and a minimum cluster size of 30 terms (Figure 6, Table 7). The essential structure and shape of this map is the same as that discussed previously, though with some slight differences. On the right-hand side, the largest cluster of terms relates to the language of environmental change closely associated with the language of the impact of humans on plant communities. The language of stable isotopes is clearly visible and located close to the chemical analysis of artefacts. At the top there are four related clusters covering the languages of geophysics, survey, mapping and visualisation, preservation and cultural heritage and the built environment. The language of theory and interpretation, the classical world and social complexity are located close together to the left-hand side. Archaeology, if included, would be placed in the cluster of terms related to interpretation and theory. The centre of the ring contains more terms across a range of clusters. While the essential pattern remains the same between early and later periods, we can see some subtle developments through time. Research in the classical and historical worlds now embraces survey, geophysics and digital visualisation (digital photography, 3-D modelling and unmanned aerial survey work) in 2014 to 2021, where text was a central concern in 2004 to 2013. Genetic analysis is present across both periods but has changed from a focus on the biological changes that characterise domestication to understanding human populations, perhaps reflecting the significant change in the availability of ancientDNA data for multiple human individuals and the use of these data to address long-standing research questions about the movement of human populations (Kristiansen 2014).
| Cluster Colour | Cluster Theme: The Language of... | Examples of Terms Within Cluster |
|---|---|---|
| Cluster 1 (279 terms) | Interpretation and Theory | aesthetics, African diaspora, agent-based model, anthropology, antiquarianism, bio-politics, capitalism, cinema, cognitive archaeology, colonialism, communities of practice, discourse, emotion, epistemology, folklore, gender, historiography, inequality, materiality, models, orientalist, place-making, power, practice, social identity, theory, writing |
| Cluster 2 (196 terms) | The Classical and Historical Worlds | amphora, antiquity, basilica, battlefield, castle, coins, craft specialisation, economy, ethnology, forensic archaeology, funerary archaeology, Hellenistic, house, iconography, Islamic, Limes, mass graves, numismatics, paintings, rampart, romanisation, sanctuary, temple, topography, warfare |
| Cluster 3 (164 terms) | Survey, Mapping and Forms of Visualisation (esp. digital) | 3D documentation, 3D model, 3D printing, aerial photogrammetry, aerial survey, augmented reality, big data, citizen science, data analysis, deep learning, digital archaeology, drone, geographic information system, global positioning system, lidar, machine learning, metadata, neural networks, open access, open data, quantitative analysis, reverse engineering, survey, unmanned aerial vehicle |
| Cluster 4 (161 terms) | Human Evolution (species, cognition and technology) | Acheulean, anatomically modern humans, biface, cave art, chaine operatoire, cognitive evolution, cultural transmission, experimental archaeology, faunal analysis, geometric morphometric, Levallois, lithic analysis, microwear, Neanderthal, pleistocene, refitting, residues, skill, technology, zooarchaeology |
| Cluster 5 (160 terms) | Scientific Analysis of Artefacts (esp. with reference to technology, craft and provenance) | ageing, archaeometry, bioapatite, bone diagenesis, characterisation, chemical analysis, conservation, craft, elemental analysis, FTIR spectroscopy, heat treatment, ICP-MS, microscopy, multivariate analysis, petrography, provenance, trace elements, X-ray fluorescence |
| Cluster 6 (139 terms) | Human Remains Analysis, life histories and health in the past | age, amino acids, anatomy, archaeoparisitology, bioarchaeology, carbon and nitrogen isotopes, contamination, demography, dental caries, forensic anthropology, geometric morphometrics, human remains, infection, laser ablation, morphometry, osteoarchaeology, palaeodemography, sex determination, trauma, weaning |
| Cluster 7 (127 terms) | Human Impact and Environmental Change | African humid period, anthropocene, buried soils, climate change, deforestation, environment, extinction, fluvial terraces, geochemistry, Holocene, human impact, land cover, microfossils, megafauna, optical dating, palaeoclimate, paleosol, Quaternary, tephrochronology, wood charcoal |
| Cluster 8 (119 terms) | Domestication and Food Production of Plants and Animals | animals, archaeobotany, biogeography, crops, cultivation, early agriculture, ethnobotany, food production, horticulture, human-environment interaction, intensification, irrigation, landscape change, mobility, niche construction theory, pastoralism, phytoliths, sedentism, urbanisation |
| Cluster 9 (104 terms) | European Prehistory and Population Dispersals | animal husbandry, archaeological culture, bell beaker, burial mound, cemetery, craniology, diffusion, elite, funerary practices, grave goods, Herodotus, image analysis, kurgan, megaliths, nomadism, petrology, settlement pattern, typology, weapons |
| Cluster 10 (104 terms) | Seafaring, Shipwrecks and Coastal Activity | antiquities, bathymetry, coastal archaeology, continental shelf, earthquakes, geoarchaeology, harbour, inventory, Mediterranean, museology, navigation, recovery, sea level change, shipwreck, tectonics, underwater robotics, wetlands |
| Cluster 11 (75 terms) | Metallurgy and mining | African archaeology, ancient Egypt, copper age, exchange networks, hill fort, iron smelting, lead, metallurgy, mining, pb isotopes, pottery technology, rituals, sample, settlement history, tin, urbanization |
| Cluster 12 (69 terms) | Genetics and ancient populations | adaptation, admixture, ancient DNA, archaeogenomics, bayesian, biodiversity, cattle, demographic history, dispersal, domestication, epidemiology, gene flow, hybridization, livestock, mitochondrial DNA, native American, phylogeetics, selection, tuberculosis, y-chromosome |
| Cluster 13 (66 terms) | Geophysics of archaeological landscapes in the Near East, south Asia and the Arctic | 3D-imaging, archaeogeophysics, biological anthropology, burial mounds, civilisation, cluster analysis, electrical resistivity tomography, geomagnetic survey, ground penetrating radar, historical maps, inversion, magnetic radiometry, prospection, satellite imagery, space syntax |
| Cluster 14 (66 terms) | Development of social complexity in prehistoric societies (esp. N. America) | ancestral pueblo, bog bodies, Cahokia, cartography, complexity, distribution, earthworks, feasting, fragmentation, geographic information system, hill forts, Mississippian, monumentality, network analysis, scale, settlement patterns, social complexity, trade routes, viewshed analysis, visibility |
| Cluster 15 (49 terms) | Cultural heritage and tourism | archaeological practice, cannibalism, community participation, cultural heritage management, cultural landscape, digital technology, ethnogenesis, geopark, heritage management, nationalism, preventive archaeology, sustainable development, training, world heritage site |
| Cluster 16 (48 terms) | Absolute dating | absolute chronology, acoustics, archaeomagnetism, bayesian analysis, dating, environmental magnetism, music archaeology, optically stimulated luminescence, paleomagnetism, radiocarbon dating, thermoluminescence |
| Cluster 17 (42 terms) | Mummification (esp. S. America) | animism, archaeological textiles, archaeothanatology, bioturbation, formation processes, hearth, lithic taphonomy, microstratigraphy, mummification, object biography, shamanism, style |
| Cluster 18 (32 terms) | Satellite imagery and remote sensing to understand environmental change | activity, aerial archaeology, change detection, crop marks, digital elevation model, earth observation, floodplain, geoglyphs, hydrology, ndvi (Normalised Difference Vegetation Index), remote sensing, satellite remote sensing, soil erosion, synthetic aperture radar |
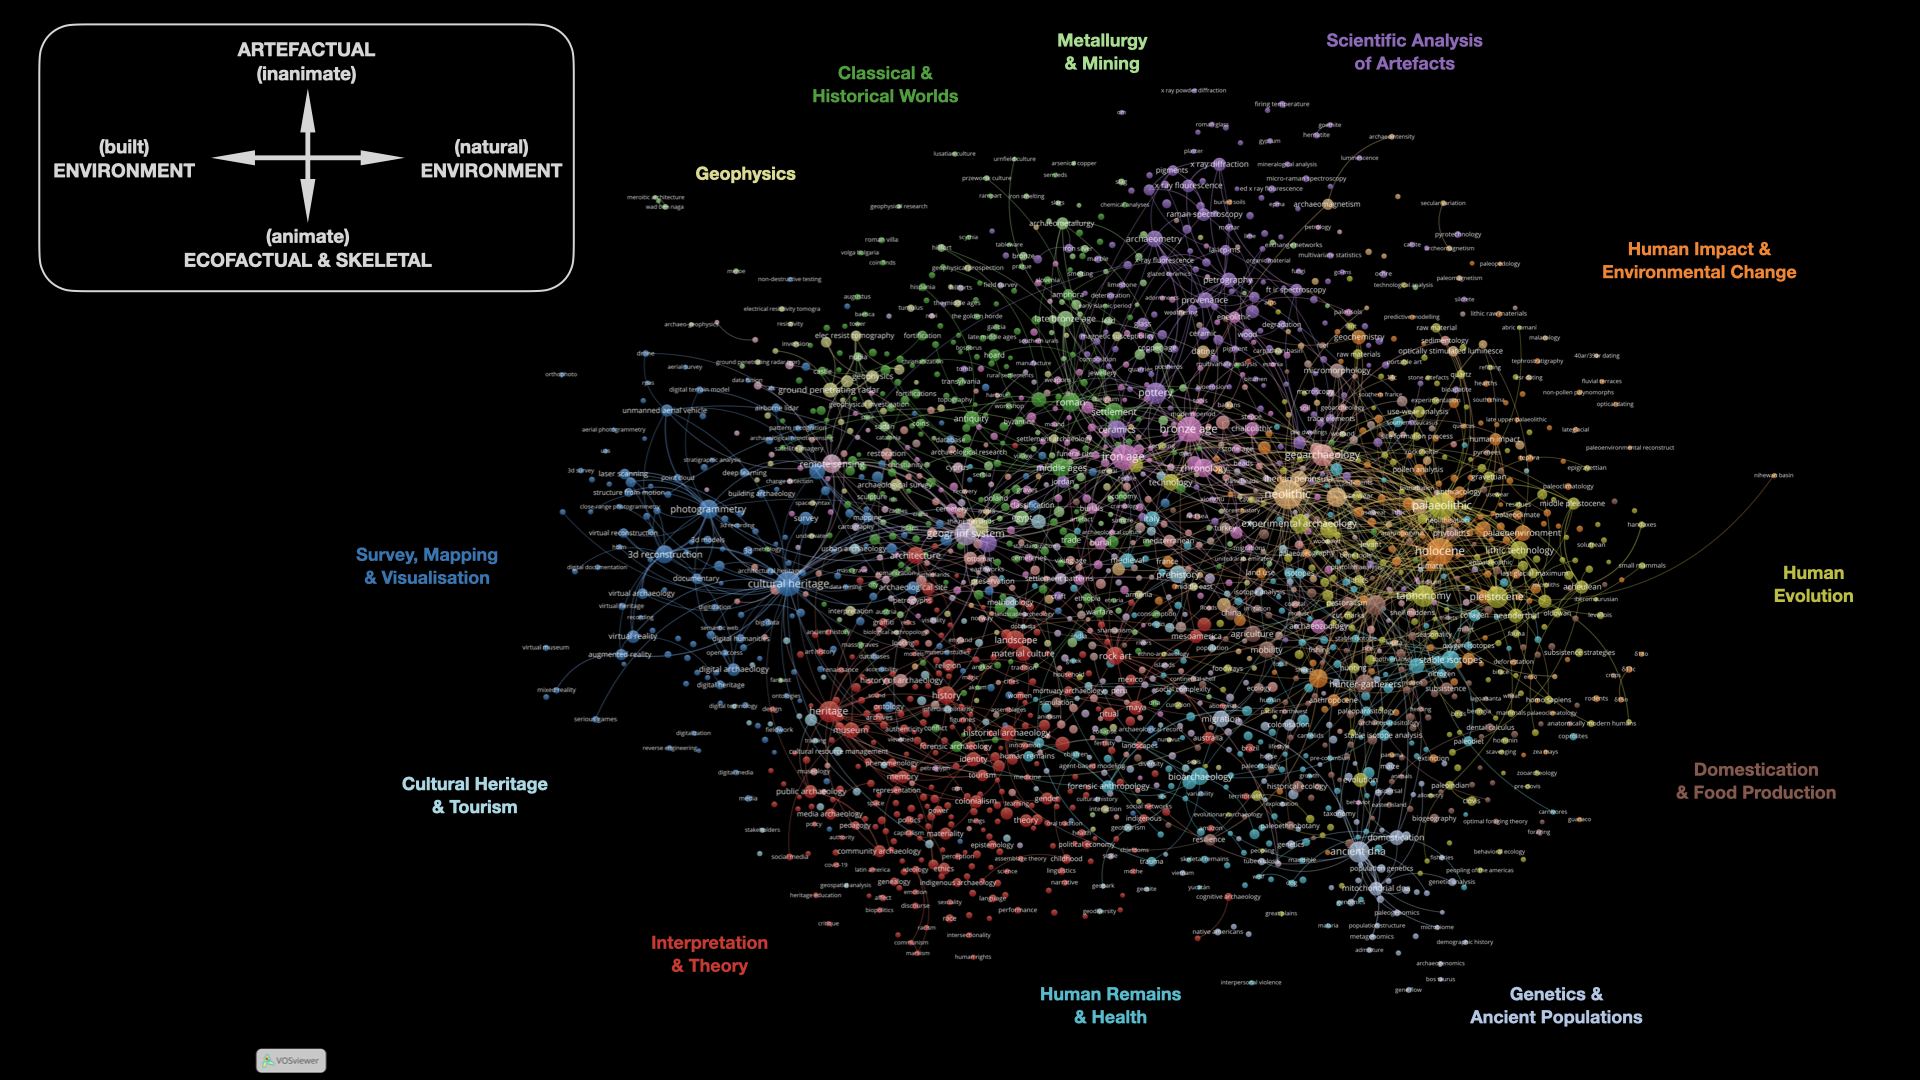
The map of co-occurring author keywords contains 2000 terms each occurring more than 50 times; these are grouped into 18 clusters using a clustering resolution of 1.8 and a minimum cluster size of 30 terms (Figure 7, Table 8). At first sight this is a very different science map to the map of extracted terms; all the terms are mapped into one dense concentration in contrast to the clear ring shape of the map of extracted terms. A closer look, however, reveals stronger similarities with the basic structure of terms remaining the same. Terms associated with interpretation and theory, heritage, survey, mapping and visualisation and the classical and historical worlds are to the left-hand side, while terms associated with the scientific analysis of artefacts, environmental science, human evolution and domestication are on the right. The top of the map contains terms that are about the analysis of artefacts, while the bottom contains the terms associated with the animate world. Most of the same terms are present and clustered into similar groupings to the map of extracted terms.
| Cluster Colour | Cluster Theme: The Language of... | Examples of Terms Within Cluster |
|---|---|---|
| Cluster 1 (176 terms) | Interpretation & Theory | agency, burials, colonialism, community, conflict, culture, ethics, ethnicity, ethnoarchaeology, ethnography, feasting, gender, heritage, historical archaeology, history, identity, landscape, material culture, memory, religion, ritual, rock art, social complexity, theory, warfare |
| Cluster 2 (141 terms) | Survey, Mapping & Forms of Visualisation, & Maritime Archaeology | aerial photography, archaeological survey, architecture, classification, cultural heritage, documentary, excavation, geographic information system, geophysics, ground-penetrating radar, interpretation, maritime archaeology, modelling, photogrammetry, prospection, remote sensing, shipwreck, virtual reality |
| Cluster 3 (122 terms) | Scientific analysis of artefacts (esp. provenance & characterisation) | archaeometry, bronze, ceramic, chemical characterisation, FTIR spectroscopy, geochemistry, glass, LA-ICP-MS, neutron activation analysis, obsidian, petrography, pottery, provenance, Raman spectroscopy, scanning electron microscopy, X-ray fluorescence |
| Cluster 4 (161 terms) | Human evolution (species, cognition and technology) | Acheulean, anatomically modern humans, cut marks, evolution, experimental archaeology, hunting, lithic technology, palaeolithic, pleistocene, taphonomy, technology |
| Cluster 5 (160 terms) | Reconstructing Palaeoenvironments (esp. using pollen & charcoal) | archaeobotany, charcoal, climate change, extinction, fire, geoarchaeology, Holocene, human impact, land use, palaeoenvironmemt, palynology, pollen, sea level, stratigraphy |
| Cluster 6 (139 terms) | The Analysis of Human Remains (incl. using DNA) | ancient DNA, bioarchaeology, demography, forensic anthropology, forensic science, human remains, palaeopathology, sex determination, trauma |
| Cluster 7 (127 terms) | The Classical & Historical Worlds | antiquity, Byzantine, cemetery, early middle ages, epigraphy, graves, historiography, history of archaeology, middle ages, numismatics, Roman empire, settlement |
| Cluster 8 (119 terms) | The Origins of Agricultural Subsistence | agriculture, archaeozoology, early bronze age, fishing, historical ecology, hunter-gatherers, landscape archaeology, levant, mesolithic, neolithic, subsistence |
| Cluster 9 (104 terms) | Stable Isotope Analysis (incl. identification of domesticates and migration) | bone, carbon, collagen, diagenesis, diet, domestication, migration, mitochondrial DNA, nitrogen, stable isotopes, strontium |
| Cluster 10 (104 terms) | Conservation & Preservation of Artefacts | art, China, conservation, copper age, dendrochronology, environment, museum, preservation, waterlogged wood |
| Cluster 11 (75 terms) | Geoarchaeological Analysis | activity, cartography, environmental change, geomorphology, Iran, Iraq, sedimentology, tectonics |
| Cluster 12 (69 terms) | Later Prehistory & Metallurgy | archaeometallurgy, bronze age, chalcolithic, Egypt, Iberian peninsula, iron age, late bronze age, metallurgy, smelting, tin |
| Cluster 13 (66 terms) | Australasia and Pacific Colonisation | Australia, culture change, ecology, exchange, genetics, interaction, Lapita, Micronesia, trade |
| Cluster 14 (66 terms) | Residue Analysis | amphora, biomarkers, fatty acids, fish, gas-chromatography mass spectrometry, infrared spectroscopy, lipids, mass spectrometry, residue analysis, Roman, wine |
| Cluster 15 (49 terms) | Archaeomagnetism? | archaeomagnetism, climate change, collapse, Europe, formative period, Maya, mesoamerica, Mexico, soil |
| Cluster 16 (48 terms) | Medieval Europe | Christianity, dating, economy, Norse, restoration, Viking age, wood |
| Cluster 17 (42 terms) | Absolute Dating & Chronology | 14C data, accelerator mass spectrometry, Bayesian analysis, chronology, luminescence, optically stimulated luminescence, prehistory, radiocarbon dating |
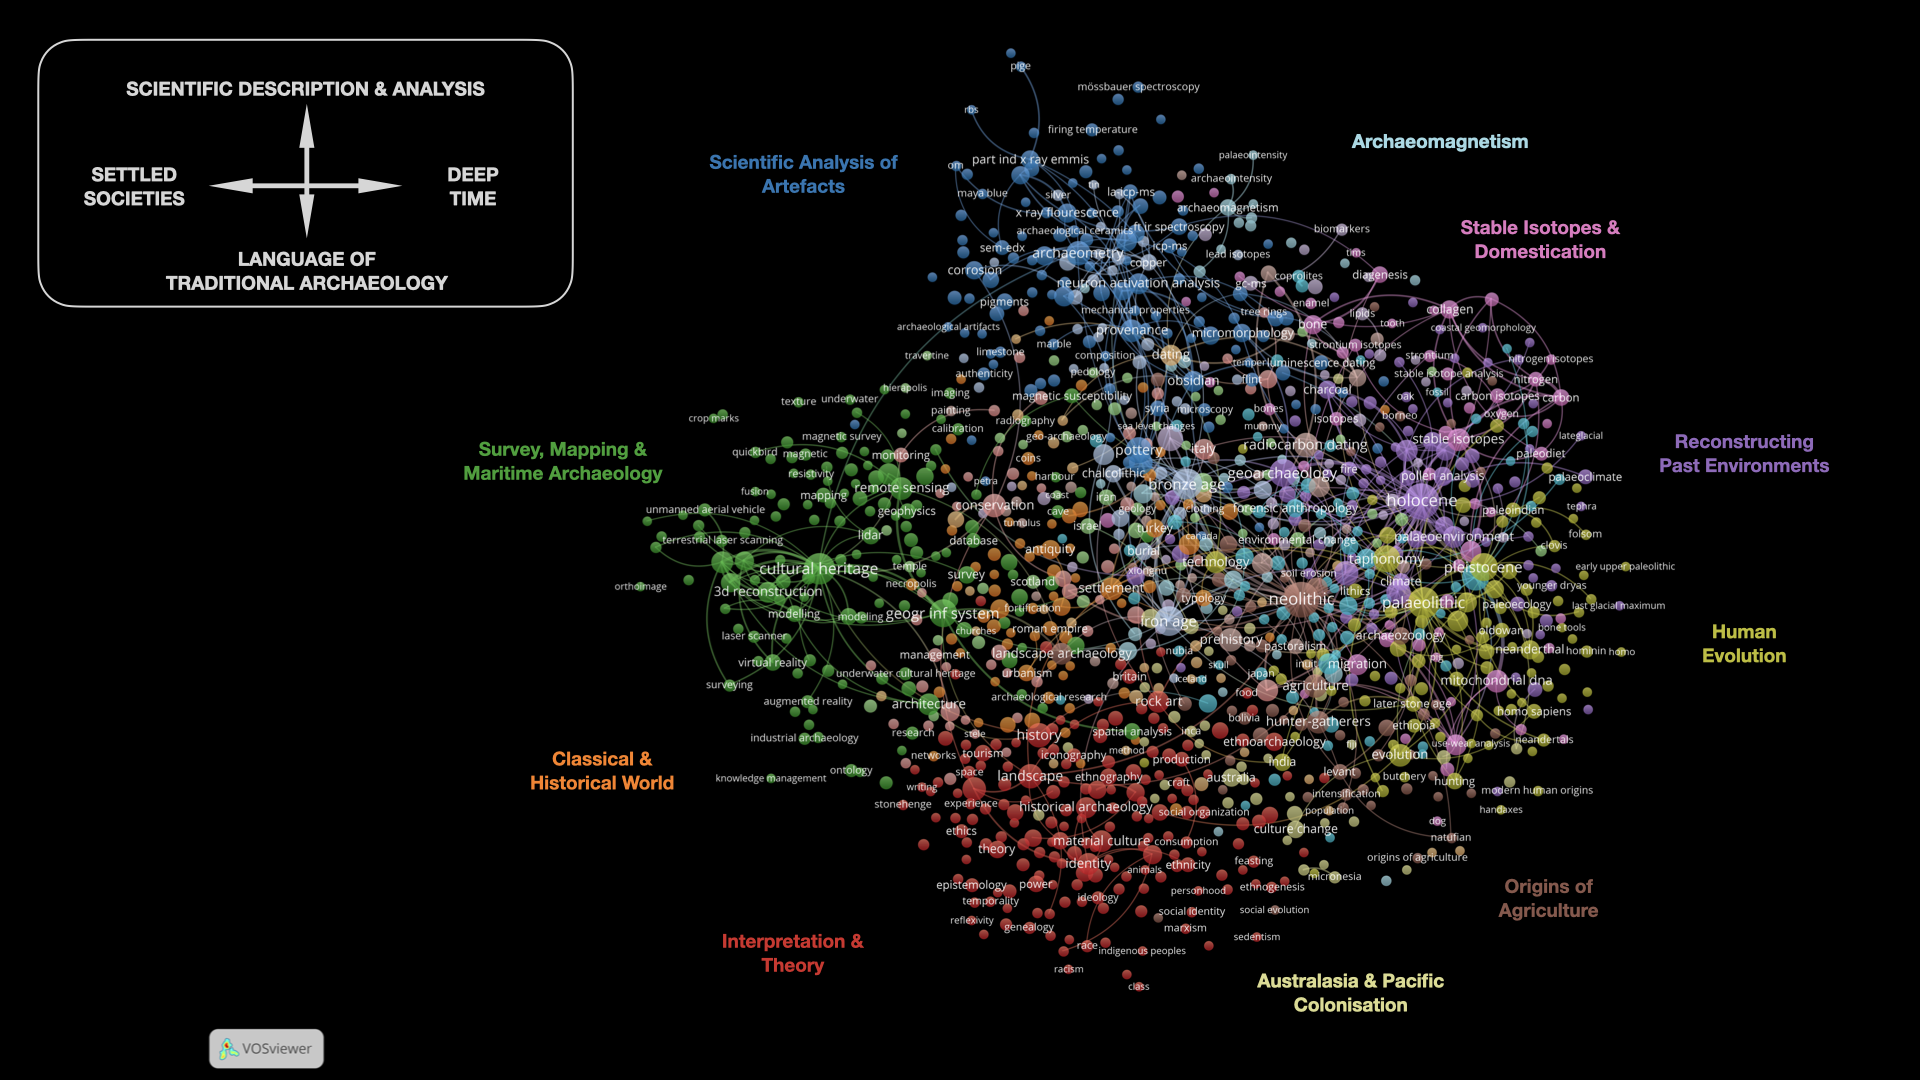
Continuity in the same pattern can be seen for the science map of author keywords for the period 2004-2013. The map presents 1200 keywords grouped into 17 clusters using a clustering resolution of 1.8, a minimum cluster size of 30 items and a threshold for inclusion of 30 occurrences (Figure 8, Table 9). The same single concentration of terms is present, along with the distinction being drawn between the language of interpretation and theory and the classical worlds and environments, domestication and early hominins on the other. The language of scientific analysis of artefacts and of diet with stable isotopes is placed close together at the top. The language of genetic analysis is still present, and still associated with studies of domestication, though there is less of it.
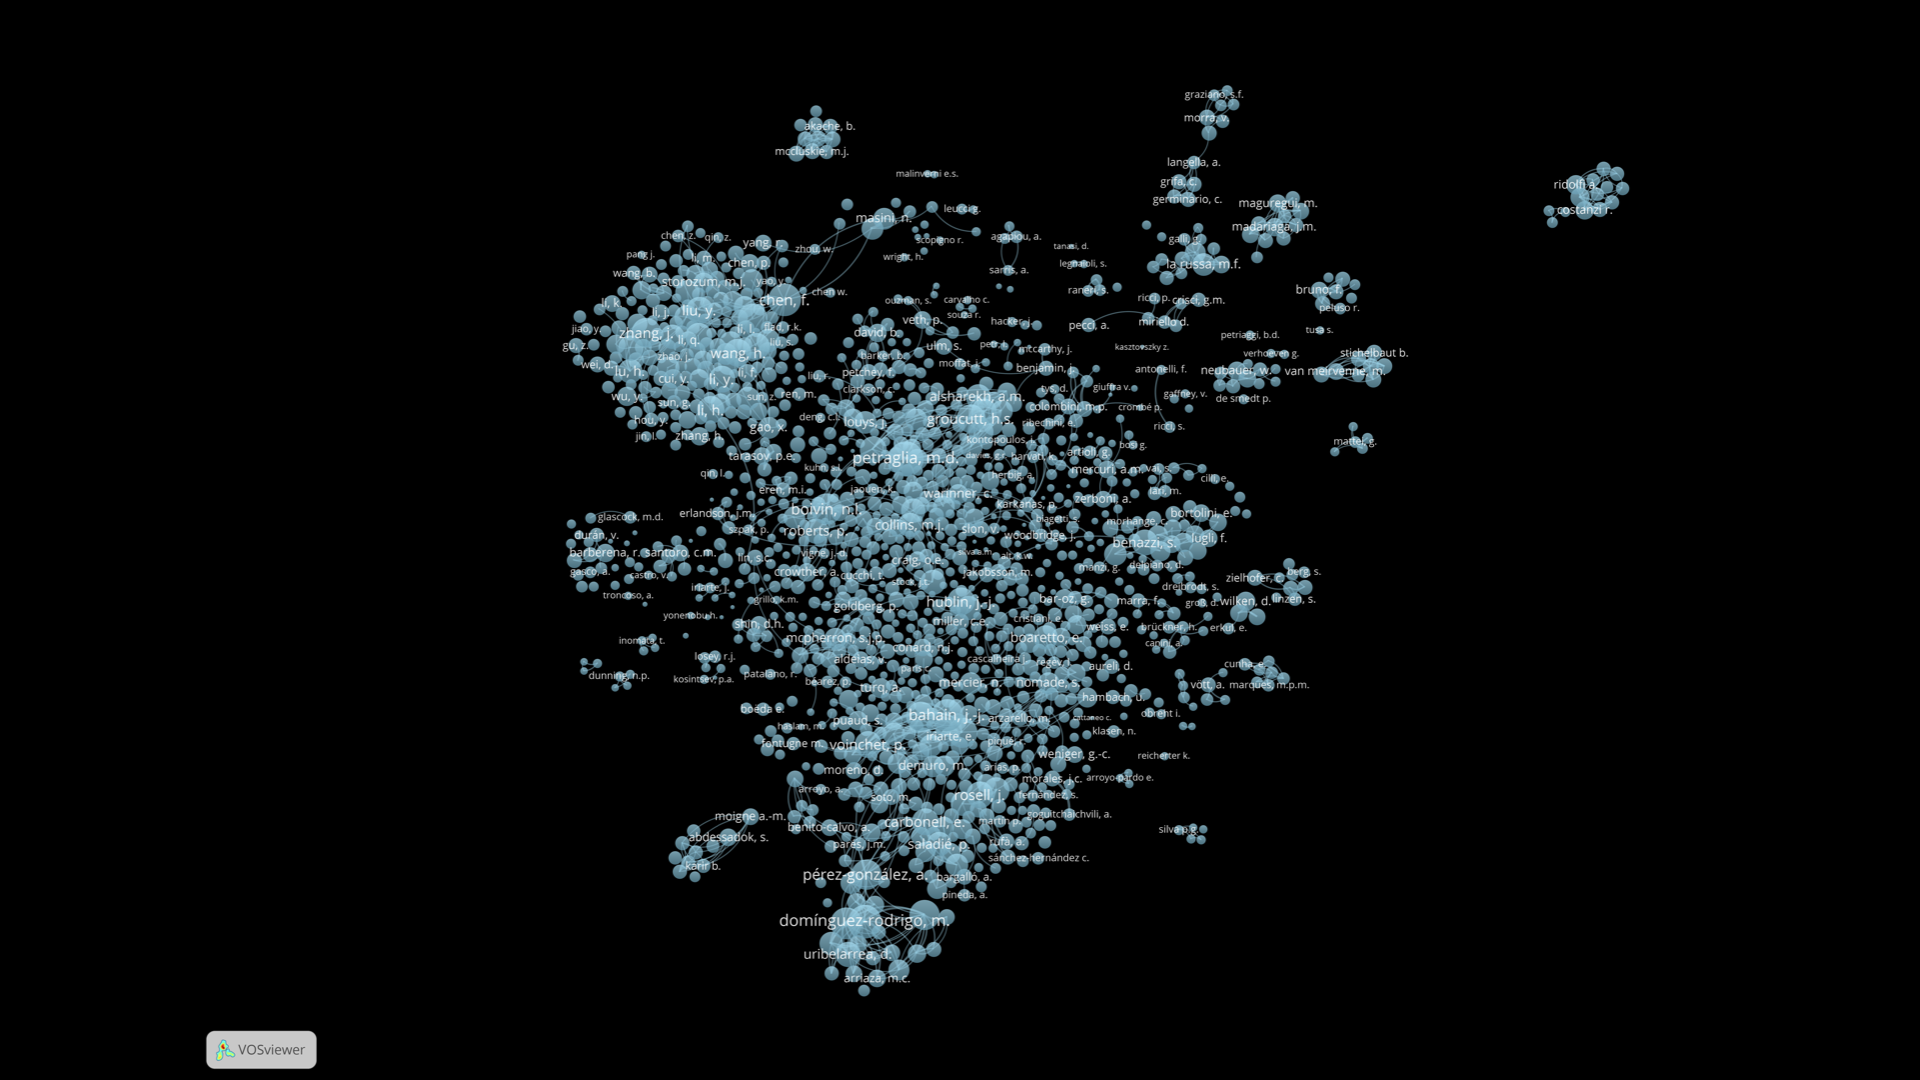
The science map of co-authorship for the period 2014-2021 (Figure 9) presents nearly 1500 authors. The nodes in this map are not clustered because the number of clusters generated varies enormously, with just a small change to the clustering resolution and/or a change to the minimum number of individuals within a cluster. Indeed, at any clustering resolution above 1.0 the number of clusters is greater than the number of colours that can normally be assigned to clusters by VOSviewer. The same problem exists for the map of co-authors for the earlier period 2004-2013 (Figure 10), which presents approximately 1400 co-authors. Both maps present a single, very large concentration of co-authors in the centre along with a series of separate co-author clusters tightly networked together but separated from the main concentration. Within the main concentration, individuals demonstrate a wide series of co-author relationships; in 2014-2021, examples of such widely connected individuals include Bahain, J.-J., Boivin, N.L., Chen, F., Collins, M.J., Dominguez-Rodrigo, M., Higham, T.F.G, McPherron, S.J.P, Moncel, M.H. and Petraglia, M.D. A noticeable feature of the maps of co-authors for both 2004-2013 and 2014-2021 is the presence of a distinct, large cluster of Chinese authors to be found in the top left-hand side of both maps. This group of co-authors was not evident in the co-citation map of authors created form the WoS data for the earlier study (Sinclair 2016) but, as noted above, since the publication of that study WoS has started a specific Chinese Citation Index, and Scopus will have increased its indexing of Chinese research.
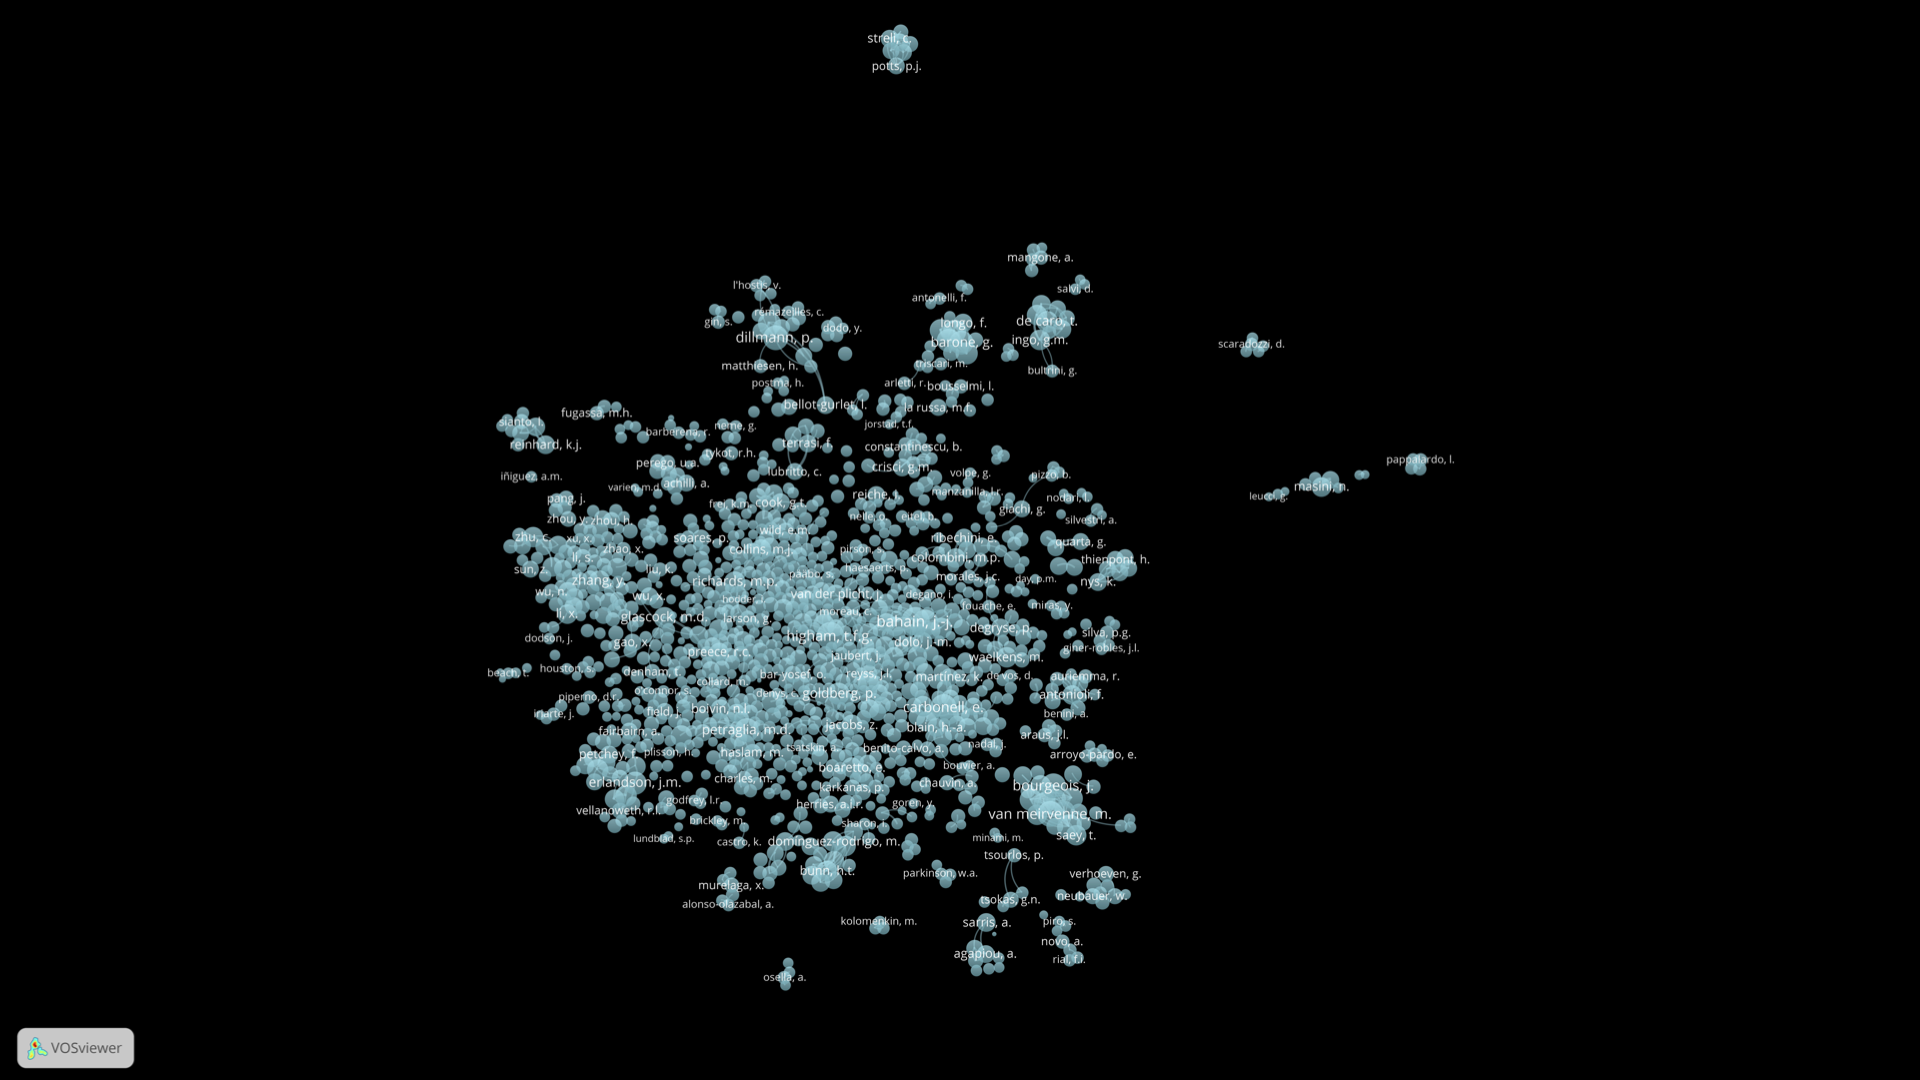
| Cluster Colour | Examples of Universities & Institutions |
|---|---|
| Cluster 1 (35 items) | Oxford, York, Durham, Leicester, Queensland, Sheffield, Wollongong, Bristol, Flinders, Edinburgh, Historic England, British Geological Survey, Vrije - Amsterdam, National Museum of Australia |
| Cluster 2 (35 items) | Arizona, Pennsylvania-State, Aberdeen, New Mexico, Oregon, Washington-State, California - Santa-Barbara, Oklahoma, Notre-Dame, Santa-Fe Institute, Crow Canyon Archaeology Center, American Museum of Natural History |
| Cluster 3 (33 items) | Cambridge, Missouri, Southern Methodist, Aarhus, Washington - St. Louis, Copenhagen, Cleveland Museum of Natural History, Tulsa, Auckland, Neanderthal Museum, MR Ltd Auckland |
| Cluster 4 (33 items) | Chinese Academy Sciences - Beijing, IAE - Novosibirisk, Peking, Stanford, Novosibirisk-State, Natural History Museum - London, National Museum - Denmark |
| Cluster 5 (32 items) | Max Planck - Institute for the Study of Human History, Witwatersrand, Australian National University, Sydney, Otago, Michigan, Bologna, Oslo, Pisa |
| Cluster 6 (28 items) | Haifa, Simon-Fraser, Tel Aviv, Hebrew, Israel Antiquities Authority, British Colombia, Alberta, Dublin, Sapienza, Utah, Geological Survey Israel |
| Cluster 7 (26 items) | Max Planck - International Energy Agency, Harvard, Toronto, Cape Town, Smithsonian, Tubing, Pennsylvania, Colorado - Boulder, Boston, Stony Brook, Eberhard Karls, Johannesburg |
| Cluster 8 (25 items) | UCL-Institute of Archaeology, Rovira-Virgili, IPHES-Taragona, Complutense-Madrid, IRCEA-Barcelona, CENIEH-Burgos, Reading, Southampton, Liverpool |
| Cluster 9 (22 items) | Brown, Georgia, Trent, Cincinnati, McMaster, Tulane, Cornell, George Mason, South Carolina, Kentucky, Central-Florida |
| Cluster 10 (19 items) | Russian Academy of Sciences-Moscow, Leiden, Calgary, Exeter, Helsinki, Stockholm, Gothenburg, Lund, Groningen, Vanderbilt |
| Cluster 11 (14 items) | California - Berkeley, Warsaw, Polish Academy of Sciences - Krakow, La Trobe, Texas-Austin, Tehran, Tokyo, Polish Academy of Sciences - Warsaw |
| Cluster 12 (13 items) | Florida, Glasgow, Uppsala, Yale, Chicago, Maryland, Dartmouth, Rice, Victoria, DePaul |
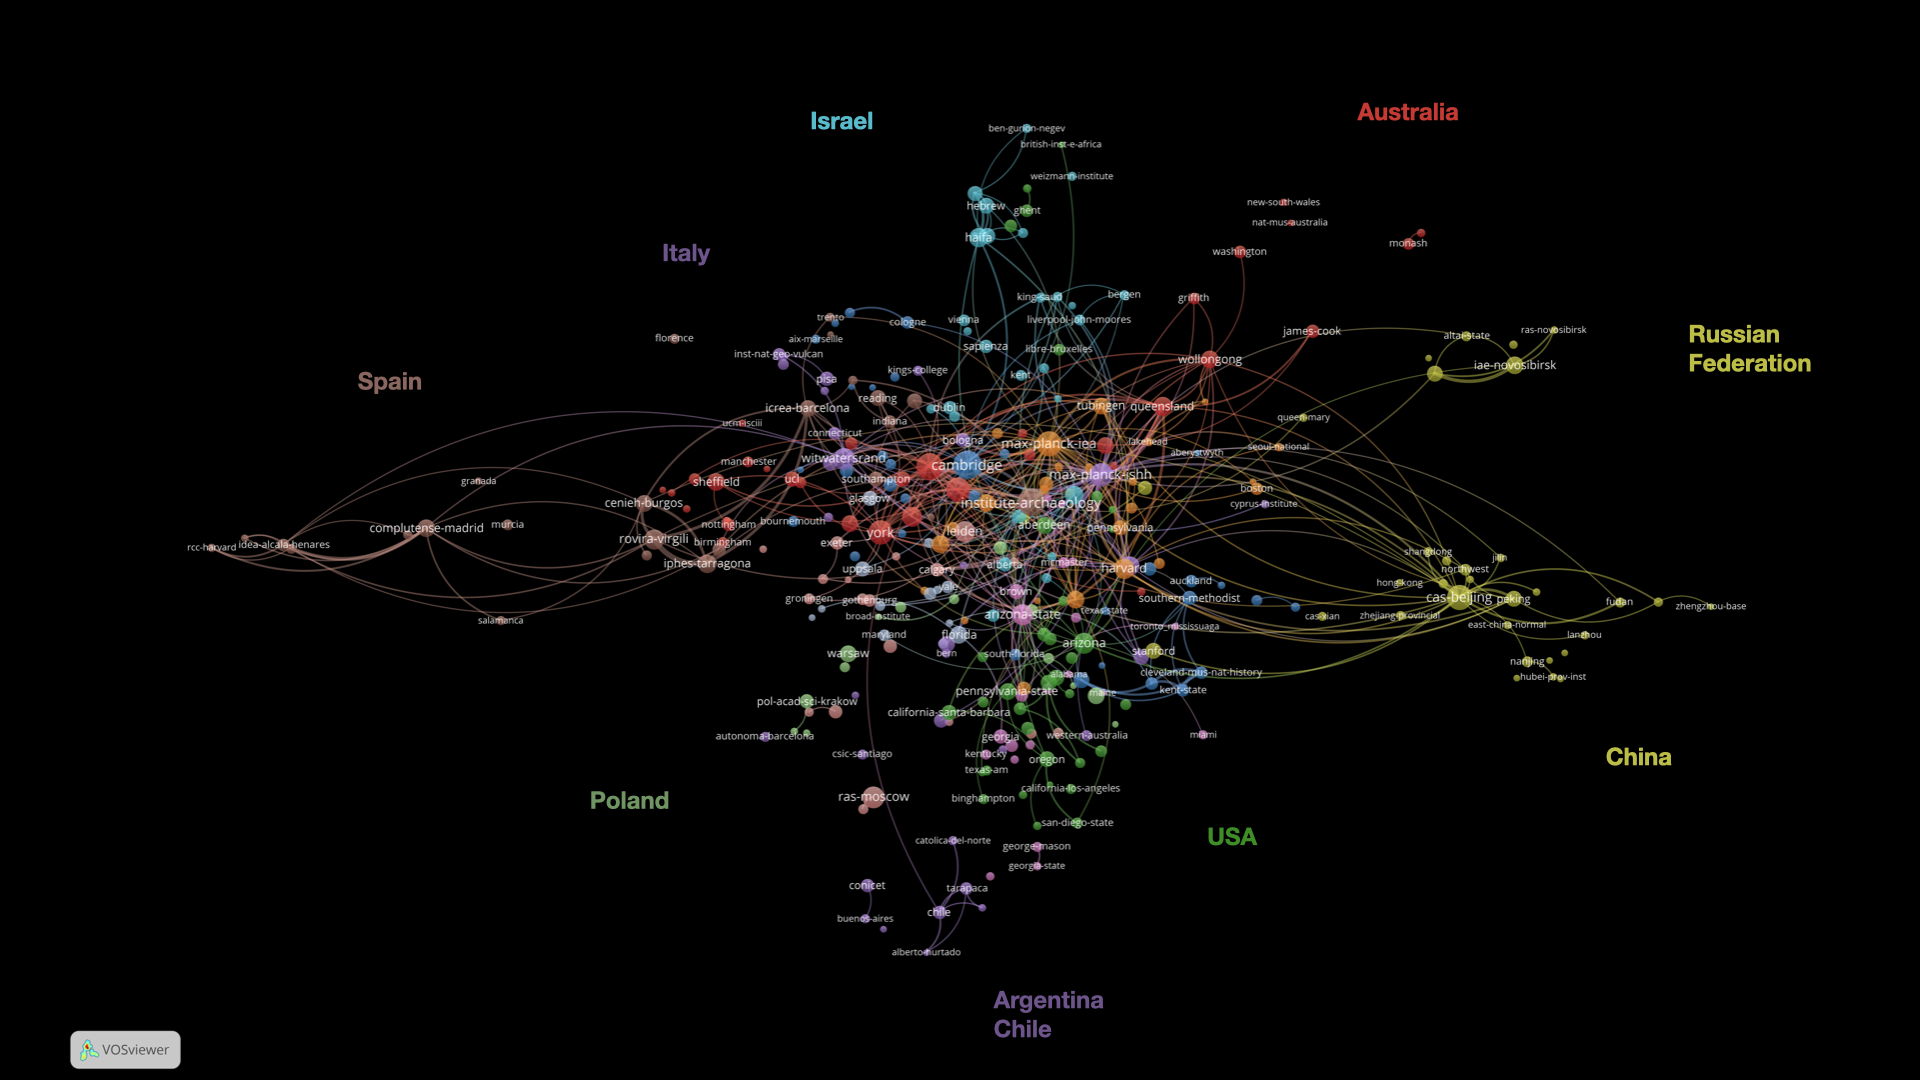
The map of collaborating institutions presents 315 institutions, grouped into 12 clusters using a clustering resolution of 1.8, a minimum cluster size of ten institutions, and a threshold of five published documents (Figure 11, Table 10). There is a single concentration of institutions in the centre of the map with a series of smaller concentrations of institutions around it. Some of these smaller concentrations have a clear national focus, identifiable as indicated in the screenshot. The number and composition of clusters of institutions in this map is sensitive to change, with changes in the clustering resolution. It is noticeable, however, that, with the exception of cluster 9, whose institutions are primarily based in North America, no cluster has a specifically regional or national identity. There are also institutions based in all geographical regions that demonstrate a very wide range of collaborative links. Examples include Cambridge, Durham, the Institute of Archaeology, Oxford and York in the UK, the Chinese Academy of Sciences in Beijing, the Max Planck Institutes, the Australian National University and the University of Queensland in Australia, Harvard in the USA, and the University of the Witwatersrand in South Africa. The map for 2004-2013 contains 248 institutions grouped into 9 clusters with a clustering resolution of 1.0 and a minimum cluster size of 15 institutions (Figure 12, Table 11). The threshold for inclusion is the publication of five documents. Most of the same institutions are visible in both maps, but there is a striking difference in the overall shape of the map through time. The single dense concentration of institutions in the later period has developed out of two clear concentrations, with a primarily North American concentration to the left, and concentration of institutions from the UK and Australia to the right. Between these two there is a small grouping of institutions based in Israel and two small concentrations from Spain and China in the upper half of the map. Through time, archaeological research, where it requires collaboration, has become a fundamentally international activity no matter where researchers are based.
| Cluster Colour | Examples of Universities & Institutions |
|---|---|
| Cluster 1 (45 items) | Arizona-State, Florida, Haifa, Harvard, Institute-Archaeology, Simon Fraser, Royal-Holloway, Smithsonian, Washington |
| Cluster 2 (39 items) | Arizona, California-Santa-Barbara, Colorado-Boulder, Leiden, Oregon, Pennsylvania-State, Southern-Methodist, Stony-Brook |
| Cluster 3 (34 items) | Aberdeen, Bradford, Bristol, Cambridge, Durham, Leicester, Oxford, natural-History-Museum-London, Sheffield |
| Cluster 4 (25 items) | Chicago, Florida-State, Maryland, Ohio-State, Reading, Texas-Austin, Washington-St-Louis |
| Cluster 5 (25 items) | British-Columbia, California-Davis, Minnesota, Missouri, New-Mexico, Pittsburgh, Trinity-College |
| Cluster 6 (23 items) | Australian-National, Monash, Queensland, Sydney, Witwatersrand, Wollongong, York |
| Cluster 7 (22 items) | Boston, Cape-Town, Complutense-Madrid, Max-Planck-IEA, Rovira-Vigli, Toronto, Wisconsin-Madison |
| Cluster 8 (18 items) | Berkeley, Berkeley-GeoChron-Center, CAS-Beijing, George-Washington, Peking |
| Cluster 9 (17 items) | Auckland, California-Berkeley, Santa-Fe-Institute, Southampton, Stanford, Washington-State |

Science mapping and scientometrics more generally offer incredible opportunities for detailed exploration of a discipline, but to make a genuinely valuable contribution they must offer some insight that is not easily achieved by other means. In the final sections below three such aspects will be discussed. The first considers the rate and manner of growth of archaeology as a discipline. The second continues an examination of diversity in the authorship of the most cited knowledge claims. Discussion ends with a consideration of the nature of language use in the discipline. In all cases, it is the opportunities raised by a perspective of the discipline as a whole that is important.
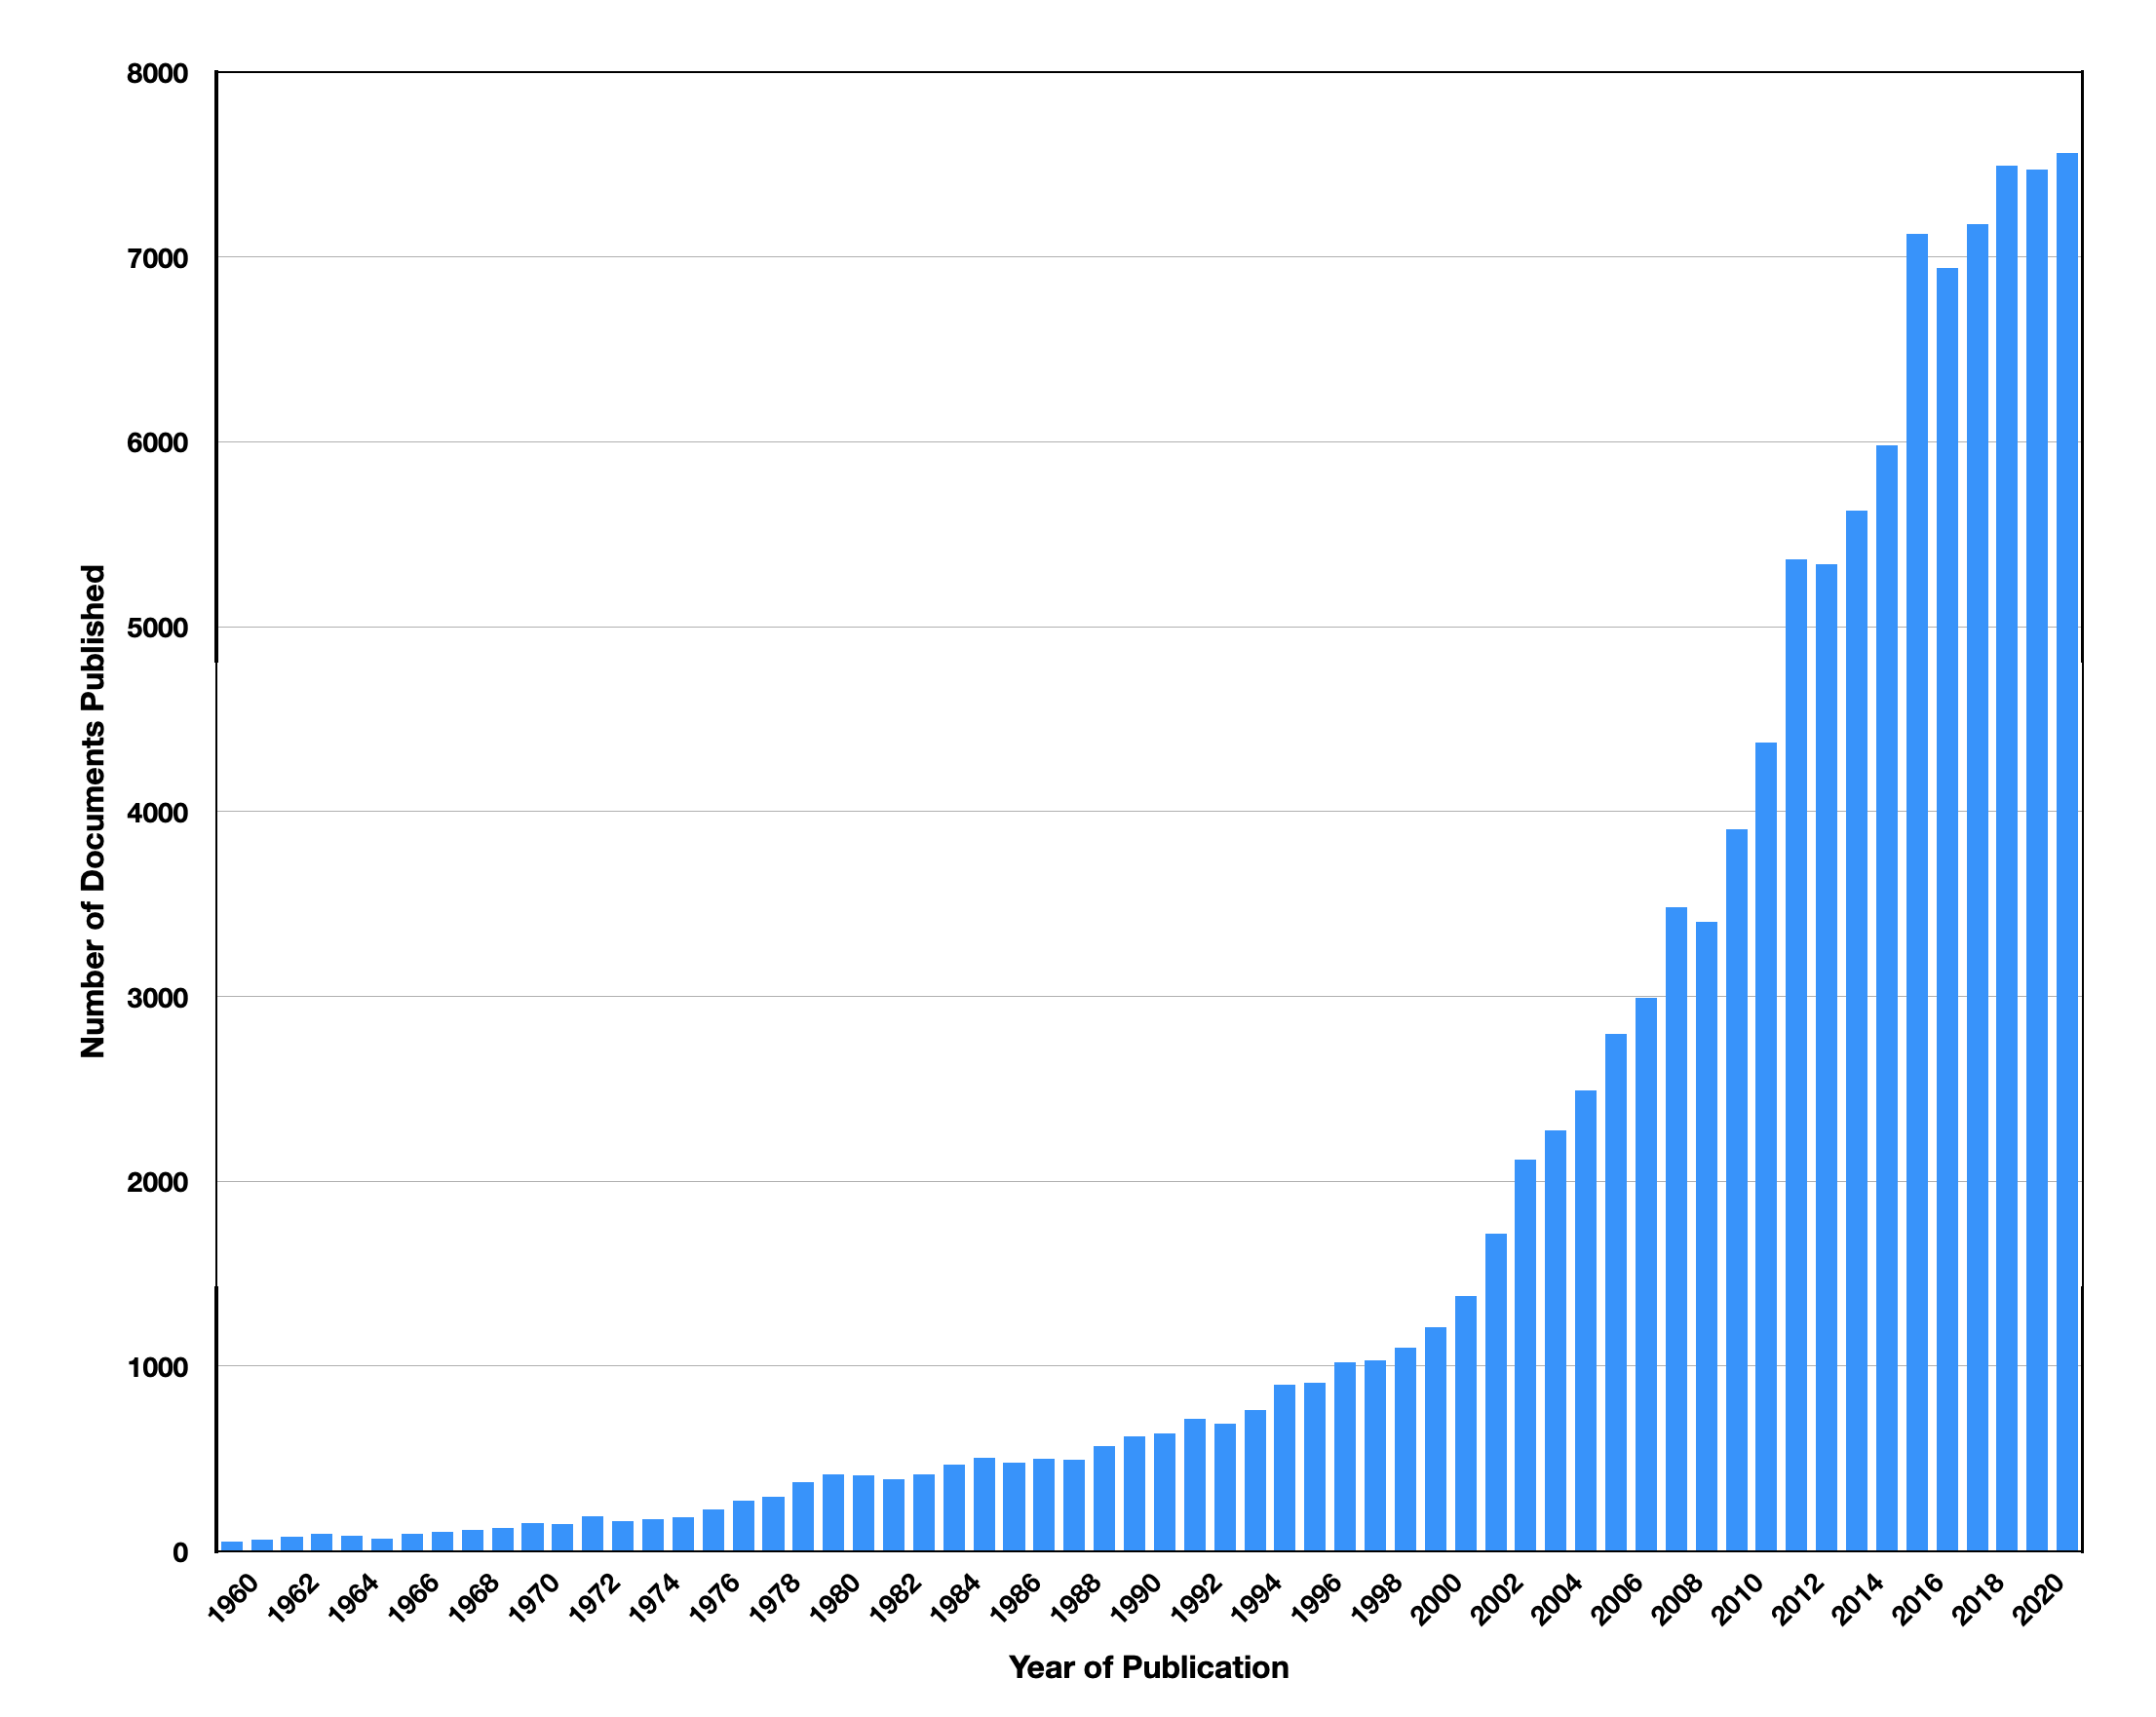
Scopus data reveal that there has been a clear and steady increase in the number of archaeological research documents published each year since 1960 (Figure 13). A possible slight plateau is visible for the last four years along with a slight decrease in the number of documents published in 2021, but not sufficiently different to confirm any impact related to COVID-19 - yet. Derek Price, a pioneer of scientometrics, argued that, over the long term, scientific research grew at a quasi-exponential rate based on journal and document numbers as a proxy measure (Price 1961; 1963). Considering the number of archaeological outputs published by year as a cumulative total (Figure 14) there has been an extraordinary increase in the corpus of academic research published since 1960. Previously it was argued that the cumulative total of archaeological outputs doubled approximately every seven years (Sinclair 2016 box 1); the addition of more recent data indicates that this cumulative rate of increase has not changed. However, we might want to examine this growth in more detail and consider its impact upon how scholars draw on the increasing corpus of knowledge claims available to them. This is possible by looking at variations in the growth of types of documents, the rate of growth of archaeology in relation to other areas of science, and the nature of citation back to the accumulated corpus of work.
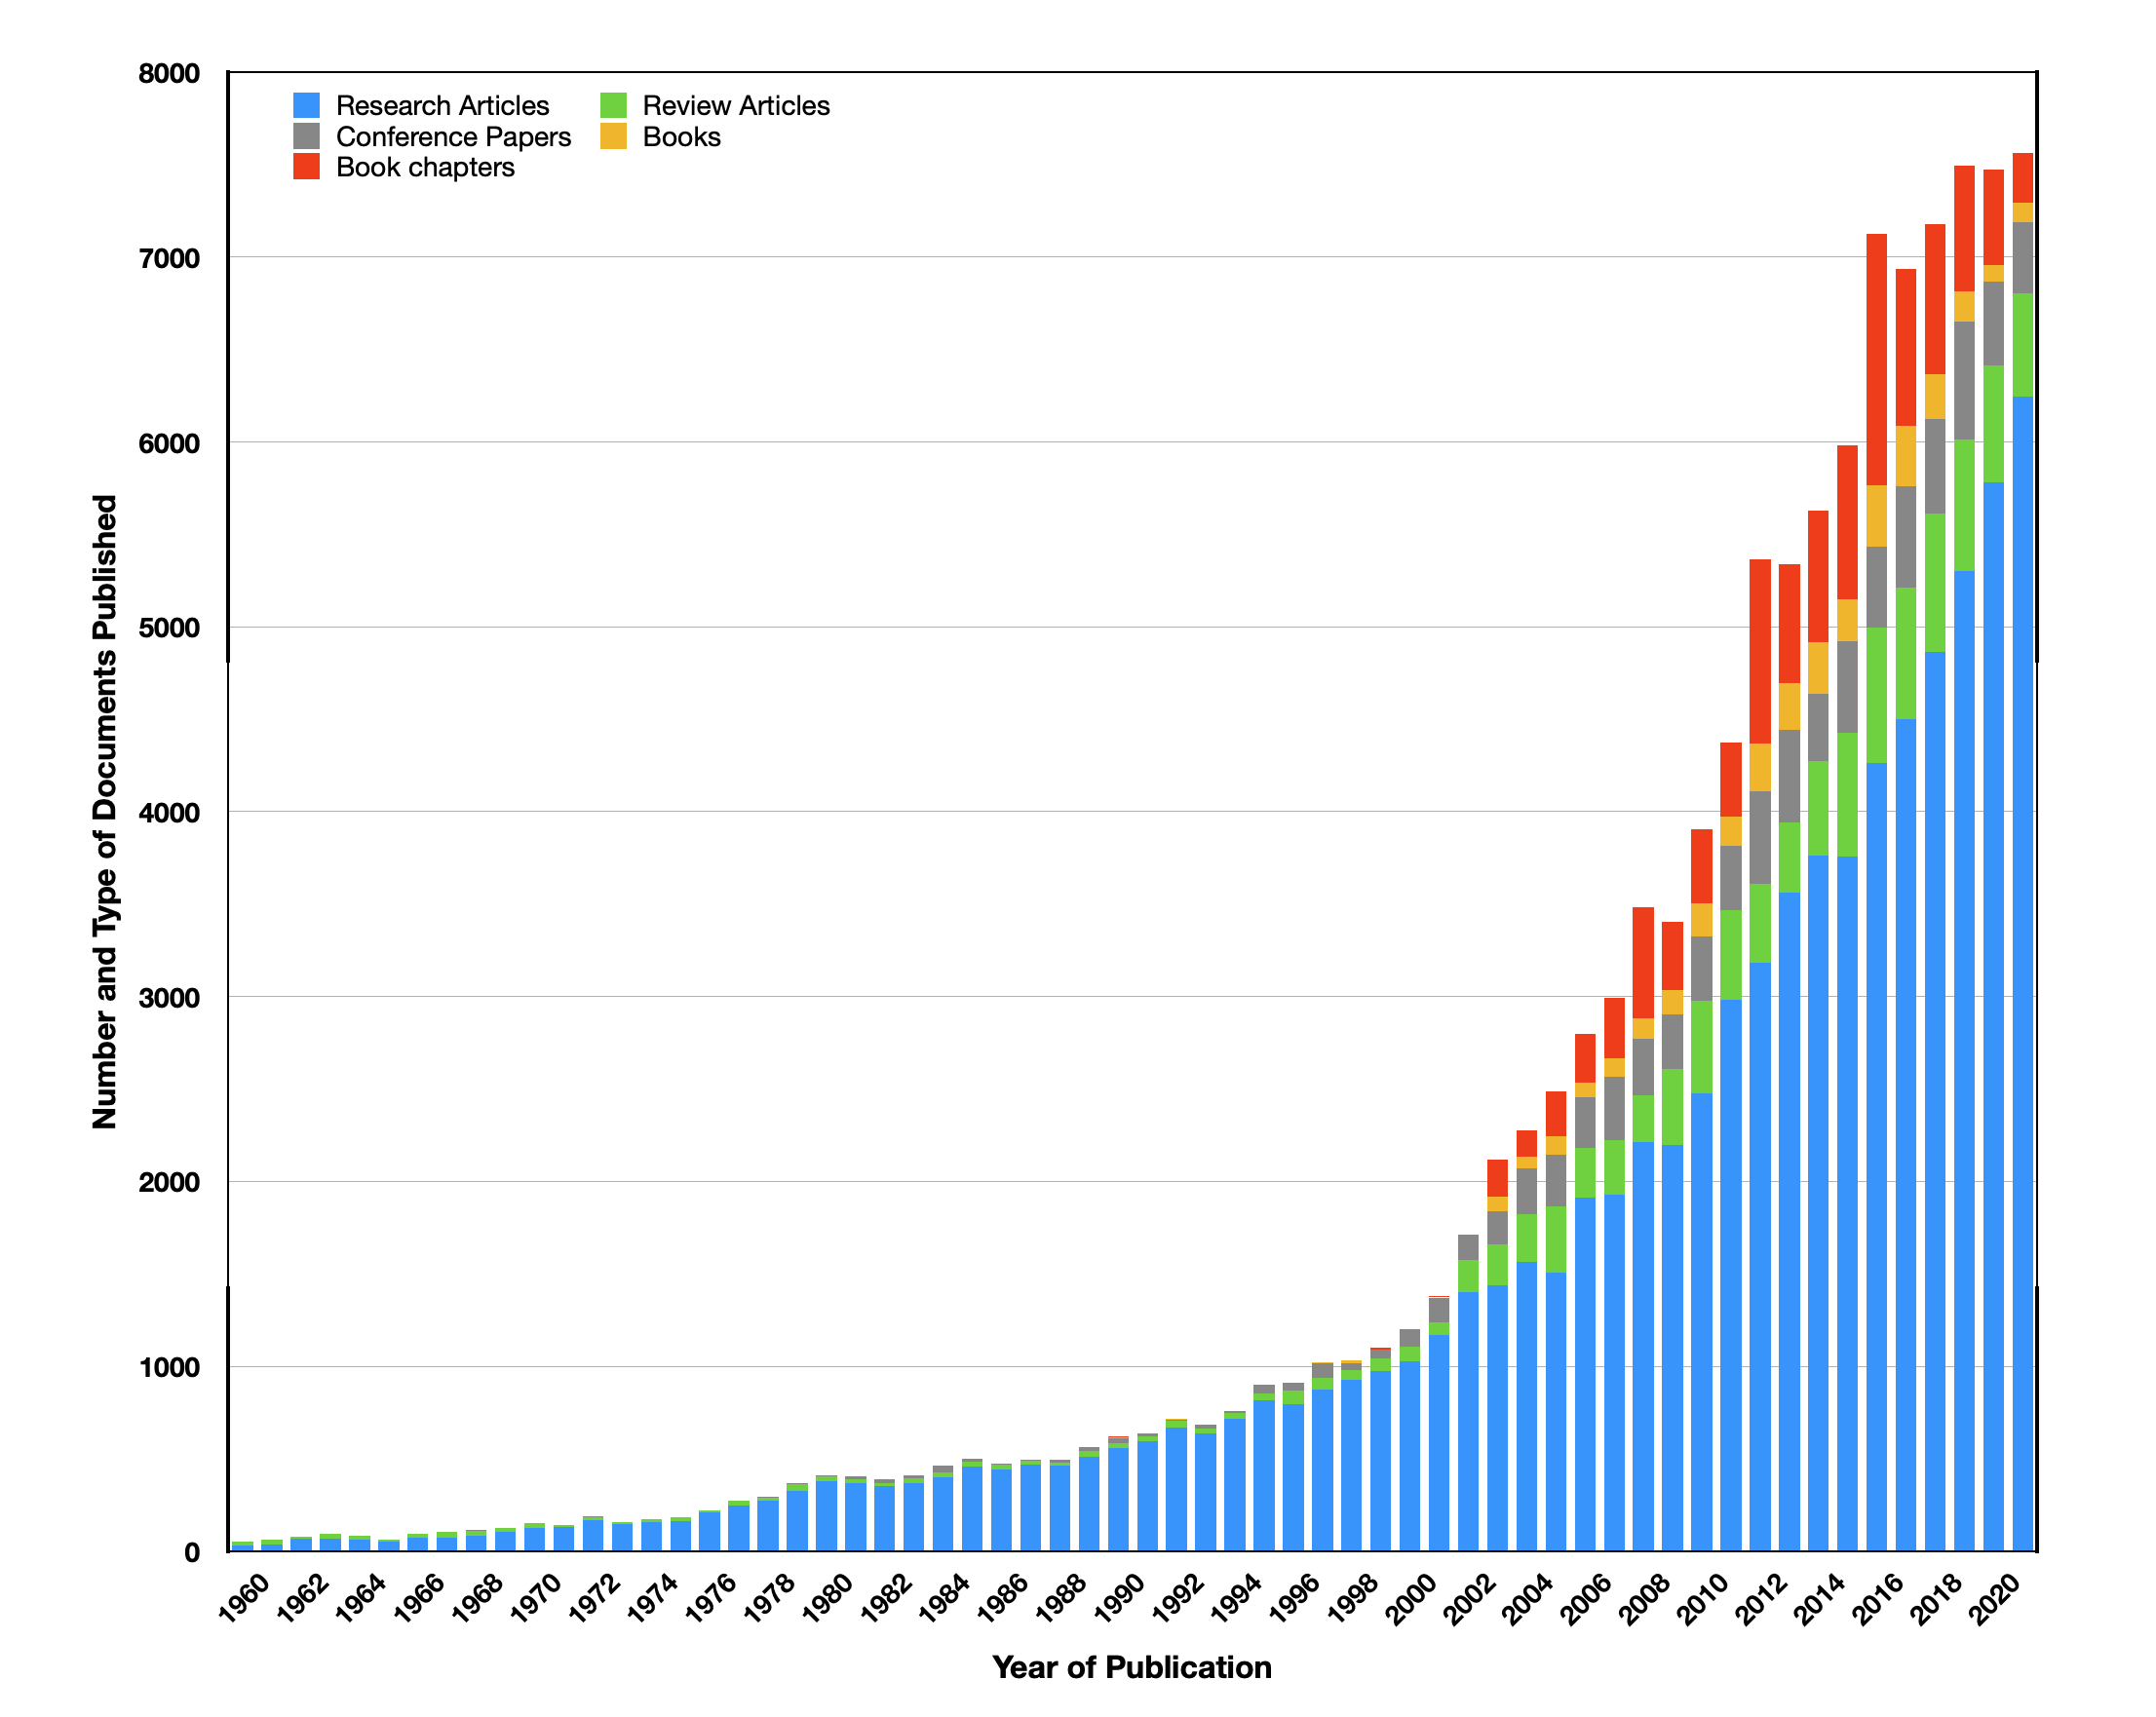
Growth in archaeological research outputs clearly varies by document type (Figure 15). Since 2004, articles published in journals have more than tripled in number. There is also an increase in the number of books, book chapters and conference/proceedings papers published, but it varies from year to year. This difference in growth between document types may result from several factors including the length of time necessary to write or edit books, a practical limit to the number of books that can be published in any year, and possibly choices made by the citation indices in the indexing process – especially for books. The growing increase in journal outputs may also reflect the strategic decisions made by authors (and their research managers) concerning the perceived importance of journal publications in the process of career advancement in academia (Beck et al. 2021), and/or the enhanced visibility and impact of publication in the significant journals in processes of research evaluation at national level. Looking at the science maps of co-cited sources, we can also clearly see the increased importance to archaeological research of a small number of 'high impact' journals - both archaeological and general, even if the members of research evaluation panels might not themselves use the venue of publication as a marker of quality, as noted in the report from Sub-Panel 15: Archaeology (REF 2022 66). In this respect, archaeology is following a more general pattern seen elsewhere. A growth in journal articles as the primary document type submitted for research evaluation has been tracked over many years (Digital Science 2016), with some variation visible when comparing publications in science (health, life, natural and formal), engineering, the social sciences and the arts and humanities, with the arts and humanities still submitting for assessment many more book-format outputs. In the growth of its document types, archaeology currently most closely compares to disciplines in the social sciences.
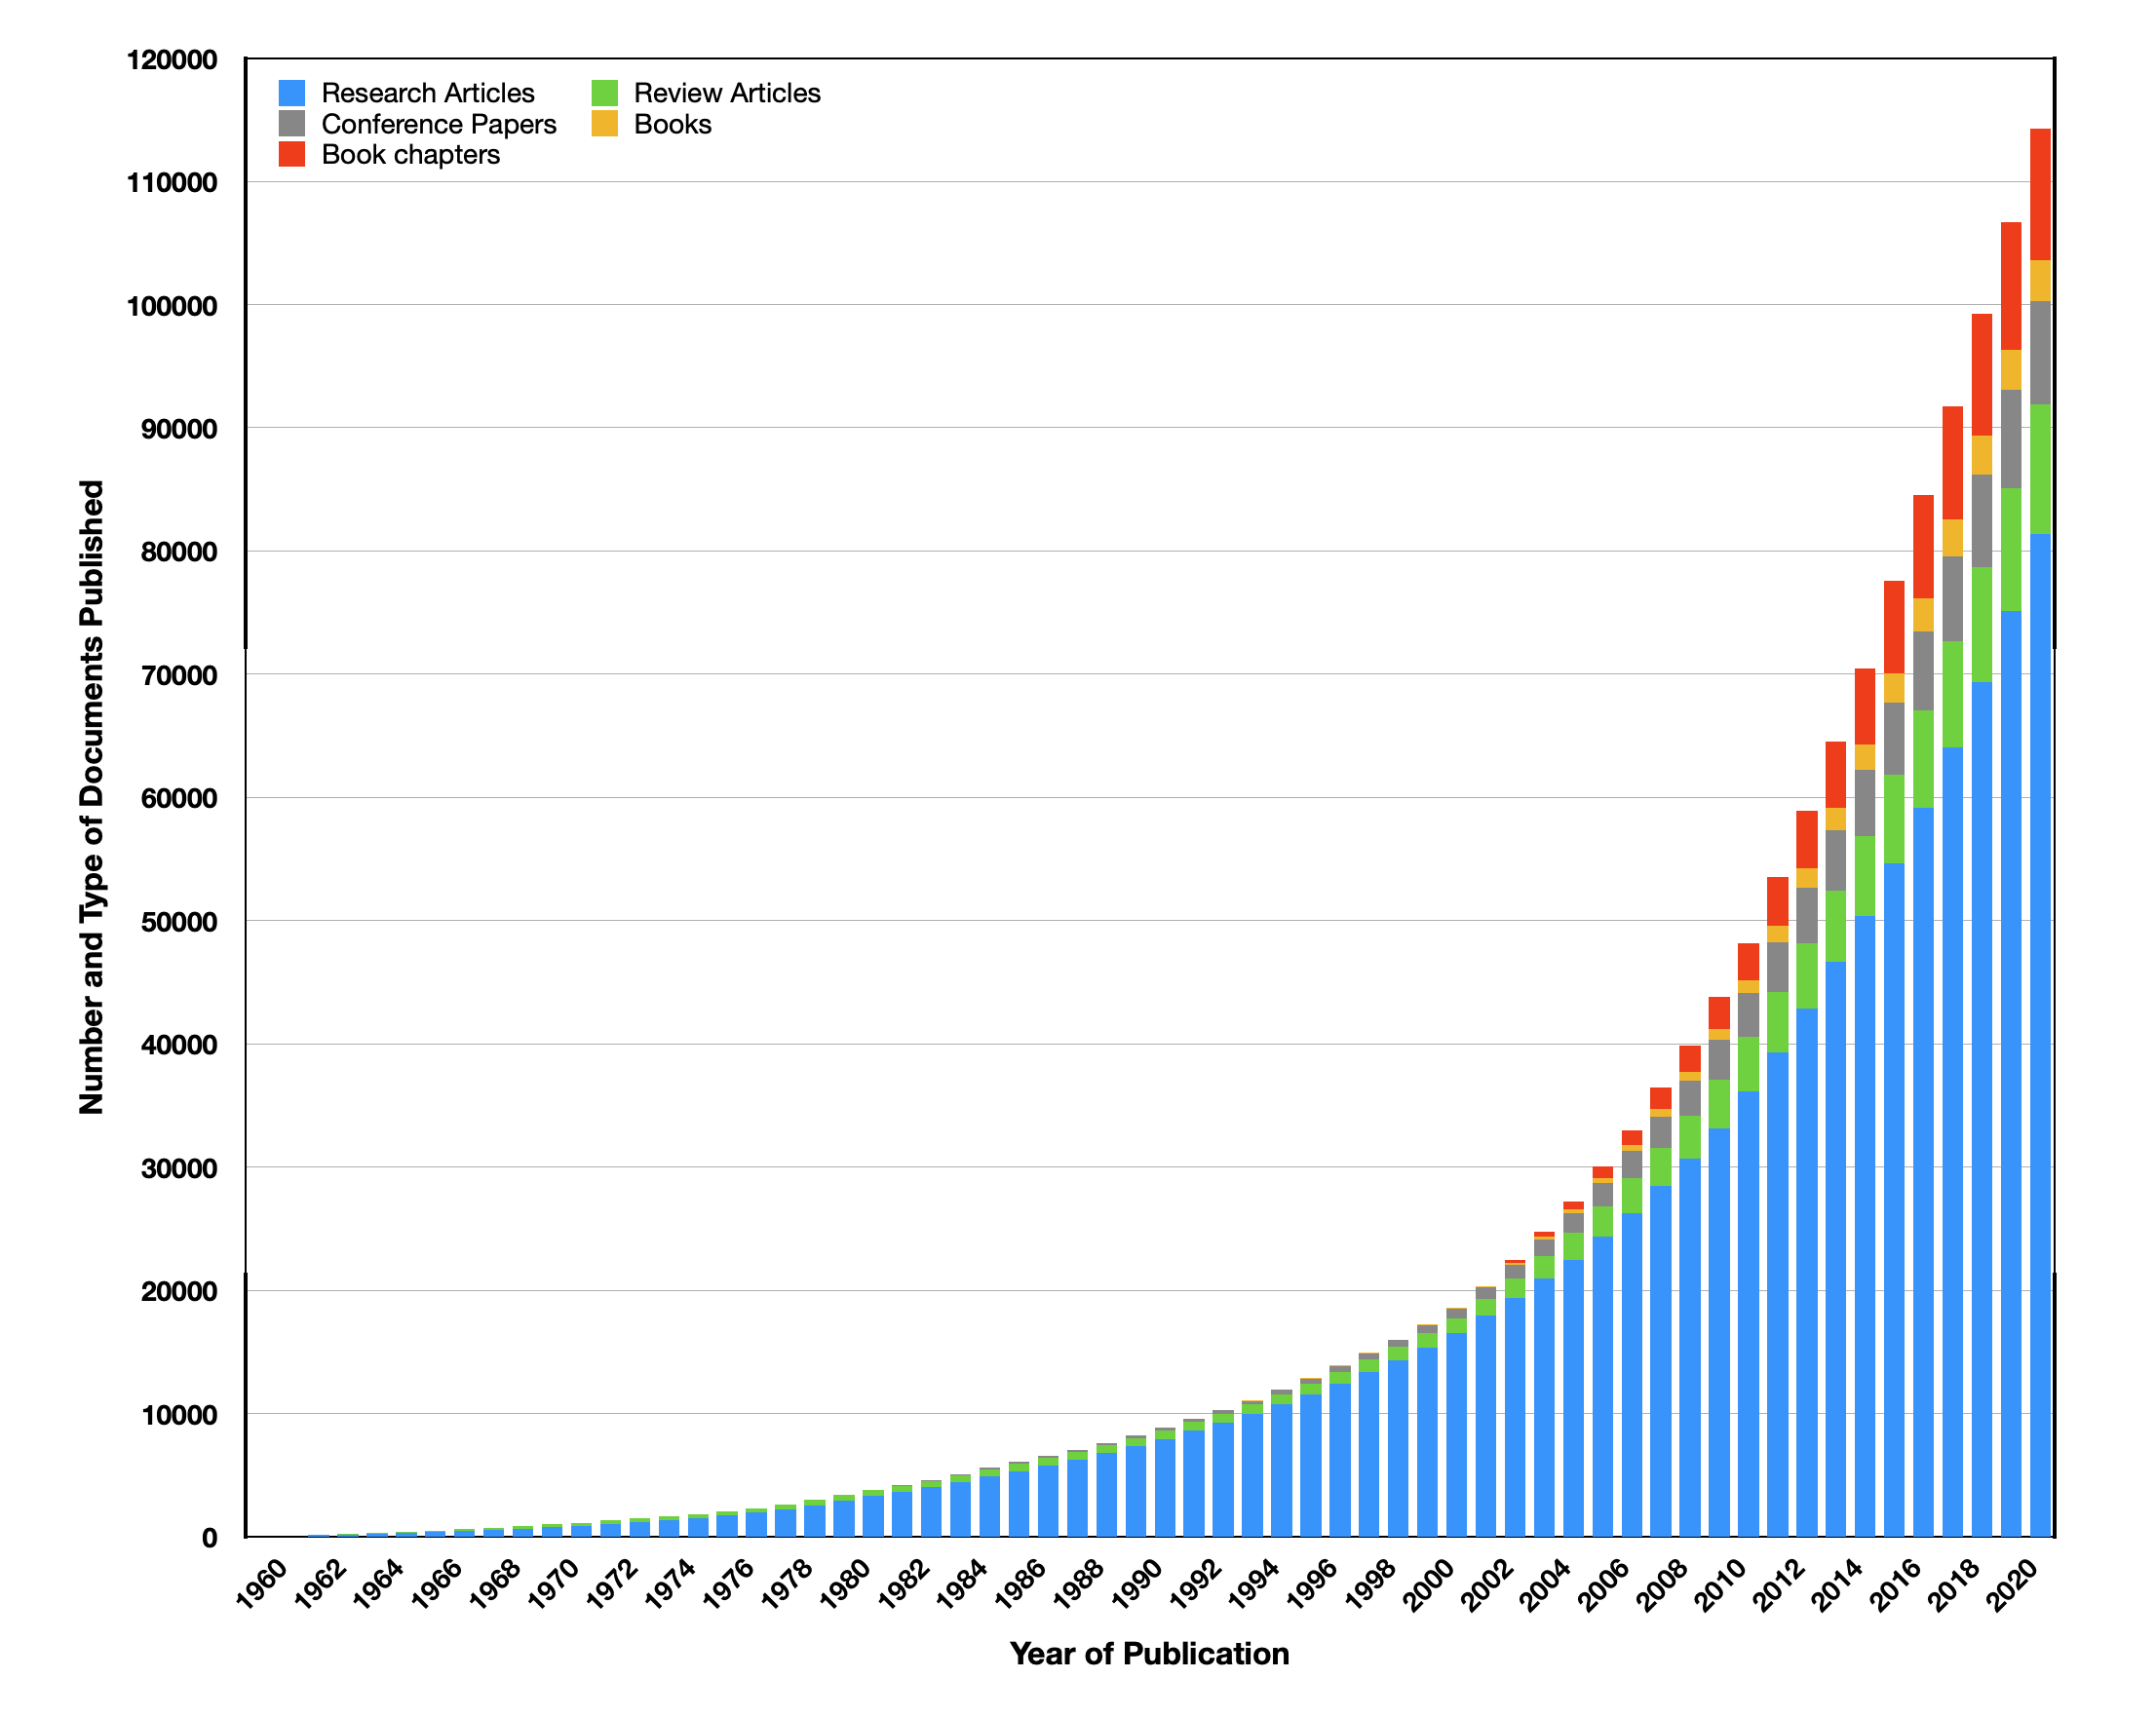
We can also compare the growth of archaeological research to that in other research fields. Published studies indicate that the growth rate of science, if measured using data extracted from bibliometric databases such as Scopus, necessarily underestimates the true rate of growth since these sources do not include all research documents published (Larsen and von Ins 2010; Bornmann and Mutz 2015). The most recent studies (Bornmann and Mutz 2015; Bornmann et al. 2021) examining research growth are based on the data of unique publications extracted from the lists of cited references in indexed publications and show that the yearly growth rate of science has varied over the years according to the type of scientific research conducted and by the place in which it happens. Variations in the annual rate of growth range from less than 3% to a maximum of 8.5% recorded for UK science between 1960 and 1980. Possible reasons proposed for the increase in research production include the increased productivity of individual authors, an increase in multi-author outputs, and the 'salami-slicing' of research outputs into the smallest elements viable for publication (Fanelli and Lariviere 2016; Bornmann and Daniel 2007). Examining the growth in archaeological outputs, we can see that the number of archaeological documents published since 2000 compared to the number that might be predicted for the various rates of growth of science observed in Bornmann et al.'s 2021 study (Figure 16), we see that archaeological research is growing at a higher rate than even the highest 8.5% per annum. This rate of growth might even be an underestimate since it is based on Scopus data. Further analysis would be beneficial to explore why this rate of growth appears to be so high in archaeology. Are there are geographic, research specialty and/or temporal dimensions to this increase of document numbers?
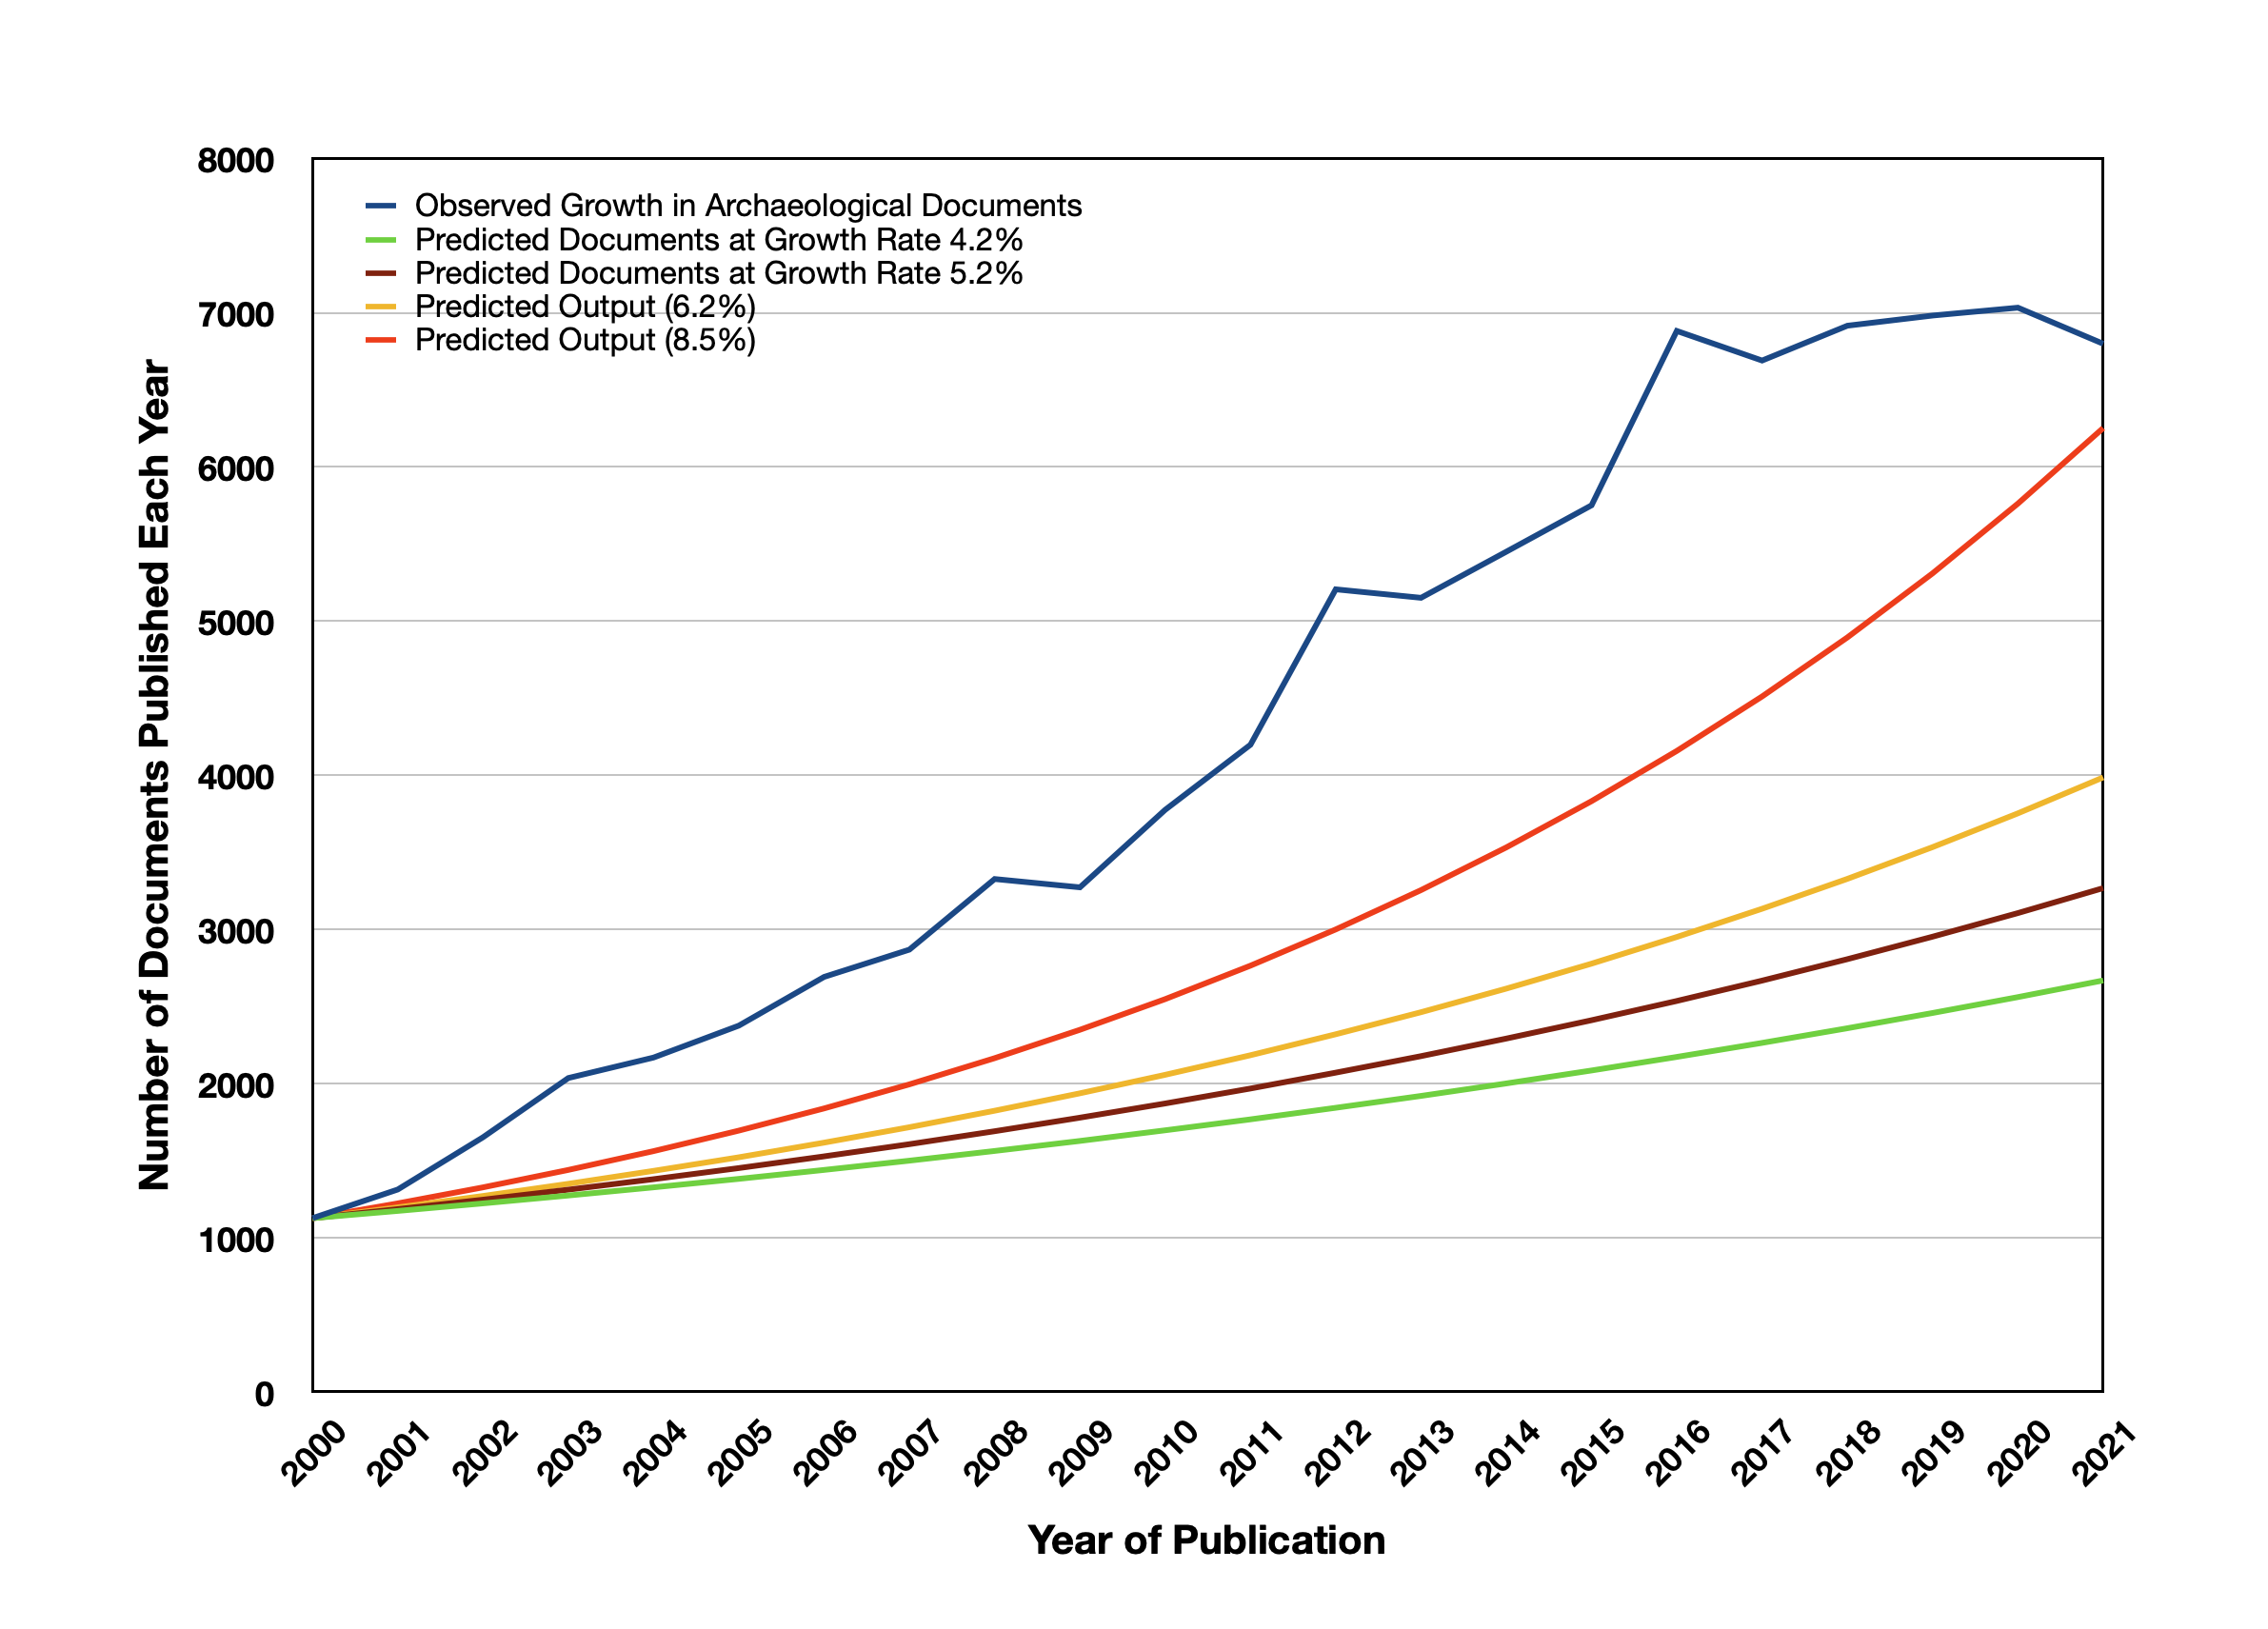
Lastly, the growth of research outputs has consequences for referencing practices, specifically how authors demonstrate a sufficient understanding of any research topic to persuade possible peer reviewers about the worth of their potential knowledge claim. The growth of research outputs increases the total population of research outputs available to cite, and we can see some impact from this in archaeology in terms of the change in the mean number of references cited per journal article. This has increased significantly. However, the rate of growth in the number of cited references is less than that for the number of documents (Figure 17), suggesting a process of selection at work. Making sense of this process of selection is not easy. Garfield proposed that in the natural and life sciences, once knowledge claims became accepted as truths, they were no longer cited to their source. He called this 'obliteration through incorporation' (Garfield 1975, 6) and saw it as a process that both reduced the number of citations made to the older literature and increased the proportion of citations to more recent outputs. Another well-known, scientometric concept, the 'half-life' of research – defined as the period of years prior to the publication date of a document(s) during which more than 50% of the cited references were published – identifies another process of reduction in cited references. The determination of a half-life in research is usually applied to journals as a measure for characterising the degree to which research fields are driven by the most recently published research.
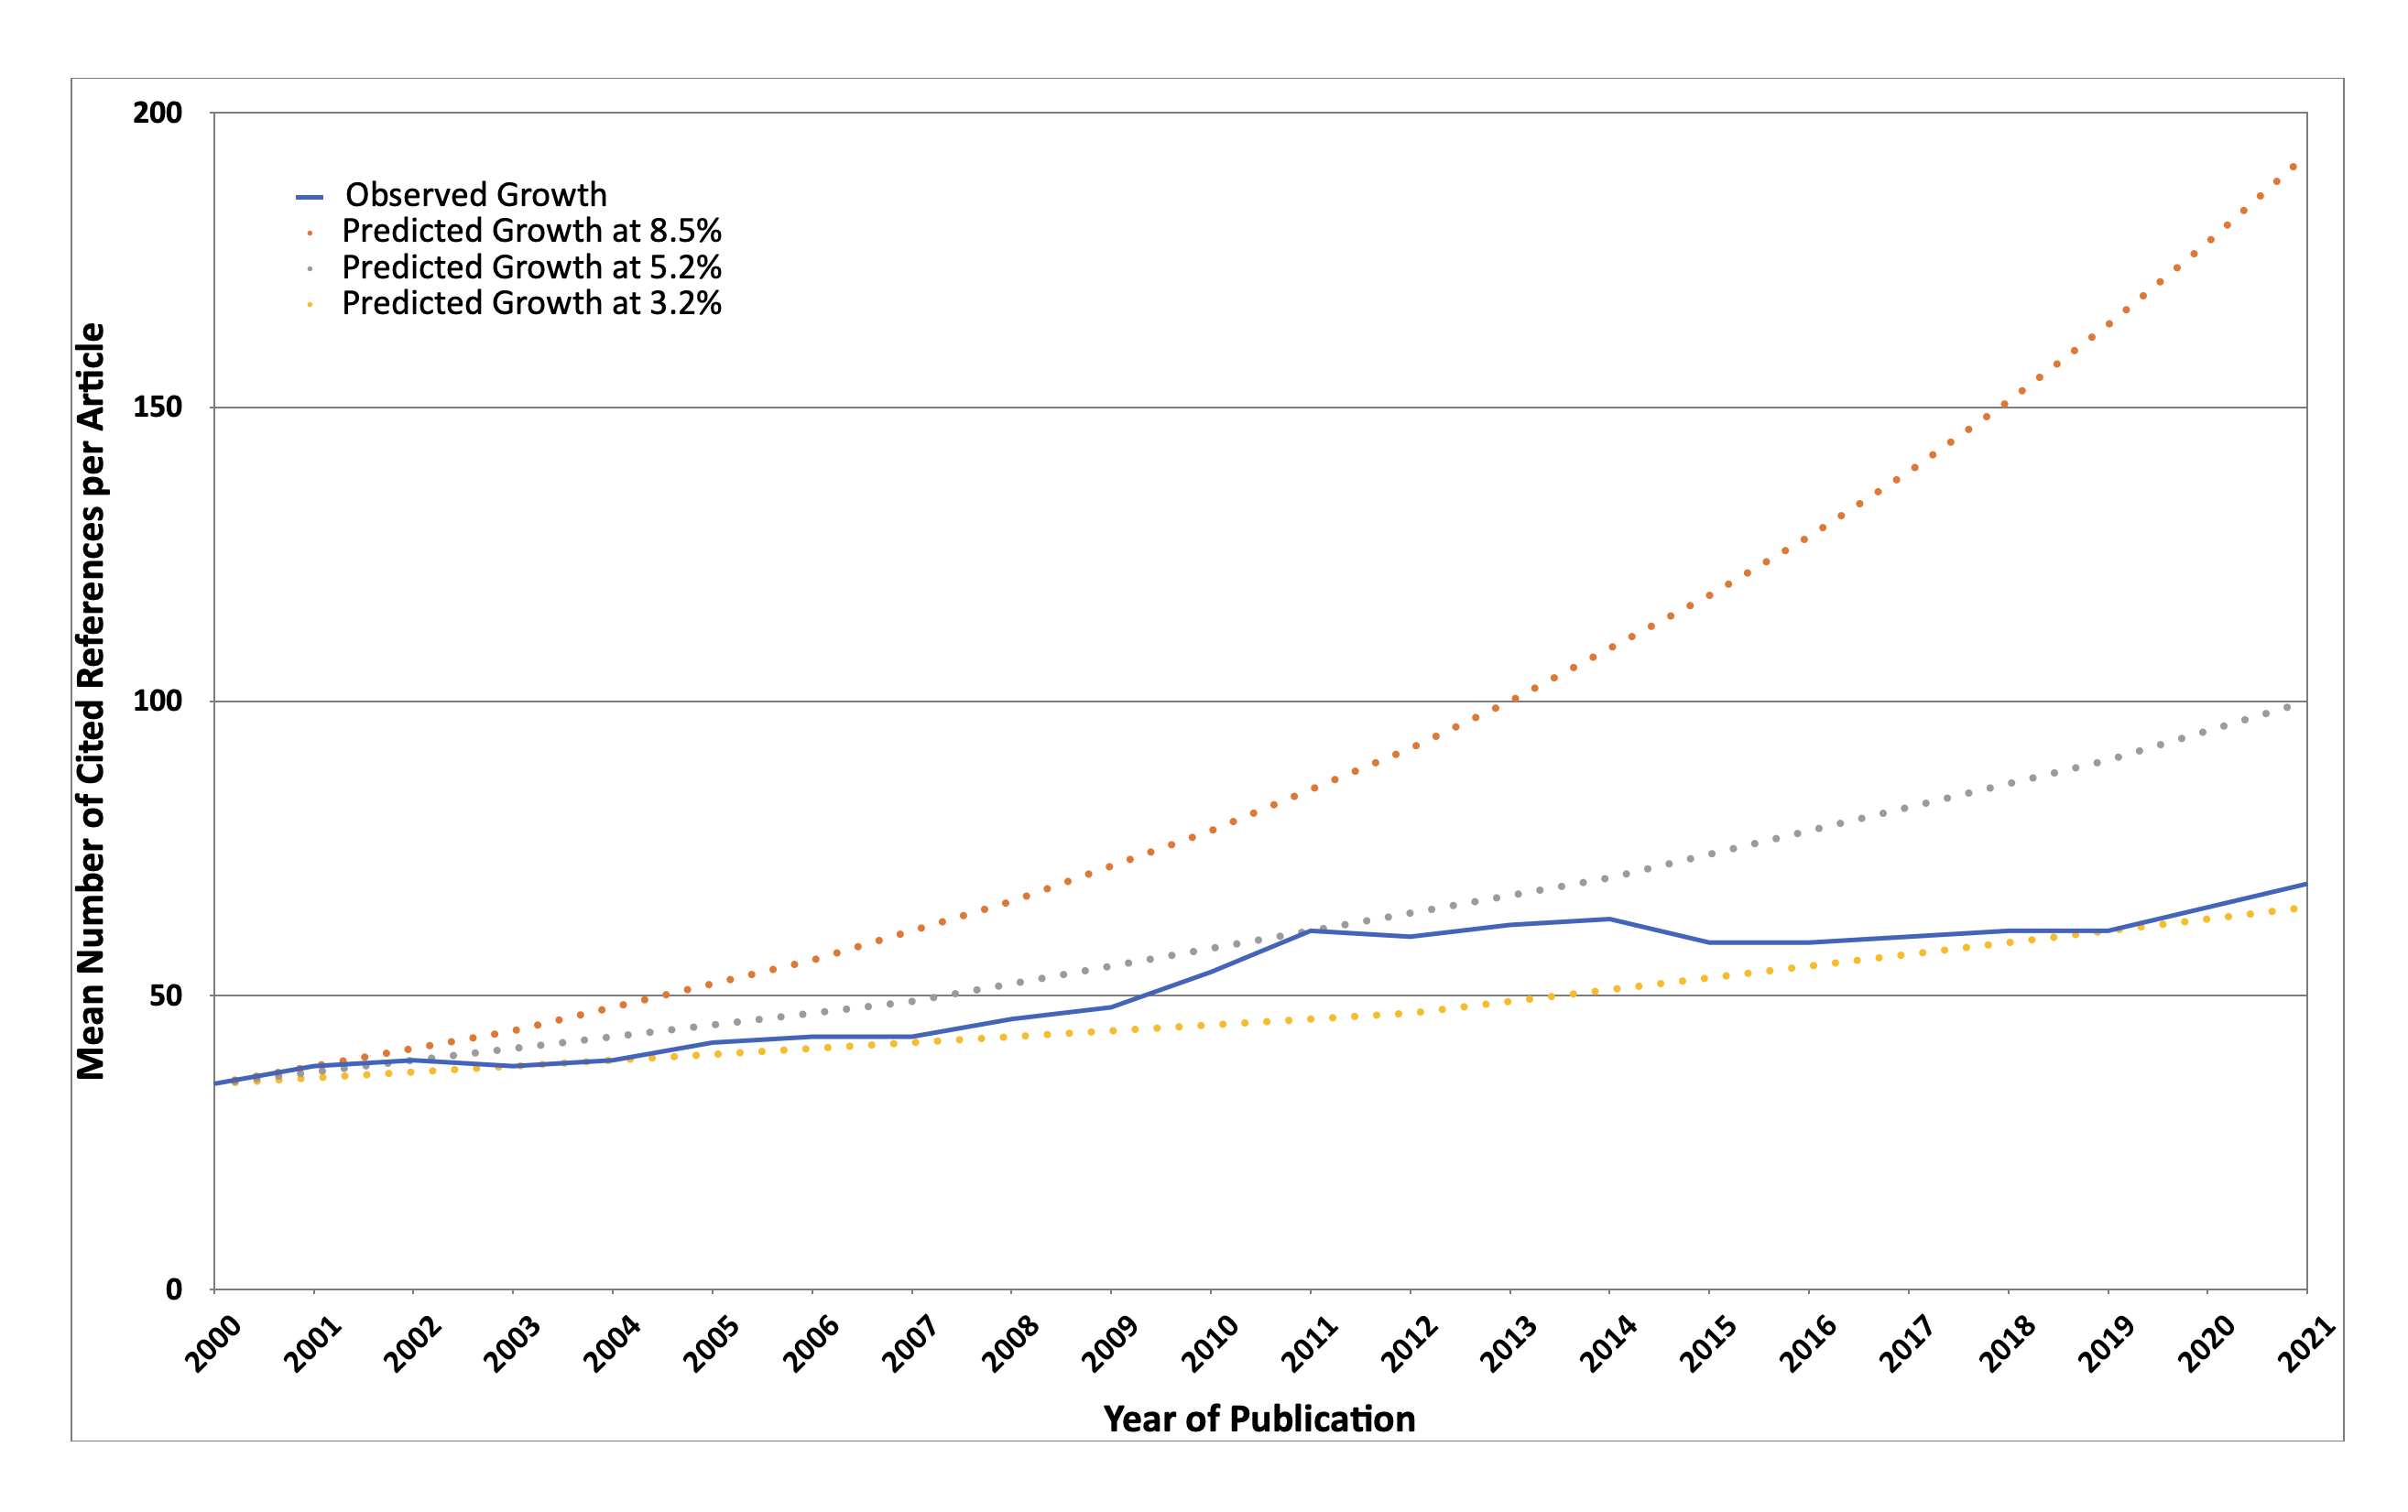
As disciplines vary in the proportions of document types they generate as research outputs, they also vary in their citation of the corpus of available literature. The nature of citation in the arts, humanities and social sciences is different from the sciences, with researchers extensively citing both the current literature but also many older documents. Where research examines texts as the observed evidence, many of these older cited references can be explained as the evidencing of primary evidence. Some older citations in archaeology may be of this type along with some citations of older research outputs that, while not texts, are also primary evidence in the form of original data such as dates or key finds. There is, however, evidence in the science maps that archaeologists continue to cite older conceptual literature, as illustrated by the high level of citation to archaeological outputs published by scholars who are either no longer active or might even be deceased. The most notable example of this is Lewis Binford (1931-2011) who remains the third most cited author during 2014-2021, despite his last publications appearing in 2002 (for the record, there is a posthumous correction note with Binford as second author published in 2018). Binford's most cited work is a 1980 paper (Binford 1980), that is cited many times more now, 40 years after publication, that in its first 10 years of existence (195 citations 2020-2022 versus 111 citations 1980-1990). The argument of this paper, proposing an essential difference between a forager settlement system versus that of a logistic-collector settlement system among hunter gatherers, is now surely such an established part of hunter-gatherer research that it might be 'obliterated' without loss of recognition for Binford as the original proponent. The continued citation of such documents highlights the complex nature by which certain knowledge claims and their authors pass into the established scholarly canon (in the sense proposed by McElhinney et al. 2003) of archaeological research.
In the earlier study (Sinclair 2016, 7.2) it was shown that men were more frequently represented among the most highly cited authors than women, but if examined at the level of intra-discipline, research specialties (identified by a science map of author co-citation clusters), there were significant differences in the presence (or absence) of women as highly cited researchers (Sinclair 2016). With a more recent set of data, it makes sense to see whether this has changed and if this reveals anything about the development of the discipline. It is important to remember that here we are looking at the differential representation of women and men as highly cited researchers using metadata derived from Scopus, with the inevitable exclusions that derive from the strategic choices made for the indexing of certain documents and not others. In 2022, we must also recognise that distinguishing between men and women is a limited view of the relationship between citation and individual identity: it does not cover intersectional aspects of identity such as ethnicity or sexuality or class. However, the acquisition of this limited set of data, described below, highlights the difficulty both at a practical and potentially ethical level of attempting to incorporate a greater range of data to analyse further dimensions of individual identity at a discipline-wide scale. A recent study (Heath-Stout 2020) has, however, looked at more diverse aspects of individual identity among authors publishing research within a set of 20 archaeological journals for the period 2007-2016. Finally, it is worth noting that science maps do not explain differential patters of citation, but they can reveal relative differences across subject areas that merit further investigation using other data and other analytical approaches.
When distinguishing between male and female authors, the major difficulty lies in the lack of detail provided in the lists of cited references. These lists usually provide just the family name of an author and their initial(s) from which one must identify the full name. There is no automated process for this and as a result sample sizes used in such studies are generally small. In this study, once again, it has only been possible to look at a sample of authors within any identified cluster. Here I have arranged authors by decreasing number of citations and then considered the 10% and 20% of authors with the highest citations, both for the population of authors at a discipline level and also at the level of the smaller research specialties identifiable as co-citation clusters for both 2004-13 and for 2014-2021. For the record, author citations are based on fractional counting to eliminate the impact of citation of multi-author documents (see 'Visualising the Bibliometric Data'). However, self-citations are not removed, although an earlier study (Hutson 2006) has shown that, in a sample of archaeology journals, self-citation does not vary by gender, but by seniority. For authors within the identified sample groups, Google searches were undertaken where necessary to locate first names or to locate and access original papers with full names or to locate staff profiles on institutional websites (as used in other studies e.g. Prozesky and Boshoff 2012; Williams et al. 2015). In the small number of cases where multiple possibilities still existed, searches were refined to locate individuals with the same name and initials publishing work in the same research specialty as that identified by the cluster. For a small number of authors whose primary research area is not archaeology (some geomorphologists, specialists in scientific methods used by archaeologists, etc.) searches were refined to identify individuals collaborating as co-authors with archaeologists grouped in the same research field as identified by the co-citation cluster. Approximately 700 authors have been identified in this way for the period 2004 to 2021.
The map of co-cited authors for 2014-2021 shows 2000 individuals grouped into 16 clusters (Figure 3). These 2000 individuals are well-cited individuals in their own right, representing a small sample of the total number of cited authors of archaeological research outputs. Every author has received more than 130 citations during the period. When arranged by decreasing number of citations received, there are 37 women among the top 200 individuals (10%) and 89 women among the top 400 individuals (20%), representing 19% and 22% of the total respectively. In other words, men are approximately four times more common than women among the top 10% and 20% of cited authors. The most recent survey of the labour market in the UK (Aitchison et al. 2020) shows that this proportion is very different to the balance between men and women in UK archaeology as a whole (53%/47%), and a similar balance (53%/47%) has been published for the USA (zippia.com 2020). In Australia, the balance between women and men has most recently been reported at 58%/42% (Mate and Ulm 2021). While there is no official published breakdown by gender for archaeology, in the academic sector in the UK, this 53%/47% balance between men and women is in fact the same as academic staff UK Higher Education Institutions in general (HESA 2022). This is a bit less than recently reported for Australia at 60.5%/39.5% (Mate and Ulm 2021). However, if we assume that authors with high levels of citation are likely to have been promoted, a different starting point for comparison might be with the population of academic staff already promoted to 'professor' or 'other senior academic'. In the UK the balance between promoted academic staff then changes to 69% men and 31% women (HESA 2022), reflecting the historic and systemic issues related to equity in career progression for women in academia. This possibly provides a better starting point if we wish to explore relative differences related to the population of most cited archaeological authors as a whole and across research specialties. There is a body of research that has argued that the nature of academic communities differs by the nature of the research undertaken (Becher and Trowler 2001), and through the division of the archaeological research community into the research specialties we can identify whether there are differences related to the area of research that need explanation in more specific terms than those that might operate discipline- or academia-wide.
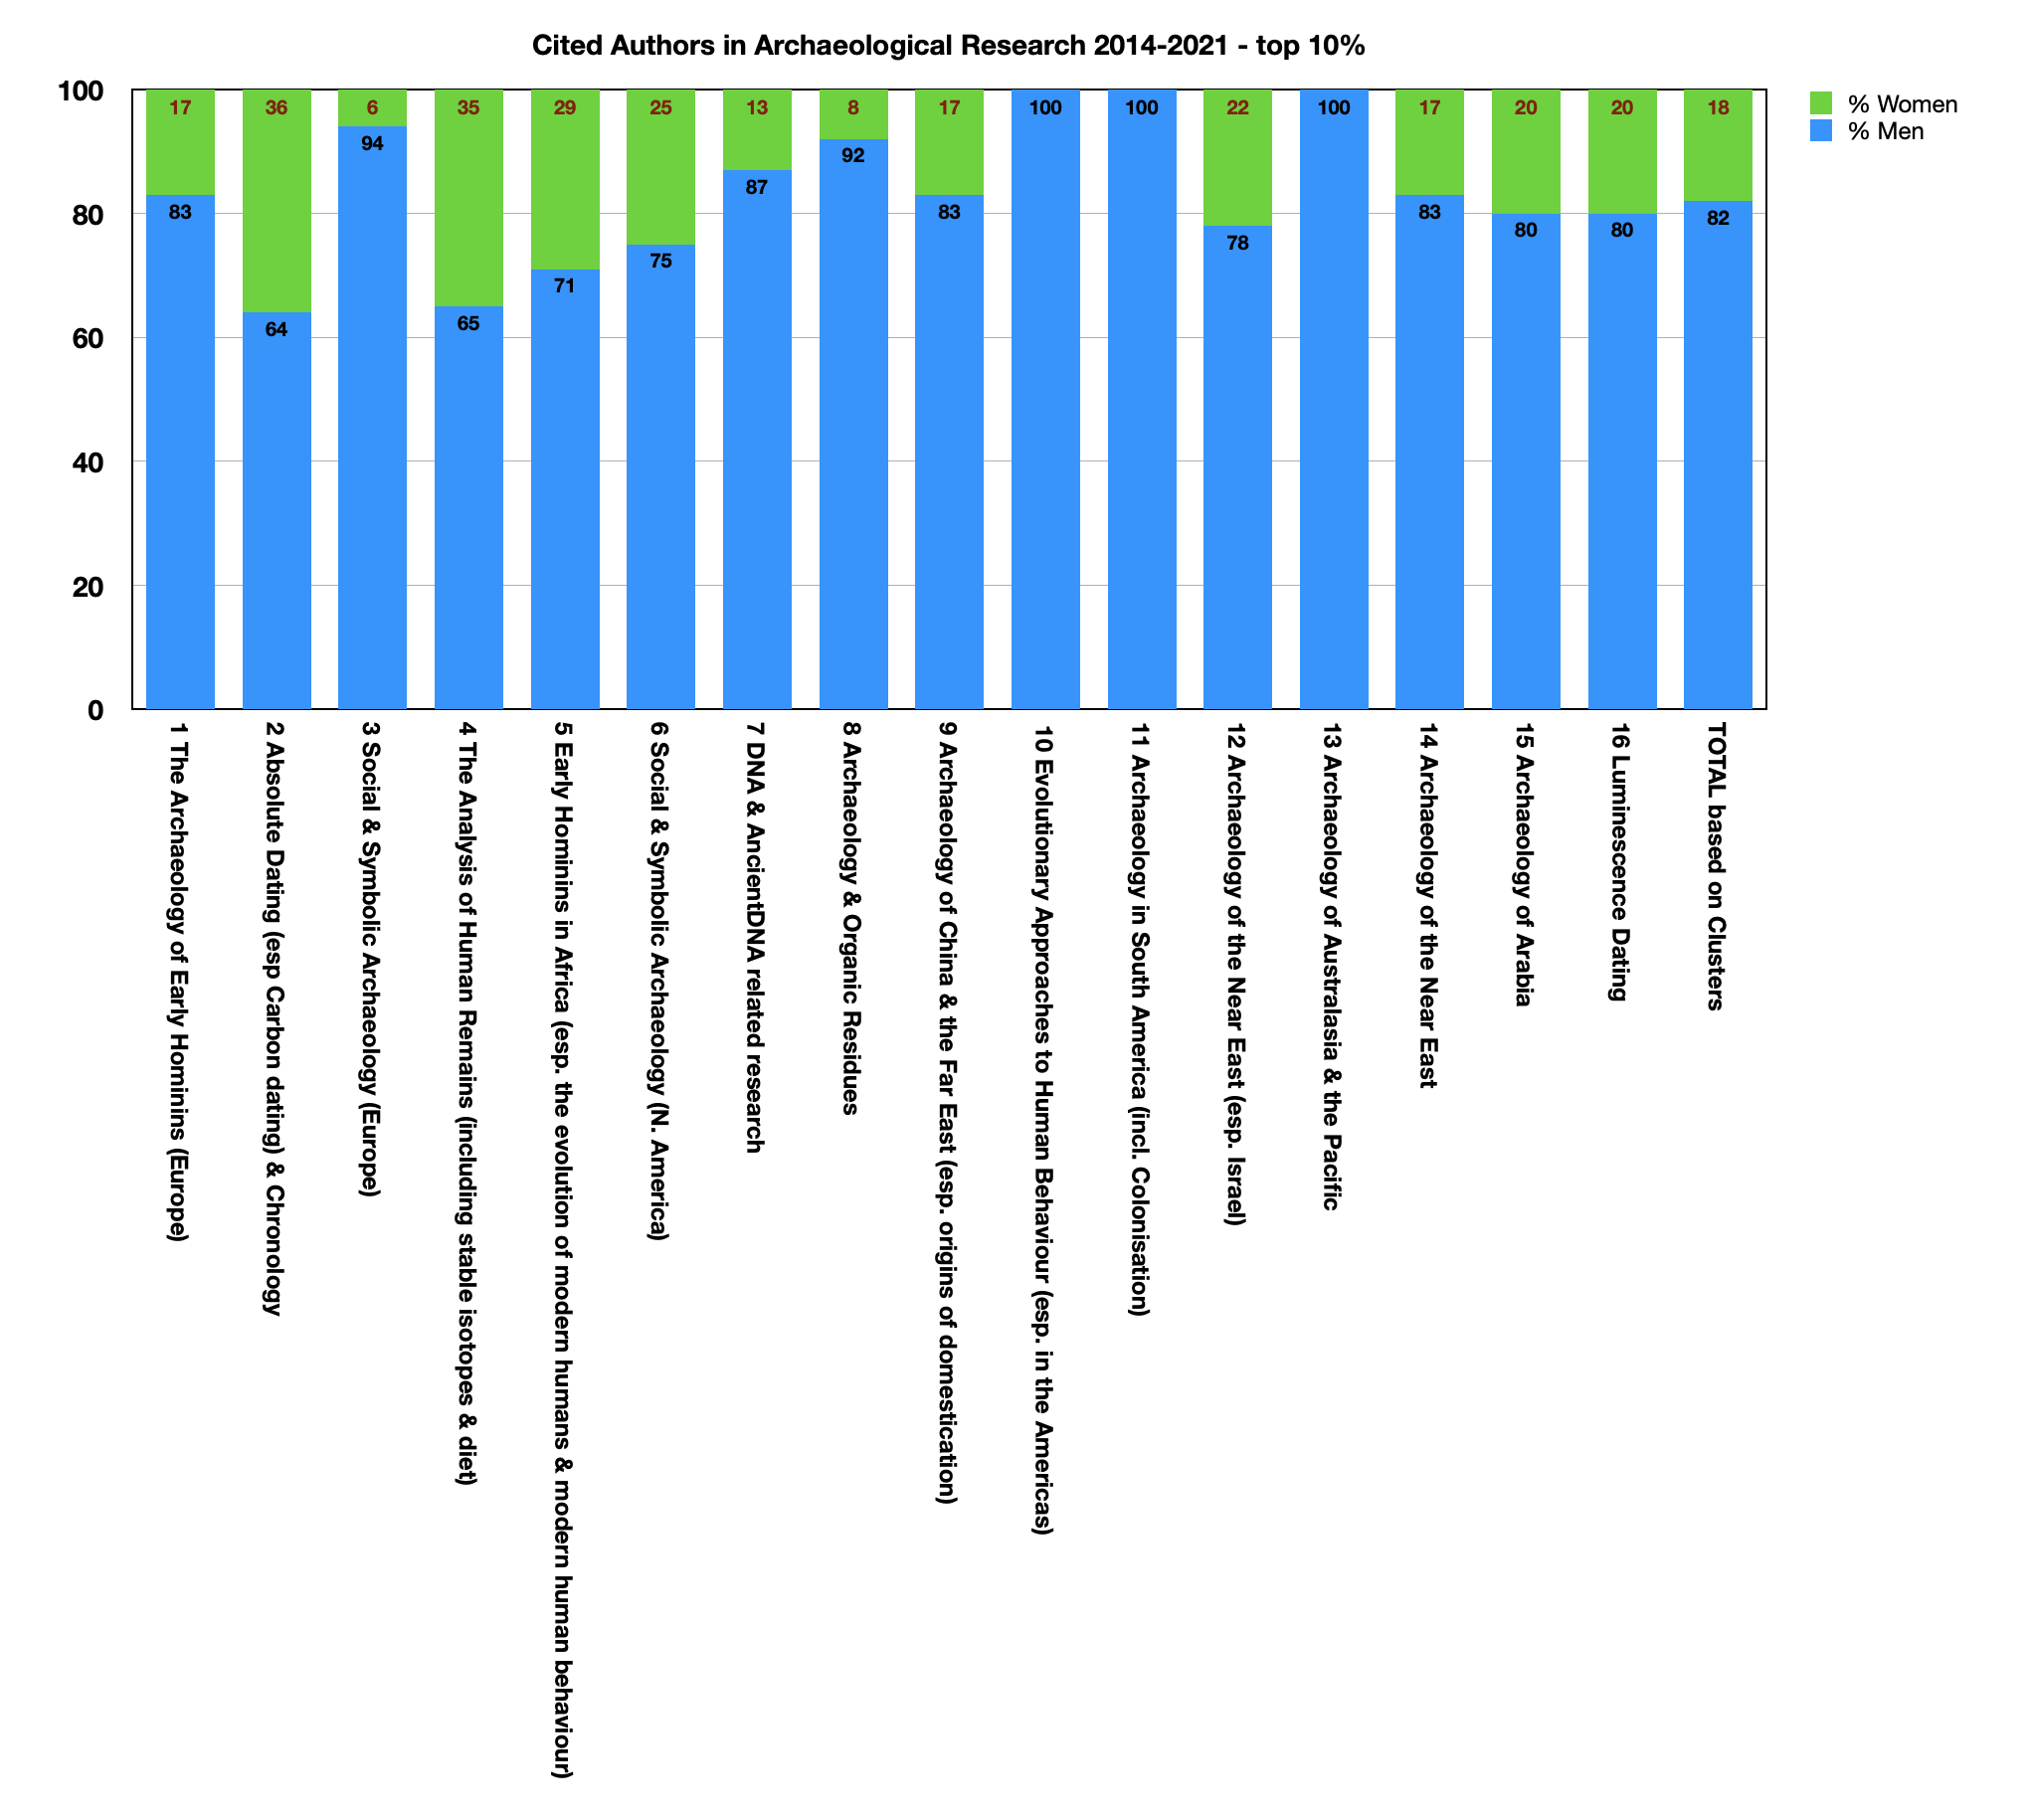

Starting from the science map of co-cited authors (Figure 3), identified clusters permit a subdivision into populations by their recognised specialty of archaeological research. For 2014-2021, authors were sorted by citation numbers as a whole for examining balance at a discipline level, and then by co-citation cluster and by decreasing number of citations within clusters to look at the balance within research specialties. This latter sorting results in a slightly different set of authors from that determined by citation number alone; all of the top 10% of most cited authors are still included, but there are now another 38 authors who are in the top 20% of cited authors in their specialty cluster but not among the original top 20% of cited authors across the discipline as a whole. When the most-cited authors are re-ordered by cluster, there are also clear differences in the balance of women and men between clusters, even if the mean balance remains approximately the same as per the discipline as a whole (Figure 18 and Figure 19). Most striking, perhaps, is that there are three research specialties identifiable as clusters where there are no women present in the top 10% of cited authors (clusters 10, 11, and 13) and two of these clusters (10, 11) have no women in the top 20%. There are also three clusters where the proportion of women is much lower than expected based on the total among the top 10% of cited authors (cluster 3 - 6%; cluster 7 - 13% and cluster 8 - 8%), and four clusters if we consider the top 20% of cited authors (cluster 3 – 14%, cluster 7 - 7%; cluster 13 - 11%; and cluster 14 - 8%). There are also clusters where the proportion of women is higher or much higher than expected based on the total among the top 10% of authors (cluster 2 - 36%; cluster 4 - 35%; cluster 5 - 29%; and cluster 6 - 25%) and four clusters at the 20% level (cluster 1 - 33%; cluster 4 - 38%; cluster 6 - 31%; and cluster 12 - 33%). For the earlier period (2004-2013), the proportion of women is lower still (Figure 20 and Figure 21). There are five clusters with no women among the 10% most cited authors (clusters 5, 7, 11, 13, and 14), and three clusters where the percentage of women is much lower than for the total (cluster 4 - 11%; cluster 6 - 7%; and cluster 8 - 8%). Among the top 20% of cited authors, there remains one cluster with no women represented (cluster 14), and five clusters with a much lower level of representation (cluster 5 - 7%; cluster 6 - 11%; cluster 7 - 4%; cluster 8 - 13%; and cluster 11 - 10%). Women are present at a higher level than might be expected in three clusters among the top 10% (cluster 12 - 38%, cluster 3 - 37% and cluster 2 - 27%), and in two clusters among the top 20% of cited authors (cluster 12 - 31%; cluster 3 - 26%).
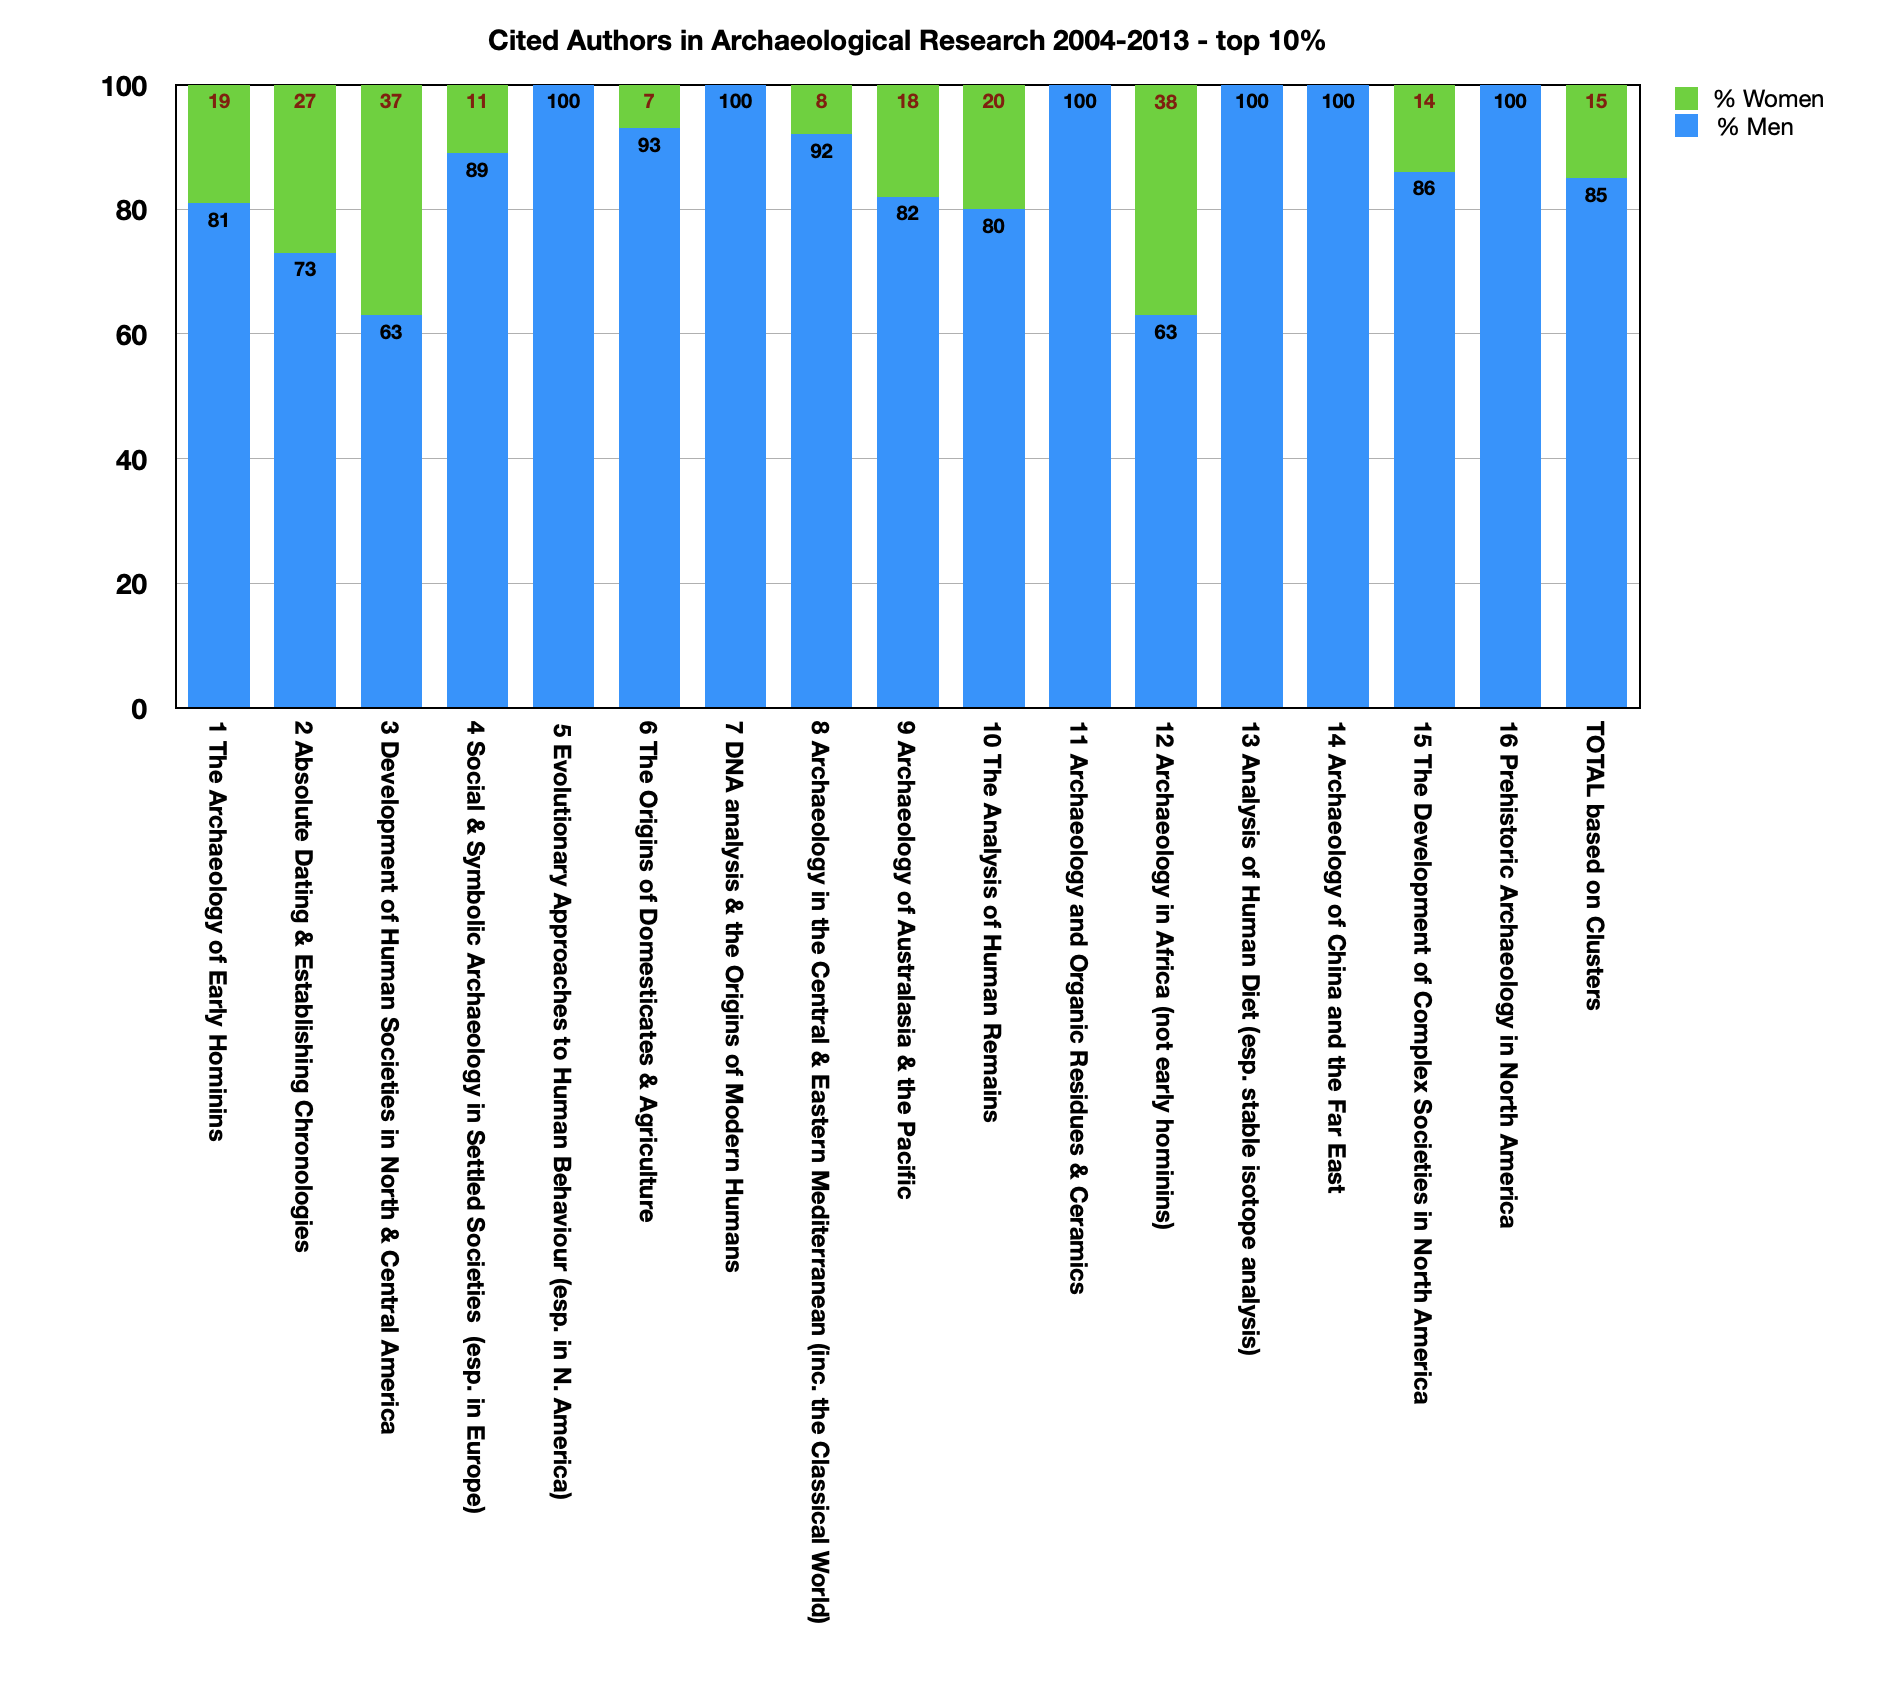

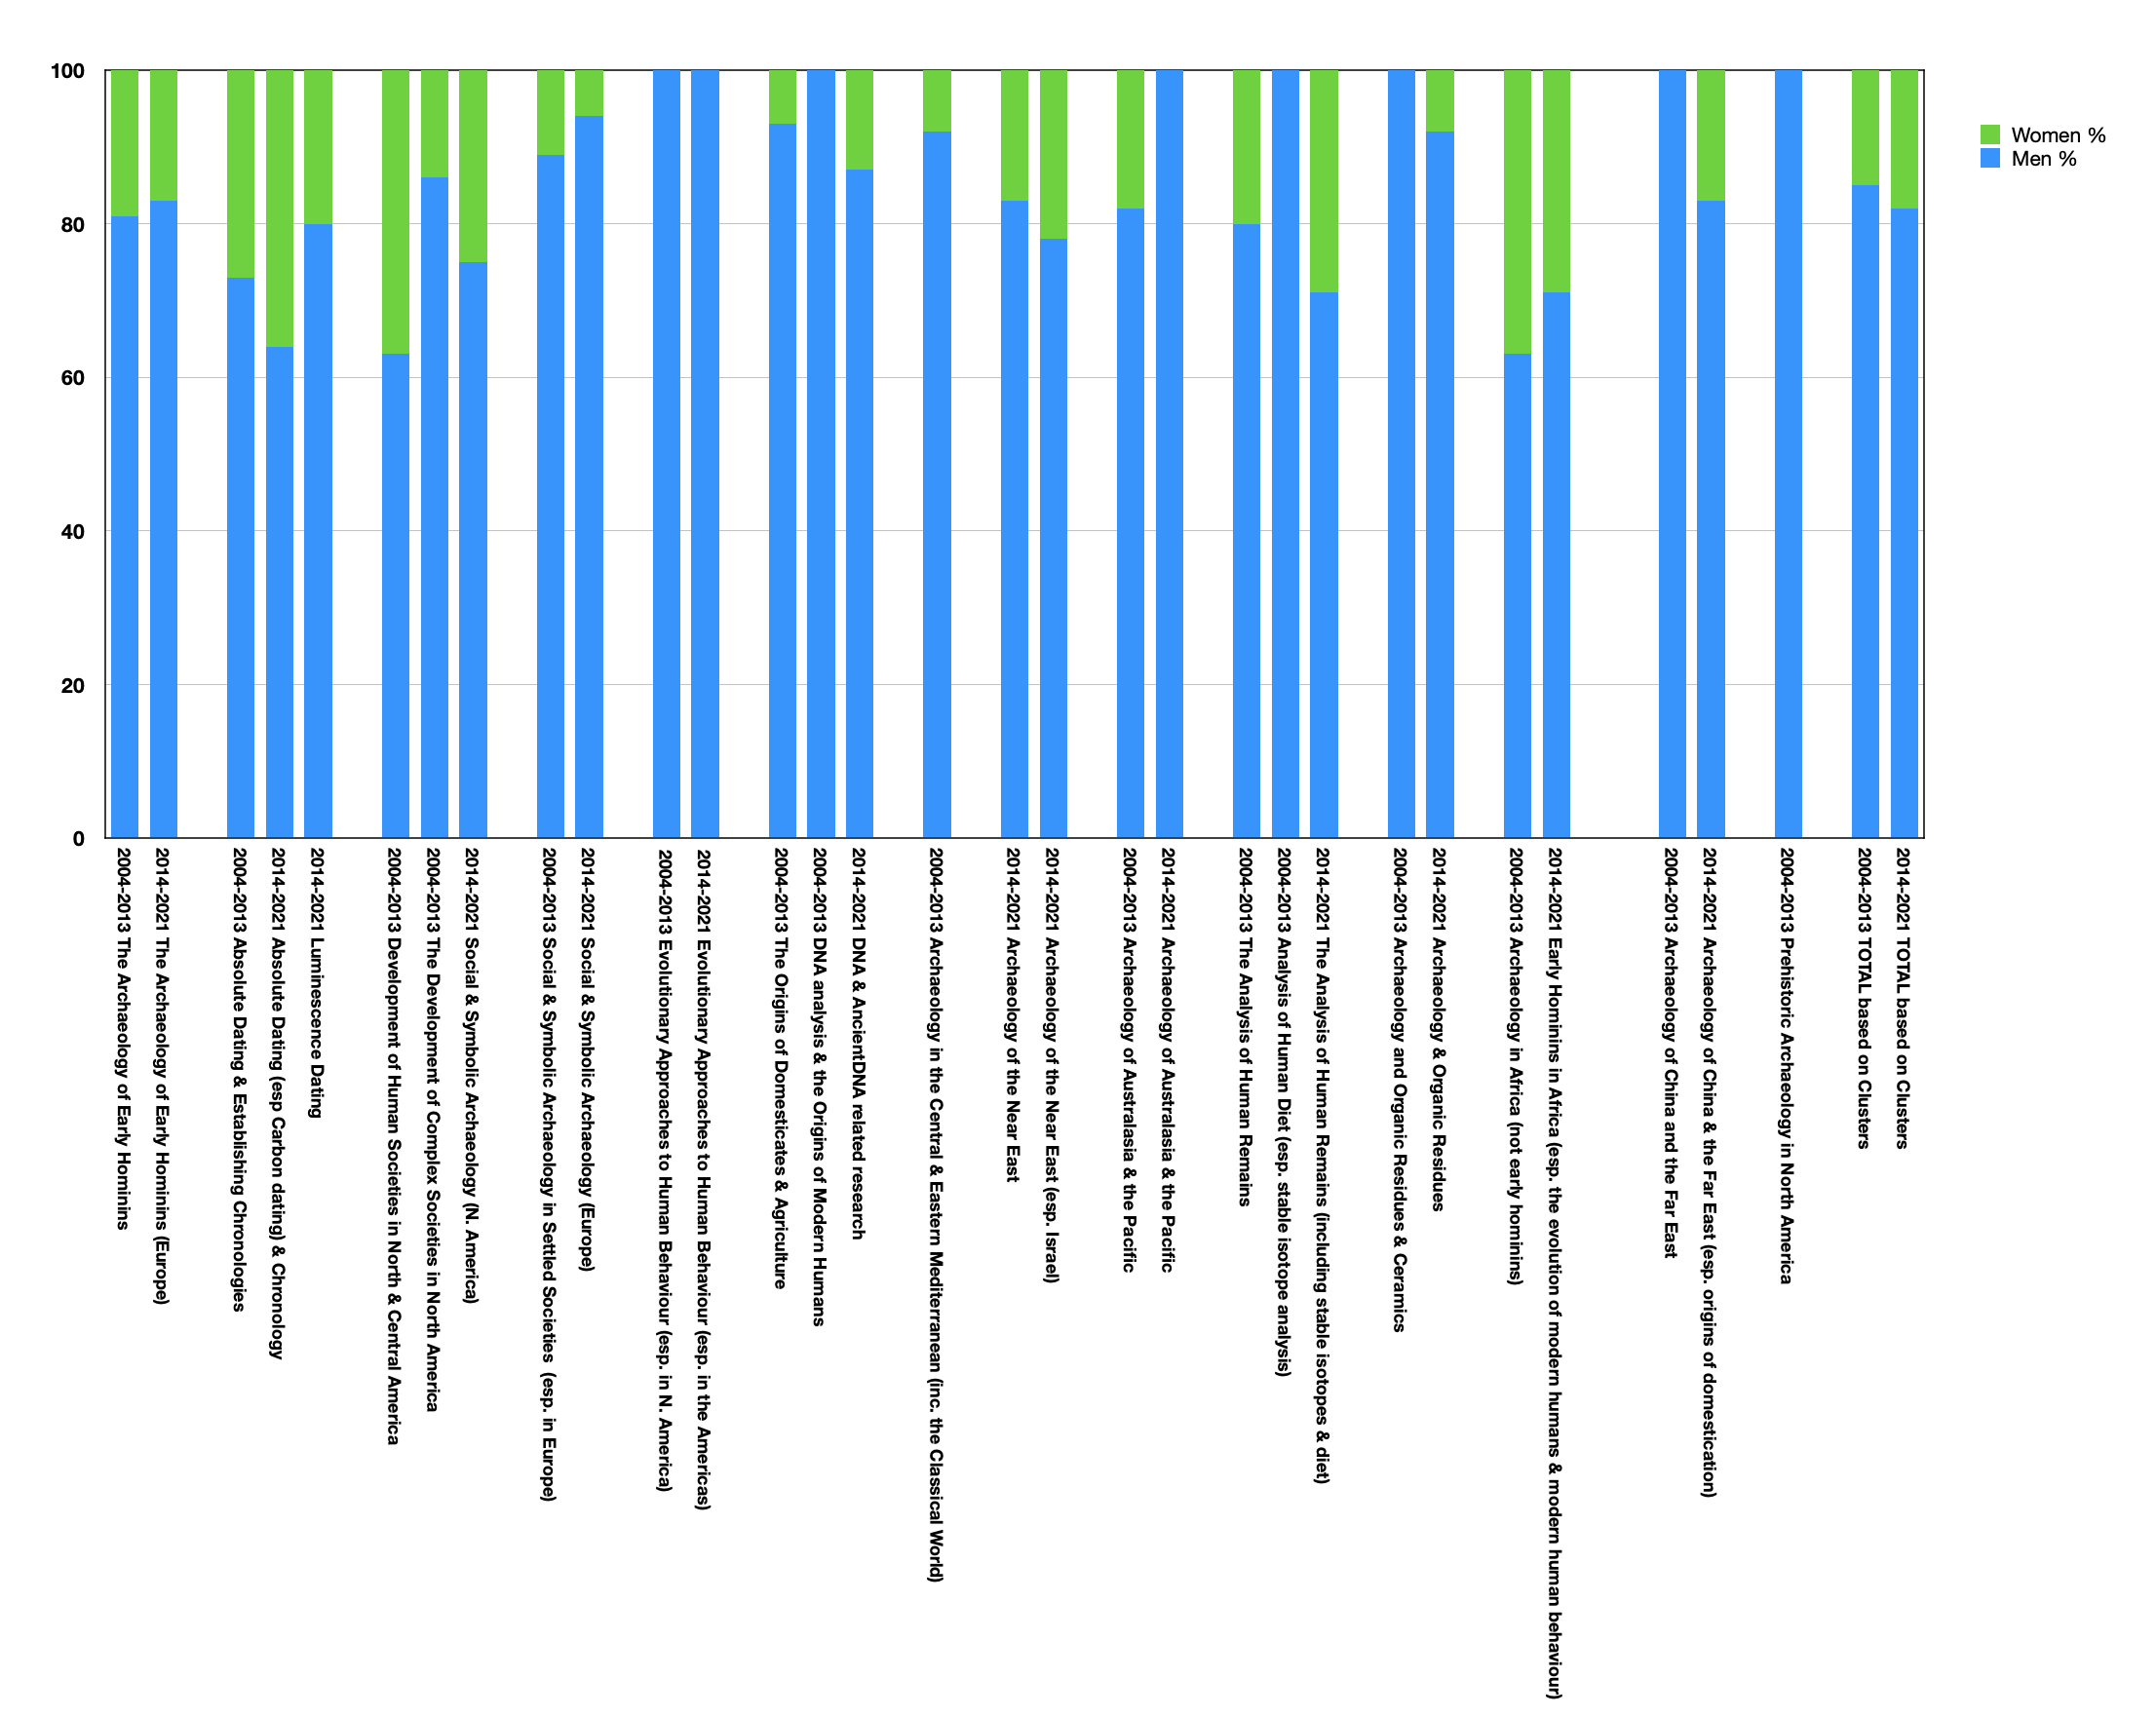
It is also possible to consider the proportions of women and men as highly cited authors from 2004 to 2021 in the discipline-wide population as well as by research specialty for cases where co-citation clusters identify common specialties across periods (Figure 22). While the aggregated population of authors by research specialty level shows less change than the total population there are a number of specialties where change is noticeable, usually in favour of women as highly cited authors, although sometimes not. For example, among the top 20% of cited authors undertaking research on the archaeology of early hominins, the proportion of women has almost doubled. The same level of growth can be seen among researchers considering human remains and dietary analysis based on stable isotopes. There has been growth in the proportion of women in the research area of organic residues at the 10% level, but less so among the top 20%, and the same is the case for researchers investigating DNA and ancient DNA. The proportion of women undertaking research related to absolute dating and the establishment of chronologies has increased at both 10% and 20% levels, while the individuals here, both women and men, are the most highly cited of all. There are three specialisms that are clearly regionally focused: China and the Far East, the Near East and Australasia and the Pacific. Archaeological research for the first two regions has seen a notable increase in the proportion of women among its most cited authors, but seemingly not yet for Australasia and the Pacific. Finally, there are three research specialties that are both regional and also theoretical in nature; authors most known for their publications on archaeological theory are to be found here. One specialism (2014-21 - cluster 10; 2004-13 - cluster 5) can be described as research taking an evolutionary approach to human behaviour, often with a focus on mobile societies, and here the research of women has disappeared from the top 20% of cited authors. The two other specialisms look at settled societies in Europe more broadly and in North America, with a theoretical approach that might be generally described as interpretive in the broader sense. In North American-focused research the proportion of highly cited women has almost doubled, in Europe it has remained static.
What might explain these differences? Much writing since the 1980s (see Moen 2019 for a recent review) has explored issues related to gender and archaeology; Scopus alone identifies 809 research outputs using a search for 'archaeology' AND 'gender' published from 1980 to 2021. Among this work, there is a body of research with a focus on equity issues concerned with employment, promotion, acceptance for publication, applications for and success in gaining research grants and so forth (i.e. Bardolph 2018; Geller 2016; Goldstein et al. 2018; Speakman et al. 2018), along with research that explores the impact of structural factors on the nature of publication (type, place and rank of publication venue) and the differential nature of citation and journal language (Beck et al. 2021; De Leiuen 2015; Fulkerson and Tushingham 2019; Heath-Stout 2020; Hutson 2002; 2006; Tushingham et al. 2017). These observations resonate with broader structural issues to do with visibility, public profile and power in academic life and the effect of life events upon possible career trajectories, and most, if not all, of these factors are likely to be at work in archaeology as an example of an academic discipline. The science maps suggest that these factors play out differently in relation to particular specialties.
When first considering this issue for the period 2004-2013, it was suggested that earlier observations on the diversity of researchers engaged in fieldwork and in laboratory research might explain the differences between research specialties (Sinclair 2016 following Gero 1988 and Moser 2007). With the benefit of another period of data, and the chance to follow similar research specialisms through time or to contrast similar types of research specialism, the situation has become more complex. For example, not all fields of archaeological science show the same degree of representation of women among the most highly cited researchers; certain types of theoretical approach seem almost out of bounds to women, or certainly different when practised on either side of the Atlantic. Why has archaeological research related to early hominins in Europe become more gender diverse compared to the study of Palaeoindians in North America when they are seemingly both concerned with understanding mobile societies and the analysis of lithic and faunal collections? The lack of diversity in Palaeoindian research was noted long ago (Gero 1993), but the problem remains. Looking at another research specialty, why is theoretical archaeology in prehistoric Europe less diverse than in North America? In both cases, the analysis of social developments in terms of diversity, power and identity is a significant aspect of their research. Within the broader field of archaeological science, not all laboratory-based research has become as diverse as that related to the study of diet using stable isotopes, and at an even more detailed level, many of the most cited women researchers clustered across research specialties identify their research focus as archaeobotany and anthracology. There is also a longer temporal dimension to be considered and this is most obvious when noting the presence of authors who did not publish any research outputs in this period yet who remain among the most-cited today (for example, Binford, L.R., Childe, V.G., Clarke, D.L., Bordes, F.) The work of these authors has followed a particular life history as a knowledge claim (Cozzens 1988). From an initial claim to know something about a specific issue when first published, the research outputs of some of these highly cited authors have become part of the established scholarly canon of knowledge for a specialty perhaps in terms of the acceptance of the data or interpretation presented, or perhaps as a form of 'concept symbol' (Small 1978), whose citation indicates a type of approach more generally. The nature of diversity at a discipline- and research-specialty level in this grouping would be worth examining with a longer-term dataset.
Science mapping adds a further dimension to existing research examining diversity and representation in archaeological research. From a starting point that women are unrepresented as highly cited researchers compared to the proportions of men and women as senior academic staff, science maps reveal the existence of clear and significant variations in male/female representation by research specialty. Further explanation(s) is now needed that considers not just the structural issues of academic work, or issues related to the discipline of archaeology, but also ones that address issues related to research and publishing in particular regions and types of approach. We must also consider the nature of knowledge claims (epistemological and ontological) within a particular archaeological specialty and how such claims progress into the canon of accepted knowledge. These explanations will need to look at the impact of specific career trajectories and the influence of role models or mentors within particular areas of research.
Archaeology has remained a stable subject category since the first citation index, and yet, as noted above (Section 3.2), the major bibliometric databases identify fewer than half of the documents that can be identified as archaeology. This is because of the multi-disciplinary nature of archaeological research that leads archaeologists to publish their work across a wide range of source titles, only some of which are categorised as archaeological by Scopus and others. The science maps of terms provide an opportunity to investigate the disparity between the external categorisation of archaeology as a research type(s), and its internal categorisation by archaeologists themselves. We can begin by comparing the types of archaeology categorised by WoS, Scopus and Dimensions with the types recognised by archaeological researchers themselves as evidenced in their choice of author keywords and through NLP-extracted terms (Table 12). WoS recognises 254 separate subject categories, just one of which is 'archaeology'. Scopus recognises 313 different subject categories, within which there are two subject categories for archaeology: 'Archaeology (Arts and Humanities)' and 'Archaeology (Science)'. Subject categorisation in Dimensions is more complex. It claims to categorise individual documents by artificial intelligence to multiple Fields of Research based on the Australia and New Zealand Standard Research Classification (Dimensions 2021). In this scheme there is a broad grouping, 'History, Heritage and Archaeology', within which are ten Fields of Research with Archaeology in their name including two 'catch-all' fields ('Archaeology not classified elsewhere' and 'Other History, Heritage and Archaeology not classified elsewhere'). Terms maps reveal, as one would expect, that archaeologists themselves have a more detailed and nuanced vocabulary by which to describe their discipline. Between 2004 and 2021 archaeologists have used at least 74 different one- or two-word noun phrases to describe the type of archaeological research they are doing. While some of these descriptive terms are variations on the same theme but for different geographic communities ('Rescue Archaeology'/'Salvage Archaeology', or 'Funerary Archaeology'/'Mortuary Archaeology'), the majority exist to recognise different communities of practice focusing on specific questions or data distinguished by time, place or method. For example, there are types of archaeology that are period specific (i.e. 'Historical Archaeology' or 'Roman Archaeology'), and geographically specific (i.e. 'Amazonian Archaeology'), types that are place specific (i.e. 'Urban Archaeology' and 'Maritime Archaeology'), types that are related to the use of scientific techniques or approaches (i.e. 'Bioarchaeology' or 'Geoarchaeology') and types that are about a form of approach to the archaeological evidence (i.e. 'Social Archaeology', Mortuary Archaeology' and 'Gender Archaeology') and the professional world (i.e. 'Contract Archaeology', Salvage Archaeology'). The limited use of subject labels through which archaeology is identified by others fundamentally oversimplifies the nature of the research that archaeologists are engaged in, and perhaps help to explain some of the issues involved in managing and supporting a discipline that has grown so much beyond its original roots in the arts and humanities or even the social sciences. The maps of the language of archaeology raise the question as to whether archaeology might benefit from a more diverse set of specialty names that will recognise as distinct the skills and knowledge of different research specialisms.
| Web of Science | Scopus | Dimensions | Types of Archaeology Recognised in Author Keyword Lists and Lists of NLP-Extracted from Titles & Abstracts of Archaeological Research Outputs (2004 - 2021) | |||||||
|---|---|---|---|---|---|---|---|---|---|---|
| 'History, Heritage and Archaeology' | Period-Specific Archaeologies | Geographically-Specific Archaeologies* | Approaches to Archaeology | Archaeological Sciences | Archaeology of 'Places' | Archaeology Beyond Academia | Not Archaeology | |||
| Archaeology | Archaeology (Arts & Humanities) | Archaeological science | Classical Archaeology | African Archaeology | Cognitive Archaeology | Bioarchaeology | Aerial Archaeology | Commercial Archaeology | Galactic Archaeology | |
| Archaeology (Science) | Archaeology of Asia, Africa and the Americas | Historical Archaeology | American archaeology | Collaborative Archaeology | Biomolecular Archaeology | Battlefield Archaeology | Contract Archaeology | Stellar Archaeology | ||
| Archaeology of Australia (excl. Aboriginal and Torres Strait Islander) | Medieval Archaeology | Andean Archaeology | Community Archaeology | Computational Archaeology | Building Archaeology | Professional Archaeology | ||||
| Archaeology of Europe, the Mediterranean and the Levant | Palaeolithic Archaeology | Australian Archaeology | Conflict Archaeology | Dendroarchaeology | Cave Archaeology | Rescue Archaeology | ||||
| Archaeology of New Zealand (excl. Māori) | Prehistoric Archaeology | Carribbean Archaeology | Contemporary Archaeology | Environmental Archaeology | Coastal Archaeology | Salvage Archaeology | ||||
| Digital archaeology | Roman Archaeology | Chinese Archaeology | Cyber-Archaeology | Experimental Archaeology | Industrial Archaeology | |||||
| Historical archaeology (incl. industrial archaeology) | Maya Archaeology | Ethnoarchaeology | Forensic Archaeology | Island Archaeology | ||||||
| Maritime archaeology | Greek Archaeology | Evolutionary Archaeology | Geoarchaeology | Landscape Archaeology | Archaeological Resource Management / Cultural Resource Management | |||||
| Archaeology not elsewhere classified | Mediterranean Archaeology | Funerary Archaeology | Ichthyoarchaeology | Marine Archaeology | ||||||
| Other history, heritage and archaeology not elsewhere classified | Islamic Archaeology | Gender Archaeology | Microarchaeology | Maritime Archaeology | ||||||
| Household Archaeology | Osteoarchaeology | Mining Archaeology | ||||||||
| Indigenous Archaeology | Remote Sensing Archaeology | Nautical Archaeology | ||||||||
| Media Archaeology | Zooarchaeology | Urban Archaeology | ||||||||
| Mortuary Archaeology | Wetland Archaeology | |||||||||
| Music Archaeology | ||||||||||
| Primate Archaeology | ||||||||||
| Processual Archaeology | ||||||||||
| Public Archaeology | ||||||||||
| Settlement Archaeology | ||||||||||
| Social archaeology | ||||||||||
| Theoretical Archaeology | ||||||||||
| Underwater Archaeology | ||||||||||
| Virtual Archaeology | ||||||||||
This same problem of describing the nature of archaeological research can be seen at a finer level by contrasting two views of the conceptual language of archaeology captured in the science maps generated by mapping the co-occurrence of terms extracted by NLP from titles and abstracts and the science map of the co-occurrence of terms among author-specified keywords. There is, of course, considerable overlap between the specific terms present in both maps; networks of keywords and NLP-extracted terms both capture the range of archaeology research in terms of materials and methods. There are, however, very real differences present in the clustered representations of the discipline. The dense, unbroken concentration of author-keywords also demonstrates the cohesion of archaeology as a field of enquiry despite its extraordinary diversity. Maps of author-keywords are a particularly good way to identify terms that testify to the use of new methods ('3D reconstruction', photogrammetry', 'lidar', 'augmented reality'), or new forms of evidence ('ancient DNA'), or to the nature of the conceptual approach ('material culture', 'biogeography'). This is to be expected, since authors will wish to highlight what is new in their research. Maps of author-keywords align with that sense of archaeology often portrayed in popular science and journalism where the discovery of new evidence or the application of a new method offers a revelatory moment of understanding. By contrast, there are certain aspects of archaeological research that are not represented in maps of author keywords and much better captured through the analysis of the longer form texts of titles and abstracts. Maps of NLP-extracted terms separate archaeology into clear specialisms defined either by form of scientific approach or by the nature of evidence examined. Moreover, some of the most commonly occurring NLP-extracted terms are almost invisible in the maps of author keywords. Terms like 'deposit', 'sediment', 'sample', 'application', 'method', 'technique', 'test', 'fragment', 'assemblage', 'population', 'project', 'perspective' have little if any presence in the maps of author keywords. These are, perhaps, such basic terms that they do not register with authors when choosing keywords: they have been obliterated through incorporation into the common-sense understanding of the discipline by its active researchers. However, to non-specialists the inclusion of these same terms might better identify the essential nature of archaeological research as a complex interplay between evidence and interpretation, a process of dealing with both fragmentary evidence and at the same time evidence that needs to be understood as intrinsically sampled (Clarke 1973). The science maps of NLP-extracted terms, therefore, are a more effective visual representation of the nature of archaeology as a working discipline.
The final and finest resolution issue of language and archaeology relates to the problem of variation in language introduced earlier (Section 4.1) in the methodological discussion related to the reconciliation of variants of terms. Close examination of the co-occurrence maps of author keywords for both 2004-2013 and 2014-2021 reveals as many examples of synonymous term variants as the map of NLP-derived terms. While we should expect to see variation in terms when they are extracted from the free text of titles and abstracts, it is surprising to see the same degree of variation within a corpus of what should be carefully selected author keywords. This identifies an issue for archaeology in terms of its language at the level of terms themselves. It raises the issues of whether the discipline would now benefit from greater self-control over the terms that are used.
We should not be surprised by the number or range of terms used in archaeological research. As a comparative discipline, archaeologists need distinct terms to describe and examine comparable forms (classification), while archaeological interpretations often benefit from the juxtaposition of different approaches given concrete shape in specific terms used to describe analogous examples. Specialist language is needed to describe specific time periods and geographical places, to describe distinctive forms of material culture both architectural, artefactual and ecofactual. Archaeology's engagement with other disciplines has resulted in the regular incorporation of items from other disciplinary vocabularies to describe the range of scientific, methodological and theoretical approaches employed to explore archaeological evidence. Further complications arise from the development of terms in specific areas with specific language traditions and their application to other places, or their translation into other languages for wider communication (increasingly in English).
Terminology is not a new problem and there have been a range of responses to this problem, changing as research has moved from the physical realities of paper and ink to the thoroughly digital and international world. We have a number of physical vocabularies published as dictionaries of archaeology (for example: Bray and Trump 1982; Shaw and Jameson 2002; Bahn 2002; Darvill 2008) filled with the specific terms for periods and places, and especially types of artefacts, as well as one conceptual list (Renfrew and Bahn 2005). The development of professional archaeology has generated other lists of terms, sometimes actively curated, for aspects of archaeology evidence such as the lists compiled by the Forum on Information Standards in Heritage. Likewise, museums have developed vocabularies for describing their artefactual material, of which the best known are probably the Getty Vocabularies. More recently, archaeologists have addressed the issue of how to facilitate interoperability between diverse databases of digital information produced by archaeological projects within and between nations. Specialists have explored natural-language processing techniques as a mechanism for the extraction of key information from digital textual outputs in different languages to assist in searches for relevant research (see Binding et al. 2019; Richards and Hardman 2008; Richards et al. 2015; Sporleder 2010; Vlachidis and Tudhope 2015). Examples of this work include the STAR and STELLAR projects exploring semantic technologies for archaeological resources, and the ARIADNE project developing a data infrastructure for Europe. The keyword maps once again raise the issue of how we might manage this vocabulary particularly for the methodological and conceptual terms, and in relation to the creation of multiple word noun-phrases as keywords and within free text. Archaeology does not possess a curated list – a controlled vocabulary - that manages its methodological and conceptual terms, particularly those borrowed from other disciplines. This is a large proportion of the language of archaeology in use today.
Controlled vocabularies have been developed for other disciplines. Two examples are worth brief discussion here: the vocabularies for astronomy and astrophysics and for psychology. The first controlled vocabulary for astronomy was published in 1992, with an updated Unified Astronomy Thesaurus developed as an open-source community project for the discipline (Accomazzi et al. 2014). Of particular interest here is that in 1992 a series of 300 hierarchically organised concepts were agreed upon by the editors of the major astronomical journals as Astronomy Subject Headings or journal keywords. The most recent version, updated in 2013, is available online, along with guidance to authors to use these works to categorise their articles. In psychology, a controlled vocabulary was developed as a necessary mechanism for co-ordinating a vocabulary that grew through the appropriation of different methods and concepts from many different disciplines and the proliferation of new terms by authors, and to provide a means for efficient search and retrieval of new research scattered among many different journals (Kinkade 1974, i). The 'Thesaurus of Psychological Index Terms' started in 1974, has provided a regularly updated listing of terms in multiple formats that can be used to refine the search for new documents (e.g. APA 1994; 2005). As new terms are added, and established terms changed, the Thesaurus is retrospectively edited to ensure that the keywords used to describe psychology research outputs stay current. Used as a guide for science mapping, the Thesaurus also provides a mechanism to track the development of the discipline through time (see Flis and van Eck 2018).
Archaeology is an 'unrestricted science' (in the sense described by Pantin 1968), wherein archaeologists follow their research problems seemingly without reaching a point at which their work is no longer considered archaeological. Science maps of archaeology reveal the breadth of its sources and range of its terms, and their development through time, demonstrating that archaeology is a discipline that openly draws in opportunities to expand its research methods and direction through engagement with practices in other disciplines. They also raise the possibility that archaeology may have reached a time when it needs to think carefully about the ways in which language effectively describes its research, or might hinder identification and use of the outputs of its research. The development of its own controlled vocabulary for its methods and concepts needs careful consideration to support more established studies, looking at the traditional and international vocabulary used to describe sites, materials, periods and places.
Readers based in universities in the United Kingdom will know only too well that the period 2014 to 2021 exactly aligns with the most recent period used for evaluation of the research outputs of scholars and institutions working in higher education in the UK (REF 2021). Bibliometric data, and specifically information on citation numbers, is used as part of the evaluation process for some units of assessment (subject areas) particularly in the natural sciences, although it is not used to evaluate research in the social sciences, humanities and arts - including archaeology. For the record, the maps that accompany this article should not be seen as offering any qualitative or quantitative evaluation of the archaeological research, and some of the discussion above should illustrate why this form of data has its limitations. Moreover, these maps draw together many more examples of archaeological research outputs across a much wider geographical range than examined recently in the UK. However, these maps, and in particular the maps of sources, institutional collaboration and the language of archaeology, illustrate many of the same qualitative assessments of the shape and the general scale and flow of archaeological research that has been summarised by the specialist review panel (REF 2022) based on their reading and evaluation of more than 1000 individual research outputs and submissions from more than 20 academic units in the UK. They illustrate the considerable engagement with scientific techniques and approaches that is now commonplace in archaeology, the breadth of questions that typify archaeological research and the complex international relationships that now characterise archaeological research across the world. Science maps provide an ideal complement to detailed reading of documents and to present a picture of a discipline so diverse as archaeology, which might not be realised in popular understandings of the discipline or through the moments of high publicity given to the results of new types of analysis or the find of new data.
The research presented here is funded by the Leverhulme Trust via a Major Research Fellowship: 'The Atlas of Archaeology: a scientometric study of disciplinary growth 1960-2021' (MRF-2019-126) - looking at the development of archaeology from 1960 to 2021 through an analysis of the bibliometric metadata. A key output from 'The Atlas of Archaeology' will be a set of free-to-use thesaurus files to support other researchers in the science mapping of archaeology and some cognate fields.
I would like to thank all my colleagues at the Department of Archaeology, Classics and Egyptology at the University of Liverpool for discussions concerning draft maps and in particular (in alphabetical order) Eleni Asouti, Bruce Gibson, Peter Hommel, Harold Mytum, Jessica Pearson and Matthew Ponting for help in assessing variants in the maps of terms presented here. I would also like to thank staff at the Archaeology Data Service for their helpful responses to initial enquiries concerning controlled vocabularies in archaeology, as well as thanks to an anonymous reviewer of the first draft for constructive suggestions concerning current work on vocabularies and natural language processing in archaeology.
Internet Archaeology is an open access journal based in the Department of Archaeology, University of York. Except where otherwise noted, content from this work may be used under the terms of the Creative Commons Attribution 3.0 (CC BY) Unported licence, which permits unrestricted use, distribution, and reproduction in any medium, provided that attribution to the author(s), the title of the work, the Internet Archaeology journal and the relevant URL/DOI are given.
Terms and Conditions | Legal Statements | Privacy Policy | Cookies Policy | Citing Internet Archaeology
Internet Archaeology content is preserved for the long term with the Archaeology Data Service (ROR). Help sustain and support open access publication by donating to our Open Access Archaeology Fund.
 Home
Home