Cite this as: Santos, J. 2022 Why did Cities Evolve in Gharb Al-Andalus? Network analysis as a potential method for charting city growth, Internet Archaeology 59. https://doi.org/10.11141/ia.59.9
'How can I talk about you, Silves, without a tear falling on me like that of a lover in love, or about you, Seville, without a sigh of anxiety?' Ibn Ammar (1031-1084), in 'Saudade' (Granella 2015)
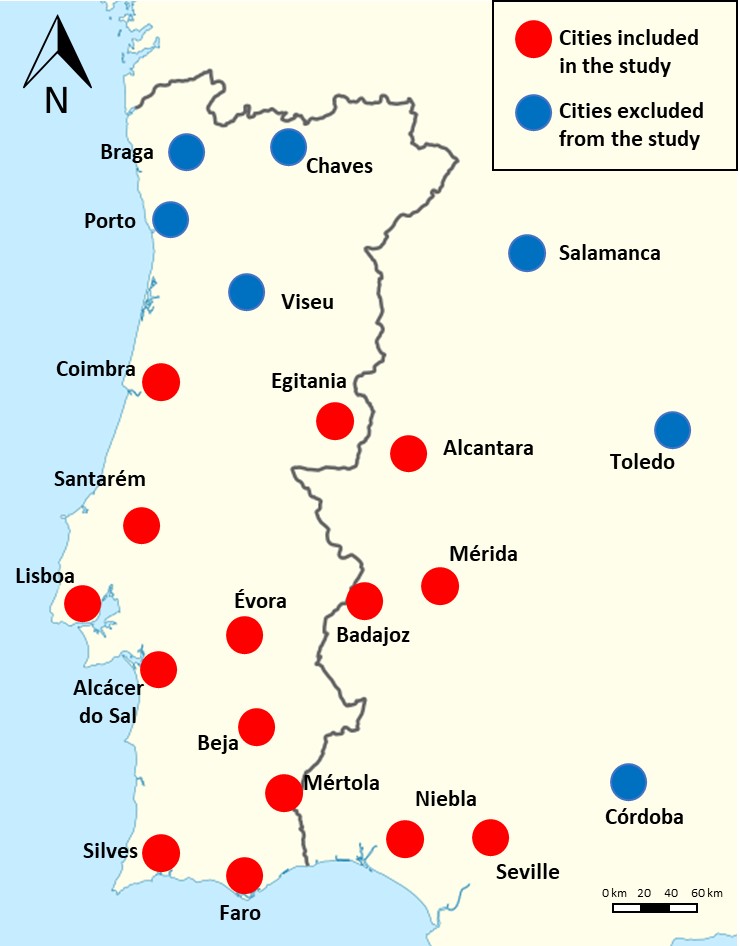
The use of network theory-derived methods and models have seen significant proliferation in recent years in archaeology (see Peeples 2019; Knappett 2019), and this article aims to add another facet to their development and deployment in the discipline. One question still to be addressed is whether it is possible to identify particular tendencies and patterns regarding the diachronic development of a certain actor within a network. This concerns the ability to use the centrality measures of a network as estimators for the evolution of an actor inside the same network. In this article, the actors will be the cities of the Muslim Gharb Al-Andalus (henceforth Gharb) between the 8th and the 13th centuries AD, especially those located in current Portuguese territory (see Figure 1).
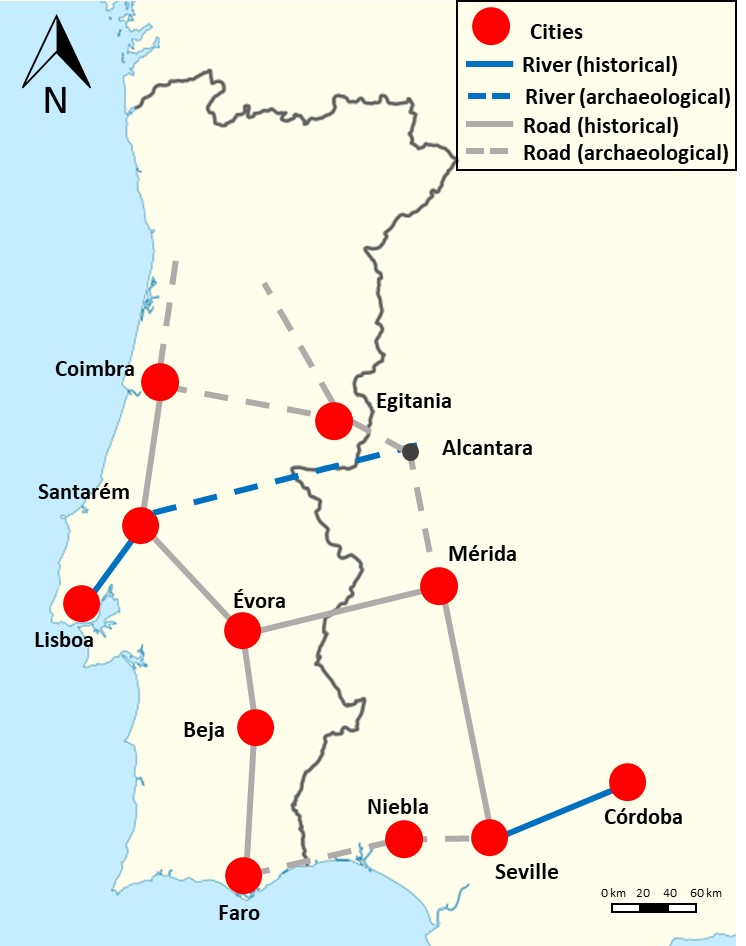
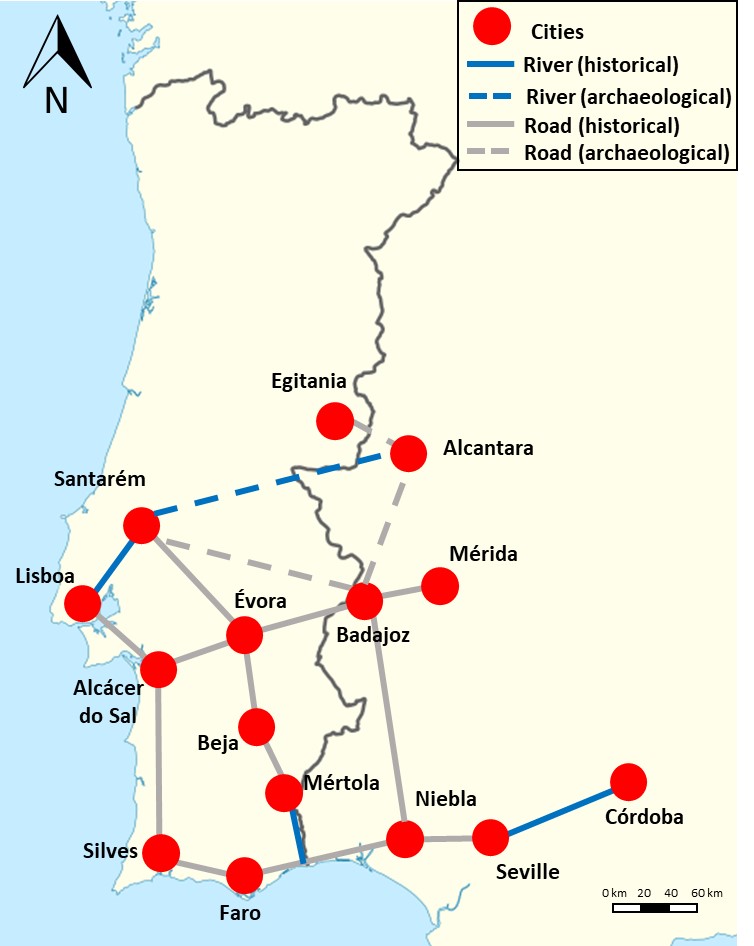
The relations (edges) between the actor cities will be supported by geographic data, namely the circulatory network comprising roads, rivers and the sea (Figures 2 and 3). The primary goal of this article is to present a new approach for looking at cities, the Gharb ones in particular, utilising Network Theory and appropriate archaeological evidence. Some questions to be discussed include the following: why did some Gharb cities grow during the 8th-13th centuries and others not? Why did some almost disappear? Could their respective evolution be predicted? If so, can this approach be used for other contexts and time periods?
Normally, the importance of cities is seen a posteriori, using historical information that is confirmed (or not) by archaeology. For instance, the documented size of cities that western Europeans knew nothing about prior to their discovery (e.g. Machu Picchu, Angkor Wat, etc.), can indicate how large they might have been at the height of their prosperity. Even those earlier places significantly pre-dating any kind of written sources (e.g. Çatalhöyük) are known for their remarkable size, grandeur and longevity. However, how can we determine the qualitative importance of such places? Even if it is possible to imagine, it is rarely possible to measure and document fully their real importance in the context of all their relationships. This difficulty, besides the lack of historical sources and information regarding chronological contemporaneity of places, also comes from not having explicit information about the way cities related to one another. While some research has tried to reconstruct those relations using the known transportation system (Peregrine 1991; Jenkins 2001; Isaksen 2007), others have tried to simulate what possible relations might have existed using proximal point analysis (PPA), where the actors (cities) are examined on the basis of connection to their closest neighbours (Knappett et al. 2011; Rivers and Evans 2013; Rivers 2016). In addition, other approaches have tried to reconstruct relations between cities by making interpretations on the basis of cities' possible similarities, deduced from the material culture found in them (Mills et al. 2013a; 2013b; Mills 2016; Blair 2015; Peeples 2018). This article will use the known transportation system of the Gharb not only to understand the importance of a given site in a specific period, but also whether a city's importance and evolution can be calculated through probability on the basis of its position within the network.
Why has the circulation network framework been chosen for this study? It is obvious that relations that influence the behaviour of a city go far beyond transportation systems. Unfortunately, besides some historical references and archaeological evidence for the Gharb cities, it is difficult to understand different kinds of relations thoroughly, such as military, religious, commercial, cultural or any other type. Regardless of the type of relation between cities, it will be argued that the influences exercised were reinforced by the circulation system, thus making it possible to evaluate its impact (or not) on a particular city's evolution. External or internal factors such as wars, territorial conquests, frontier alterations, new commercial ventures and other factors changed the transportation network through the centuries, consequently affecting the development of each city, which is evinced by their general growth, diminution, or increase in and loss of power. The challenge is to demonstrate, with reference to specific cities of the Muslim Gharb, that such projections are possible when based on a study of the transportation system and, depending on the centrality measures of each city in a certain period, those external and internal factors will influence the growth or decrease of a particular city.
This article will address several challenges that are enumerated and debated in an Overview section. To answer these challenges, the Methodology gives an explanation of some parameters used and the design of the network diagrams with the centrality measures calculation. Subsequently, some interpretations regarding the previous calculations, contrasting them with historical sources and archaeological investigations, are presented and discussed in the Results section. The Conclusion section picks up these themes and summarises.
At this stage, some challenges should be taken into consideration. The first concerns the significant geographic variation that took place over more than 500 years (c. 711-1249) of Islamic power in the Gharb. For example, it is possible to discern several changes over time in the northern Gharb: the Berber Revolt of 740-743, which provoked the withdrawal of the Muslim forces from that territory; the subsequent Muslim regaining of power at the beginning of the 9th century by Al-Hakam I; Al-Mansur's offensives at the end of the 10th century; and the ensuing period of Christian conquests. Further south, the concession of Santarém, Lisbon and Sintra by the king of Badajoz to the Kingdom of León and Castile in 1093 and their recovery by the Almoravids shortly after also likely played a significant role in altering the regional socio-political dynamics. These are just a few examples that demonstrate the political instability of a highly disputed territory throughout the Muslim period in the Iberian Peninsula.
Defining the boundaries of study is probably one of the most significant issues in defining the network (Peeples 2019). Boundaries are human visions that most of the time do not actually block relations – as Borgatti and Halgin note, real 'networks do not have natural boundaries' (2011, 1169). Therefore, to establish these boundaries is a compromise that will eschew the study of some important actors (cities). This study is limited to areas that were territorially stable for lengthy periods. Therefore, the limit of this analysis in the northern frontier will be the Mondego River, including Coimbra and Egitânia and excluding Porto, Braga and other cities. On the other hand, on the eastern frontier, the choice was not related to historical territorial stability but to cities that belonged to the Gharb and today are in Portuguese territory. However, some cities outside Portugal's borders, such as Badajoz, Mérida, Niebla and Seville, were also considered, since they were part of the Gharb and it would not be possible to understand the evolution of cities in this part of the Al-Andalus without their inclusion.
The second challenge related to the choice of the cities involves their qualitative inclusion in the analysis. Which cities (actors) should be included and with what characteristics? Based on their size? Their status? What constitutes a city in Al-Andalus? Who defines it? This challenge is substantial when discussing medieval cities and, obviously, any attempt to do so risks anachronism. This is precisely the situation for the Gharb. The absence of information, the distinct a posteriori names used for 'city' during the Muslim period in the Iberian Peninsula, the varied importance given to each by the several Islamic authors and the numerous lists1 of cities that existed (Picard 2000) makes this task a difficult one. How, then, is it possible to identify why cities collapsed or grew if it is challenging to identify what constitutes an early medieval Iberian city? The importance and difficulty of interpreting the concept of a 'city' is such that Mazzoli-Guintard, in her book about the Muslim cities of Al-Andalus (1996), dedicates the entire first chapter to try to solve it, or at least reduce the number of doubts and questions involved. The author herself recognises that the same word applied to discussing cities often had different meanings – qarya (pl. qura), hisn (pl. husun), qal'a (pl. qila) or madina (pl. mudun) – '…à chaque mot correspond non-pas une, mais des réalités archéologiques différents' (Mazzoli-Guintard 1996, 38).
Thus, in light of this issue and knowing that any one choice will not provide a full explanation, a compromise was reached by combining two different definitions. The first is based on a historical definition drawn from geographer Al-Razi's work (10th century)2, who classed Mérida, Badajoz, Beja, Ocsonoba (Faro), Santarém, Coimbra, Egitânia, Lisbon, Niebla and Seville as principal cities of the Gharb. The second precept is archaeological, based on the size of the 'cities', calculated by archaeological area (Gomèz et al. 2007), allowing us to add Évora, Silves, Mértola and Alcácer do Sal to the examples to be studied. Places like Sintra, Almada, Palmela, Montemor, Elvas, Moura, Serpa, Tavira and Loulé, even though they are within the defined boundaries of the study, were deliberately left out because of their reduced size.
Another challenge when talking about Gharb cities is the chronological dimension of Muslim hegemony. Despite its five-century duration, we will not consider in the same analysis cities that did not coexist, or, at least, did not have the same degree of importance during that time. Alcácer do Sal, Beja, Egitânia, Évora, Faro or Mértola are just some key examples of cities that underwent significant change, whether growing or losing power, from the beginning of the Muslim presence until the total conquest of their territory by the Christian kingdom of Portugal.
However, some scholars3, supposing that all readers have the necessary knowledge to be able to make distinctions based on diachronic variation, have often published a single map showing several cities of the Gharb, which they include based on their importance regardless of their variation over time. Similarly, it would be like putting London, Manchester, Liverpool, Cape Town, Calcutta, Melbourne, and Bridgetown on a single map as the most important cities in the British Empire without any chronological contextualisation or specification of what signifies an 'important city' (political power? number of inhabitants? size? etc.) in a particular context/time period. In discussing chronologies, Peeples (2019, 483) states that '[t]his is undoubtedly an area where archaeologists could make major contributions', since 'traditional approaches to network representation and modelling … have tended to focus on single observations or "snapshots" of complex networks that collapse temporal variation for the sake of analytical consistency. Therefore, to overcome the issue of comparing 'non-comparable' cities, this article uses an approach of splitting the big chronology into smaller temporal intervals (Mills et al. 2013a; 2013b; 2018).
This article will focus on five distinct periods during the Muslim presence in the Gharb, in which snapshots of the cities are taken:
These five periods are merely a selection of important examples, and in future analyses others can be considered.
While other attempts of using circulation network frameworks always analysed single periods, such as roads during the 15th century in the Inka Empire (Jenkins 2001); the rivers comprising the Mississippi watershed in relation to the importance of Cahokia (Peregrine 1991); or the importance of the chief Roman cities in Hispania Baetica (Isaksen 2007), this article hopes to evaluate the change of importance among cities during several periods of their existence. Other works, like those of Mills et al. (2013a; 2013b; Mills 2016) that, 'using well-dated decorated ceramics, track changes in network topology at 50-y intervals to show a dramatic shift in network density and settlement centrality from the northern to the southern Southwest' (Mills et al. 2013a, 5785) tried to analyse the growth and decline of cities during specific periods, but not in a predictive way. Peeples and Haas (2013) used the analysis of brokers' position in a network to identify 'measures of settlement growth and longevity' (Peeples 2019, 459), trying therefore to use brokerage measures to identify the probability of a particular city's growth. This article, instead, will evaluate the circulation system to calculate that probability.
This is precisely the challenge that needs to be examined – the circulation system. Although there is some information regarding the roads and rivers used in the Gharb during the 8th-13th centuries, there is still a major lack of data. While some authors state that these roads followed almost completely the old Roman ones (Levi-Provençal 1999 [1950]), others, based on the descriptions of the Gharb by al-Idrisi (1989), a 12th-century Arab geographer and cartographer, state that such roads do not follow the Roman ones. Probably, as some Portuguese archaeologists have stated, 'having lost their military functions, the old Roman roads were abandoned and sometimes replaced by narrower and winding paths' (Torres in Mattoso 1993, 391). Several proposals have been made, based on al-Idrisi and other geographers' descriptions, together with knowledge of Roman roads and archaeological evidence (Mattoso 1993, 390; Picard 1997, 391; Ferreira 2004, in attachment titled main roads). The studies previously done by investigators of the Muslim medieval period in Iberia were used. Two maps were followed for the most part, one from Levi-Provençal (1999 [1950]) of the main roads of the Iberian Peninsula just before the Muslim conquest in the 8th century (Figure 2 – solid lines), updated with connections between the main cities (Figure 2 – dashed lines). The second map, from Picard (1997, 391), shows the main roads used during the Muslim period in the Gharb (Figure 3 – solid lines), updated with information from archaeology (Figure 3 – dashed lines).
It is not the intention of this article to explain what network theory is and how it works (see Brughmans 2013; Collar et al. 2015); however, to understand the theoretical approach regarding the analysis of the Gharb cities, it is important to present a brief overview of this methodology. The methodology has four basic steps:
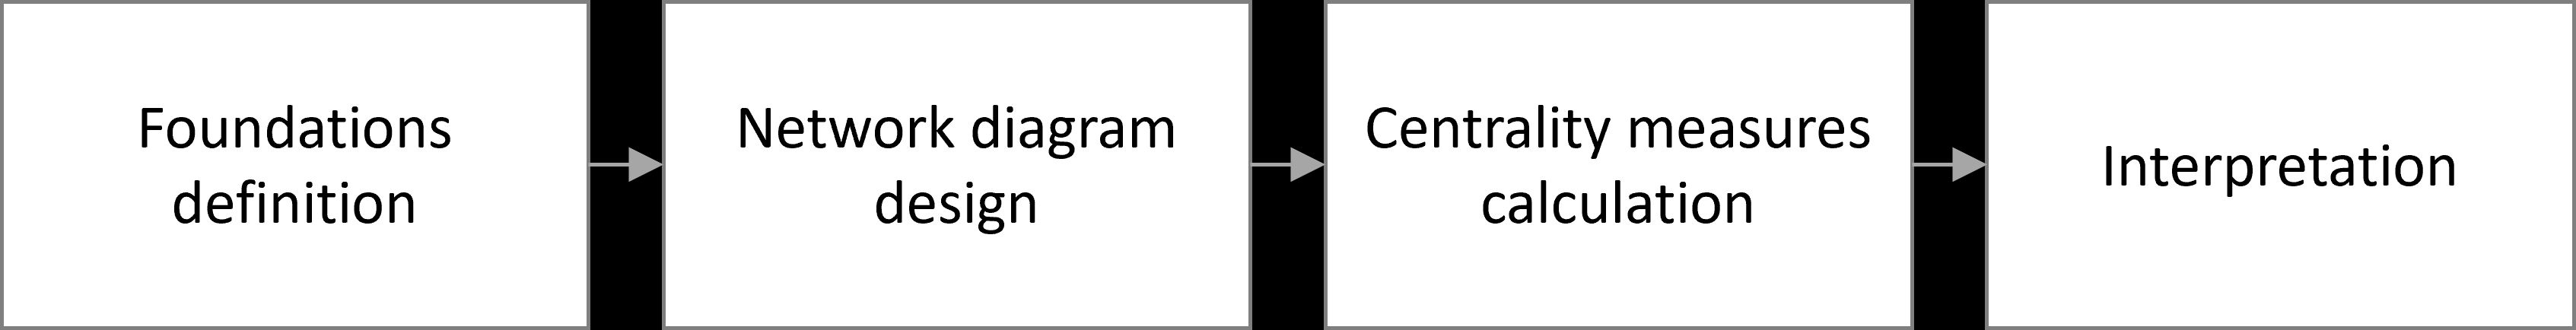
The first step, Foundations definition, is basically the definition of scope done in the previous section - as well as the parametrization of the values used for the weighted edges (see Section 3.1). The second step builds the network maps (see Figure 5 as an example) for each chronology (see Section 3.3). The third step is the moment to calculate the chosen centrality measures of each network map (see Section 3.2 and Figures 5-14) and, finally, the fourth step is the interpretation of the identified results (see Section 4).
As mentioned, the transportation network was used as the connector (edges, links) between the Gharb cities (actors, vertices). Since the routes of this network can take several forms – such as roads, rivers, or the sea – it is obvious that, depending on the type of route used, the strength of the influence between cities would differ according to the route type. To calibrate this difference, we used weighted edges parametrized with two factors. The first concerns the link length, which in this case is the distance between cities, in kilometres (e.g. the distance between Évora and Beja is 80km, making the parameter value 80). Therefore, the longer the distance, the harder it is to exercise influence (for an idea of calculation see Preiser-Kapeller and Werther 2018). The second regards the link strength, which in this case will depend on the type of route – a terrestrial route is valued as 1, a river route or a local sea route is valued as 10, and an international sea route is valued as 20 (e.g. the route between Lisbon and Santarém is the Tagus River, making the link strength 10). Therefore, the higher the link strength, the stronger the influence exerted between cities. The centrality measures that will be used in the probabilistic calculation for the tendential growth or decline of the Gharb cities consider both of these parameters.
However, before talking about the centrality measures, it is necessary to explain the option for the values regarding the link strength. If the choice for the link length is clear, based on the distance between cities, why should the river route score ten times more than the terrestrial one when considering the link strength? Unfortunately, using existing information it is undoubtedly harder to determine whether a river route should be valued ten, eleven, twelve times more or any other value . Nevertheless, travel by boat on a river was not only faster and safer, but the transport capacity was also much greater. In this article, therefore, the river routes and the local sea routes were given a value of 10, as calculated by some Portuguese historians (Gaspar 1970). For the international sea routes, as, for example, between Silves and North Africa, the value of the link strength was set at 20 owing to the substantial administrative, military and commercial influence the route afforded. These link lengths and link strengths will obviously affect the centrality measures.
Why use centrality measures? As Borgatti (2005, 55) stated, 'Centrality measures, or at least popular interpretations of these measures, make implicit assumptions about the manner in which traffic flows through a network' and this is precisely the issue, because when talking about the circulation network, it is not clear what is being delivered (or received). It is possible to exchange goods, religious influence, military authority, or anything else. Thus, depending on what is flowing through the network, it will have different flow characteristics (Borgatti 2005, table 1) and to choose one centrality measure (or another) to classify the network will give different meanings. To overcome this issue, two centrality measures were chosen, which measure two completely different things in the network.
The first centrality measure, betweenness (Borgatti 2005; Newman 2010), measures the number of times a certain actor (city) is on the shortest path between another city and all the other cities (see Figure 1). For example, the number of instances where the shortest path from Beja to each of the other cities in the Gharb passes through Évora was used to calculate the betweenness score. The calculation for Beja should be replicated for all other cities, thus providing the total betweenness score for Évora. To simplify, the question involves how well positioned was a specific city in the network that the traffic – commercial, military etc. – probably passed through it to arrive faster to a certain place. The betweenness score can be seen as indicative of a city's commercial/communication potential. The second centrality measure, the eigenvector (Bonacich 1972; Borgatti 2005; Newman 2010), measures the importance of an actor by taking into consideration the importance of its neighbours. Therefore, the eigenvector score is proportional to the sum of the eigenvector scores of its neighbours. 'Hence, the eigenvector centrality measure is ideally suited for influence type processes' (Borgatti 2005, 62). The eigenvector score can be seen as the strategic potential of a city in the network.
These centrality measures will be used when analysing cities. Both measures will be applied in the network to each city and, according to their centrality measures, the probability of evolution of a city (growth or decline) in the respective temporal periods will be modelled, taking into consideration that can occur owing to the two aforementioned patterns, its commercial/communication (betweenness), or strategic (eigenvector) importance. For example, if a certain city had low centrality measures c. 1090, it had a higher probability of diminishing in importance in the subsequent period (1200).
Now that the link parametrization is defined and the centrality measures are chosen, it is possible to build the network diagrams. As stated before, this case study concerns the Iberian Peninsula (Al-Andalus) during the Muslim presence and hegemony, more precisely the western part (Gharb). Some cities, like Beja, Egitânia and Faro, lost importance during this time, while others, like Alcácer do Sal, Évora and Silves, grew. This article hypothesises that the probability of this evolution could be predicted according to the position of each city in the network of the circulation system during respective periods.
Before presenting the network diagrams, one important clarification regarding the circulation network (the links) is needed, since only two maps were used (Figures 2 and 3), even though five periods were studied (the first map was used for the first period (c. 756), while the second map relates to the remaining four periods (929, 1000, c. 1090 and c. 1200)). Given that we are working with the transport system to calculate centrality measures, if no changes were introduced in the maps between the stated periods, the betweenness and eigenvector calculations would always present the same values, which would invalidate the proposed theory in being able to predict the probability of a city's evolution, using the centrality measure.
Even using mostly the same map (Figure 3), several variations are introduced between chronologies. One is motivated by the Portuguese conquest of some cities during these periods. For example, Coimbra switched sides, either to Muslim or Portuguese authority, at various points through time, c. 756 to c. 929 (in the hands of the Christians), c. 929 to 1000 (in the hands of Muslims), and finally c. 1000 to 1090 (in the hands of Christians); or Lisbon, Santarém and Évora, which, by c. 1200, had already been conquered by the Portuguese. During the periods in which these cities were not under Muslim control, they were taken out of the network, which automatically alters the calculations. A second variation is generated by the appearance of cities like Alcácer do Sal, Silves, Mértola and Badajoz which had not previously existed (like Bajajoz) or were outside the main transportation network. These cities were only used in the maps of the second chronological phase, when the transportation network already incorporated them. Another change occurred when the unified governance of the Gharb separated into several smaller kingdoms or principalities (taifas) – around 1009 – meaning that the cities did not communicate among themselves as before until they were reunited under a central government once again. In this period, the cities in the region were separated between two kingdoms, Badajoz and Seville, and communication between them was cut. However, the biggest variation concerns the introduction of a new transport route – the sea. Apart from some local activities, after the end of the Roman period the sea was largely unexplored. A centralised maritime politic was introduced during the caliphate period, which continuously grew until the end of Muslim power in the Gharb (Picard 1997). The variations in the use of the sea were considered for the several periods studied here (from 1000 onwards).
The network diagrams presented (Figures 5 to 14) follow the geographical distribution of the cities. There are two diagrams for each period, one showing the betweenness values and the other the eigenvector values for the cities. The size of each city represented is proportional to its betweenness or eigenvector values, which allows us to visually verify the potential of each city according to its centrality measures (e.g. in the betweenness diagram of c. 756 (Figure 5) Évora has greater commercial/communication potential than Faro, while in the eigenvector diagram of c. 756 (Figure 6), Santarém has greater strategic potential than Évora).


One of the things evident from these visual representations is the cities' commercial and strategic potential in relation to geographic distribution. It is possible to see that the greater commercial/communication potential (betweenness), with the exception of the period of c. 756 (Figure 5), is positioned according to two axes (see Figures 7, 9 and 11): a north-south axis from Évora to the Atlantic Ocean running southward (passing through Beja and Mértola), and an east-west axis from Badajoz to Alcácer do Sal running westward (passing through Évora). Only for the last period, c. 1200 (Figure 13) do these axes disappear again, as several cities were already under Christian administration and part of new interactive dynamics. Regarding the strategic potential (eigenvector) of the cities, it is possible to observe that those with the largest values are positioned along the Tagus River (Lisbon, Santarém and Alcantara) during the first two chronological periods (Figures 6 and 8) and, after the introduction of the maritime route, the cities with the most significant strategic values are those by the Atlantic Ocean (Alcácer do Sal, Silves and Seville, though Faro and Niebla also have interesting values) (Figures 10, 12 and 14). As discussed later, however, it is important to note that these zones of higher potential correspond to the ones identified with the help of historical sources and archaeological evidence.
For a better understanding, the results presentation was divided according to the following criteria. Lisbon and Santarém were the two of the most important cities on the northern border of the western Gharb, which also had a very important connection with the Tagus. Egitânia was an isolated city on the northern border of the eastern part of the Gharb. Beja, Évora and Mértola were important commercial posts in the interior of the Gharb. Finally, Alcácer do Sal, Faro and Silves were the most important maritime cities in the Gharb. Modern Spanish cities like Badajoz, Mérida, Alcantara, Niebla and Seville were included in the calculation of the centrality measures of the Gharb cities, yet not thoroughly analysed since their inclusion would have forced an increase in the size of the analysed area. On the other hand, Coimbra was left out owing to its instability.

Santarém was considered a very important city for the duration of Muslim power in the Gharb (Picard 1997; 2000). Lisbon was also considered as very important, mainly after the taifa and Almoravid periods (c. 1009-1147) (Picard 1997; 2000), although not as much as Santarém. However, both cities do not present much pertinent archaeological evidence (Gomes 2002; Gomèz Martínez et al. 2012), which clearly contrasts with their historical importance. What can the network theory tell us? Santarém, for example, had greater commercial/communication potential than Lisbon, since Coimbra was under Muslim power (Figures 5 and 9), confirmed by the historical sources that considered the existence of a large port at Santarém and overlooked the existence of a similarly important port at Lisbon (Picard 1997). Nevertheless, the most interesting results come from the eigenvector values, since Santarém and Lisbon have the largest eigenvector values in the analysed Gharb cities, meaning that they had the greatest strategic potential during the first two periods analysed (Figures 6 and 8). Indeed, Lisbon started growing right after the third analysed period and Santarém maintained its importance (Picard 2000). However, from the third period onwards, as already seen, both cities almost entirely lost their strategic potential (Figures 10 and 12). These changes can be seen also in a different representation in Figures 15 and 16. Coincidence or not, in 1093 these two cities were offered by the king of Badajoz, Omar Al-Mutawakkil, to the king of León and Castile Alfonso VI (Picard 2000; Lourinho 2020) in exchange for protection. Thus, in a moment of need the cities that were offered were precisely the ones that had the lowest strategic values.

Another interesting case is Egitânia. This was a very important city during the Visigothic period before the Muslim conquest of the Gharb. Al-Razi, the aforementioned Arab geographer, identifies the city as a district capital (kura) but there is no archaeological evidence to corroborate this. This situation was even called by a team of Portuguese archaeologists the 'Egitânia paradigm' (Gomèz Martínez et al. 2012) – historically documented power yet no archaeological evidence. Can network theory tell us something about Egitânia to address this issue?
After Coimbra's conquest in 878 by Alfonso III of Asturias (Mattoso 1993; Coelho 2008), Egitânia was isolated from the other most important Muslim cities (examples in Figures 2-3, or Figures 5-7), and remained connected, via the main roads, only with Alcantara. The betweenness (commercial/communication) score drops automatically to zero and stays there even when Coimbra was reconquered by Muslim forces (Figures 9 and 10). Regarding the eigenvector (strategic) value, even if it does not drop to zero, while Santarém, Lisbon and Alcantara gained their greatest strategic potential when the sea route was opened (Figure 9), these values also drop to zero. Therefore, according to network theory, it seems that archaeology corroborates Egitânia's loss of importance during the Muslim dominion since it did not have any commercial or strategic potential.
This being the case, it can be proposed that Egitânia is not such a mysterious case of the Islamic presence in the Gharb. The archaeological evidence, which presents a significant lacuna regarding the Muslim presence in Egitânia, seems to be, at least partially, explained by Mazzoli-Guintard (1996), who states that, in the periods following their conquest of the peninsula, the Muslims settled in the most important Visigothic cities, turning them into regional capitals. The possible importance of Egitânia, which communicated with the north of Portugal during the Visigothic period, must have started to decline with the conquest and fall of Coimbra in 878. The use of network theory in relation to Egitânia has helped to demonstrate that, when it found itself disconnected from Coimbra, it followed its natural probabilistic 'destiny' as a city and entered a path of decline.
At the time of the Muslim conquest of the Gharb, Beja was probably the most important city (Picard 2000). However, from 929, when it was conquered by Abd al-Rahman III following internal revolts, it began losing power until it was conquered by the Portuguese in 1234. This important process of decline is observable in the sparse archaeological evidence – primarily ceramics – since, even if the quantity of ceramics grew in the final centuries of the Muslim presence, their quality is not comparable with material from earlier centuries (Gomèz Martínez et al. 2012; Casmarrinha 2013). Évora shows opposite characteristics, being absent from the Muslim chronicles until 913, when it was recorded in relation to a raid there by Ordonho II, king of Galicia and León (Filipe 2012). However, it is only after 929, when Abd al-Rahman III elevated Évora to district capital that it started to grow in importance, achieving the place of second city of the Badajoz Kingdom during the taifa period (Picard 2000; Filipe 2012). Following its conquest by Afonso I of Portugal in 1166, Évora was not considered in Figures 13 and 14. Archaeological evidence confirms the significant growth of Évora during the caliphate and taifa periods (Gomèz Martínez et al. 2012).
Finally, Mértola is perhaps the most controversial case to be included in this study. From an administrative point of view, it never played a leading role (Macias 2002), if we exclude the two periods when it was, respectively, the capital of a small taifa, which lasted 22 years (Palma 2017), and the capital of Ibn Qasi's independence movement in the 12th century (Picard 2000). There are, however, two reasons for including Mértola in this study. One relates specifically to the aforementioned two short periods of independence, and the second relates to the archaeological work carried out in Mértola in the last 40 years, which has brought to light relevant material evidence (Gomèz Martínez et al. 2012). While archaeology does not show much evidence for earlier centuries of occupation, it does demonstrate important growth during the caliphate and the taifa periods and even greater growth during the Almohad period in Iberia. Was Mértola an important city, simply forgotten in the historical sources? Or was it merely an important trading post?
Once again, through the network theory centrality measures, it is possible to observe the significant patterns of growth and decline at Beja, Évora and Mértola. Beja, for example, always had a lower commercial/communication potential when compared to Évora, which had a global high potential during the first three studied periods (Figure 15). However, with the dissolution of Al-Andalus' centralised power into separate kingdoms (Figure 11), Beja was completely isolated, reducing its betweenness score to zero, which confirms the major loss of importance it underwent in the caliphate period. Évora shows opposite dynamics, since its significant commercial/communication potential from the beginning of the Muslim presence in the Gharb (Figure 15) is confirmed by its growth from the 10th century. Mértola, not being the city with the biggest commercial/communication potential, has interesting betweenness values from the 10th century (Figure 15), which are confirmed archaeologically and by the two periods of independence. However, it is during the last period (Figures 13 and 14), with the loss of several cities (Lisbon, Santarém, Évora) to the Christians, that the commercial/communication potential of Mértola rises to the higher values, which is once again confirmed by archaeological evidence. Having no strategic potential, Mértola was most probably a very important trading post.
Faro is one of the most mysterious Gharb cities. There are doubts regarding its ancient name, as it was variously called Uhshunuba, Ukshunuba, Ukshuniya by Muslim sources and, from the 10th century, Shantamriyya al-Gharb; doubts regarding its size, since Uhshunuba was the name of the town and also the region; and doubts regarding its location, since some archaeologists question whether it is located in the current Faro city or somewhere nearby (Picard 2000; Pessanha 2012). Following Knappett et al. (2011), we have used gravity modelling to address this, which means that it does not matter if Beja connects to Faro or with two or three near locations, since the network will behave the same (Evans et al. 2009). Therefore Faro, after the Muslim conquest of the Gharb, was a district capital until the 10th century, when it was surpassed by Silves. However, even after that, Faro was important enough to become the capital of a kingdom during the taifa period before being conquered by the Kingdom of Seville. Its access to the sea and the local trade was instrumental to this importance. Nevertheless, from the 10th century, Faro declined as city, even if other cities nearby like Tavira and Loulé grew during these periods (Picard 2000). Gravity modelling must be used here also, since, even though Faro declined from the 10th century, it is precisely from that time onwards (Figure 16) that Faro gained its strategic potential. Even if Faro had a high strategic potential until the end of Muslim power, this potential was exploited by other cities, like Tavira and Loulé, which grew later on.
Silves, the city that surpassed Faro, is one of the best known cities in the Gharb historically and archaeologically. However, it is only after the 10th century, when it was promoted to district capital, that it gained some administrative importance. From then and until the end of Muslim power in the Gharb it increased its power until it became the most important city of the Gharb (Picard 2000). Even if Silves was occupied by important Islamic families since the 8th century, only when it became an important port for the caliphate (Figures 9 and 10), with access to the sea, did it gain particular importance. Thus, the sea route that connected Silves to North Africa increased in importance (Picard 2000; Gomèz Martínez et al. 2012). Although archaeological evidence has demonstrated that this city was occupied by Islamic families since the 8th century, it shows significant and continuous growth until it was conquered by the Portuguese Kingdom in 1189 (Picard 2000; Gomes 2002). The eigenvector – strategic – calculation, demonstrates the enormous growth in the strategic importance of Silves from the 10th until the 13th centuries (Figure 16). Though it was a nearly isolated city in the interior of the Gharb (Figure 3), after the opening of sea routes (Figures 10, 12 and 14), it continuously grew in statistical strategic potential, but also in actual socio-economic importance. Even if the commercial/communication potential was low, this situation was overcome by the strategic potential.
We finally turn to Alcácer do Sal. This was the only city that also had a very high strategic potential – eigenvector (Figure 16) and a high commercial/communication potential – betweenness in the 10th-13th centuries (Figure 15). While it was an important city during the Roman period, it almost disappeared during the Visigothic era until it was rebuilt and occupied in 878 (Gomèz Martínez et al. 2012; Leitão 2016). However, it is only in the 10th century, when it became the main port of the Gharb, that it became an important city. This importance was maintained during the taifa period, when it was the direct way to the sea from Badajoz. In the final period of Muslim power in the Gharb, even though relatively isolated, since Lisbon and Évora had been conquered, Alcácer do Sal maintained its importance owing to its connection with North Africa (Mattoso 1993; Leitão 2016; Picard 2000). Archaeological evidence confirms its importance during Muslim dominion of the Gharb. Once again, the centrality measures 'predict' its status. At the beginning of the 10th century, it had a high commercial/communication potential (Figure 15), complemented by a very high strategic potential in the next period (Figure 16), which parallels Alcácer do Sal's actual historical importance.
From the nine analysed cities using a network theory-informed approach, eight behaved as expected. Two centrality measures were used, betweenness and eigenvector. This is a very important debate, since, as stated at the beginning of the article, there is not just one factor of influence between actors in a network (cities in this case) and analysing both measures allowed the potential reason behind each city's growth or decline to be understood.
Cities like Évora and Mértola had continuously high betweenness values, which means they had high commercial/communication potential to influence the rest of the network, since they were on the shortest route to other destinations. This helps to understand that Mértola was most likely a trading post with a very high potential for commerce with neighbouring cities that in turn influenced other cities. Therefore, Mértola's situation is as might be expected. This is also the case for Egitânia, as there is no proof of the so-called Egitânia paradigm. During the first years following the Muslim conquest it might have been important, but after Coimbra's fall it was completely isolated and with significantly reduced strategic or commercial/communication potential, it had just accomplished its 'destiny'. Silves, not having commercial/communication potential, used its strategic potential to grow. It is possible to verify all results as predicted by the analytical model. Alcácer do Sal, with its commercial/communication and strategic potential, grew as a city, while Beja, without that potential, shows the opposite dynamic. Lisbon and Santarém, after an initial high strategic potential, lost it after sea routes started to be used. Would that lack of strategic and commercial/communication potential have motivated the king of Badajoz to give both cities to the Christians in the 11th century? Only Faro did not show expected patterns. Rather, it shows a high strategic potential (eigenvector), but historical sources and archaeological evidence contradict this, marking the city's decline. However, using gravity modelling, it was possible to explain that, although Faro itself did not show expected dynamics, Tavira and Loulé, cities geographically near Faro and using the same transportation network, benefited from that potential.
How, then, is the approach stated in this article best used? Is its primary strength a predictor for testing theories of socio-economic and political dynamics? Even if the calculations showed some degree of predictability, it is not the intention of this article to follow that path. However, it is possible to understand some dynamics that helped to clarify some situations. For example, it can shed some light on Egitânia's paradigm or Mértola's controversy. This article also shows the importance of the water routes in the network. Cities like Lisbon, Santarém and Alcantara were more easily connected to other locales in the Gharb by the Tagus River, and showed a very high strategic potential that was only lost after the sea routes were introduced. Alcácer do Sal, Silves, Faro, Niebla and Seville became the cities with the biggest strategic potential after that advent. Indeed, it is remarkable how aptly network theory shows the importance of the water routes, whether rivers or the sea.
Of course, cities do not grow or diminish only according to connectivity of the routes that pass through them. It is the information that travelled on the roads that might also have (or not) influenced each city. Nevertheless, the way a city is connected and its position in the network give it easier (or more restricted) access to that influence. This study's objective was precisely to understand to what extent that level of potential influence might have helped a city to evolve by virtue of connectivity, and in the discussed examples, it certainly did.
I would like to thank Carolina Almeida and Tania Casimiro, without them this paper it would not have been possible to finish.
1. Al-Istahri (10th century) talks about three regions in the Gharb (Santarém, Coria and Mérida); Al-Muqaddasi (10th century) adds four more (Seville, Badajoz, Beja and Ocsonoba (Faro)); Al-Razi (10th century) raises the number to ten (Mérida, Badajoz, Beja, Ocsonoba, Santarém, Coimbra, Egitânia, Lisbon, Niebla and Seville); Ibn Ghalib (12th century) reduces the number to seven (Mérida, Beja, Seville, Niebla, Ocsonoba, Santarém and Lisbon); and the Dhikr bilād al-Andalus – a 15th-century geographic and historical description of Iberia – raises it once again to ten, but changes the composition (Lisbon, Alcántara, Santarém, Silves, Badajoz, Porto, Beja, Mérida, Niebla and Seville), just to mention some Islamic sources.←
2. Described by Levi-Provençal as a choice that ‘ reflète un certain équilibre’ (Picard 2000, 137).←
3. In the publication Portugal Islâmico – os últimos sinais do mediterrâneo, on the same map, Egitânia and Alcácer do Sal (among other cities) are classed as key urban centres (Torres and Macias 1998, 17), when the importance of both occurred at completely different periods. In contrast, Christophe Picard (Picard 2000, 328), although placing all cities divided by importance on a single map, specifies that this map does not take into account their evolution over time.←
Internet Archaeology is an open access journal based in the Department of Archaeology, University of York. Except where otherwise noted, content from this work may be used under the terms of the Creative Commons Attribution 3.0 (CC BY) Unported licence, which permits unrestricted use, distribution, and reproduction in any medium, provided that attribution to the author(s), the title of the work, the Internet Archaeology journal and the relevant URL/DOI are given.
Terms and Conditions | Legal Statements | Privacy Policy | Cookies Policy | Citing Internet Archaeology
Internet Archaeology content is preserved for the long term with the Archaeology Data Service (ROR). Help sustain and support open access publication by donating to our Open Access Archaeology Fund.
 Home
Home