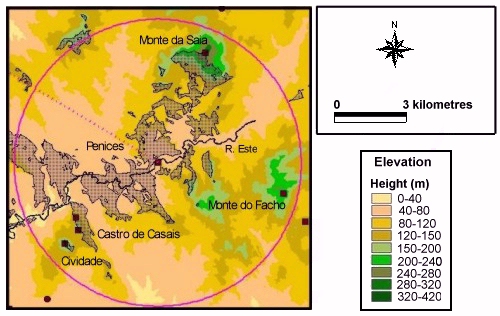
Fig. 6.38. Viewshed grid for the castro at Penices, demonstrating the area visible from the castro
In order to assess how cultural and social factors influenced the distribution of settlements, their position was analysed utilising the viewshed and cost movement techniques in ArcView. The aim was to examine general trends in the cost distance and intervisibility between individual sites using the entire dataset, rather than relying on single case studies.
Fig. 6.38. Viewshed grid for the castro at Penices, demonstrating the area visible from the castro
Viewshed coverages for visibility over a 6km radius were generated, based on a grid of elevations derived from the contours (Fig. 6.38). Cumulative cost distance grids were formed for castros, and Iron Age and Roman sites, based on the varying gradient of slope across the study area. From these data, visual representations of viewshed and cost distance were produced for each site, based on the following criteria:
The decision to use a 6km distance of visibility was an arbitrary one, although it was influenced by the limits of visibility caused by the weather as experienced during the fieldwork. Results of the viewshed analysis were generated as shapefiles in Arcview, indicating those areas visible and invisible from each settlement.
Download geo-spatial data to carry out your own analysis from the digital archive
(link opens new window)
The cost units used for the cost analysis are also arbitrary relative values. They equate to a set length of time taken to move from a particular location and thus allow for the difficulty of the terrain. These cost units are clearly oversimplifications as it is difficult to assess factors such as the ease of use of a path or the impact of a burden on the speed an individual could have moved across the landscape.
| Number of castros visible (6km) | From other castros | From Roman sites | From all sites |
|---|---|---|---|
| None visible | 0 | 0 | 0 |
| One visible | 9 | 7 | 16 |
| Two visible | 11 | 6 | 17 |
| Three visible | 2 | 2 | 4 |
| Four visible | 2 | 0 | 2 |
| Five visible | 0 | 0 | 0 |
| Six visible | 0 | 0 | 0 |
| Seven visible | 0 | 1 | 1 |
| Total | 24 | 16 | 40 |
Considering first the pattern of sites known prior to the survey, castros were visible from all the known settlement locations (Table 6.15). From the majority of sites, one or two castros were visible. The pattern of visibility of Roman sites presented a slightly different picture (Table 6.16). Roman sites were visible from 83% of castros, but in 54% of these cases only one such site was visible. They were visible from 75% of other Roman sites, although in 62% of the cases only one of them was visible. When we consider the visibility of Roman sites from all the site locations known prior to the survey together (Table 6.16), 20% of sites had none visible and 57% had only one visible.
| Number of Roman sites visible (6km) | From castros | From other Roman sites | From all sites |
|---|---|---|---|
| None visible | 4 | 4 | 8 |
| One visible | 13 | 10 | 23 |
| Two visible | 7 | 2 | 9 |
| Three visible | 0 | 0 | 0 |
| Four visible | 0 | 0 | 0 |
| Five visible | 0 | 0 | 0 |
| Six visible | 0 | 0 | 0 |
| Seven visible | 0 | 0 | 0 |
| Total | 24 | 16 | 40 |
| Number of castros visible (6km) |
From sites known prior to the survey |
From newly discovered sites | From all sites |
|---|---|---|---|
| None visible | 0 | 3 | 3 |
| One visible | 16 | 20 | 36 |
| Two visible | 17 | 17 | 34 |
| Three visible | 4 | 6 | 10 |
| Four visible | 2 | 1 | 3 |
| Five visible | 0 | 1 | 1 |
| Six visible | 0 | 0 | 0 |
| Seven visible | 1 | 0 | 1 |
| Total | 40 | 48 | 88 |
Castros were visible from 94% of the newly discovered sites, although only a single castro was visible in 42% of these cases (Table 6.17). When we consider the pattern of visibility of castros from all known sites together, they were visible in 97% of cases. A single castro was visible from 42% of the locations and 39% of sites had two castros visible.
| Roman sites visible (6km) |
From sites known prior to the survey |
From newly discovered sites | From all sites |
|---|---|---|---|
| None visible | 8 | 14 | 22 |
| One visible | 23 | 15 | 38 |
| Two visible | 9 | 11 | 20 |
| Three visible | 0 | 4 | 4 |
| Four visible | 0 | 3 | 3 |
| Five visible | 0 | 1 | 1 |
| Six visible | 0 | 0 | 0 |
| Seven visible | 0 | 0 | 0 |
| Total | 40 | 48 | 88 |
Roman sites were visible from 71% of the newly discovered sites, with one visible in 32% of cases and two in 23% of them. Considering the visibility of Roman sites from all known sites together, they were visible from 75% of the locations, with one visible in 43% of cases and two in 23% of them (Table 6.18).
This analysis emphasises the continuing importance of castro sites in the overall settlement pattern as, despite the terrain, at least one castro was visible from 97% of sites. This pattern strongly suggests that sites were carefully located in order to have visual contact with at least one castro, even into the Roman period (see 6.5). The importance of intervisibility between Roman settlements is less clear. Although neighbouring sites are still visible in 75% of cases, this is less surprising given the density of sites and their predominantly valley locations.
| From castros | Other castros | Roman sites | All sites |
|---|---|---|---|
| Within 0-8000 cost units | 8 | 2 | 10 |
| Not within 0-8000 cost units | 16 | 14 | 30 |
| Total | 24 | 16 | 40 |
Results of the cost distance evaluation of sites known prior to the survey indicated a relatively low degree of accessibility both between castros, and from castros to Roman sites (Table 6.19). Only 33% of castros and 12% of Roman settlements appear within 8000 cost units of another castro (Fig. 6.39). This pattern is as expected given the prominent locations of castros, and contrasts with the result produced between Roman settlements and both castros and other sites (Table 6.20). Castros are relatively accessible from Roman sites, with 83% within 8000 cost units. Similarly, 62.5% of other Roman settlements lie within the same range (Fig. 6.40).
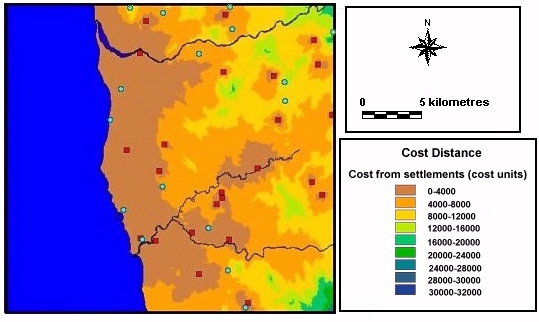
Fig. 6.39. Map showing the cost of access from all castros
Red square = castros; blue circle = Roman settlement
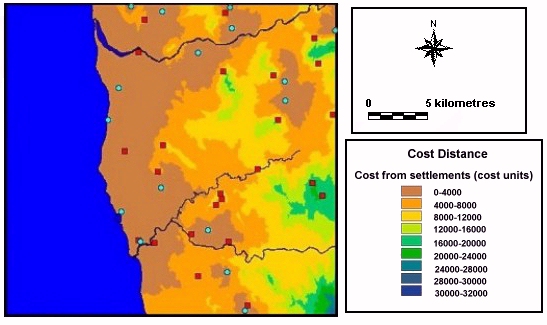
Fig. 6.40. Map showing the cost of access from Roman settlements
Red square = castros; blue circle = Roman settlement
| From Roman sites | Castros | Other Roman sites | All sites |
|---|---|---|---|
| Within 0-8000 cost units | 20 | 10 | 30 |
| Not within 0-8000 cost units | 4 | 6 | 10 |
| Total | 24 | 16 | 40 |
When we consider the Iron Age and Roman sites discovered in the survey the relationship between sites was less clear. The greater density of sites and the fact that the data are confined to transects also makes comparison difficult. However, from the data visualisation (Fig. 6.41), it was established that Roman sites were always within 0-8000 cost distance units of another settlement.
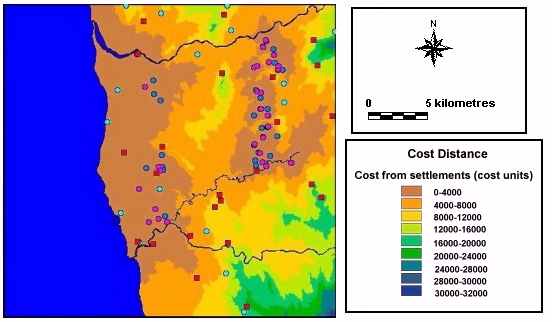
Fig. 6.41. Map showing cost of access from Iron Age settlements discovered in the survey
Red square = castros; blue circle = Roman settlementl dark blue circle = new Roman site; purple circle = new Iron Age site
The location of undefended Iron Age and Roman sites across two transects also suggests a pattern of settlement continuity and relocation within a limited locality. Almost all Iron Age sites show signs of continuity into the Roman period (see Section 7). In addition, some relocation of settlement is shown by the situation of Roman sites on river terraces downslope from Iron Age sites, for instance around the castro Monte da Cividade.
© Internet Archaeology
URL: http://intarch.ac.uk/journal/issue9/millett/stats3.html
Last updated: Sat Dec 30 2000