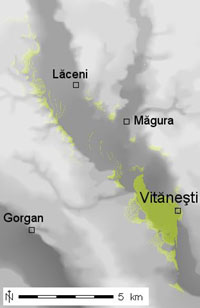
Initially, standard binary viewshed analysis was conducted from the base elevations of the tells, in order to understand the visibility from the initial occupations of the village (Figure 6b; see note 2). Since none of the tells are featured on the base maps as discrete features (note 3), it was possible to conduct visibility analysis from the bases of the tells by placing a virtual viewer directly onto the interpolated DEM surface. A height of 1.63m was specified for the virtual viewer, informed by skeletal data from the fifth millennium BC cemetery at Popeşti (Şerbănescu 1999). Figure 6b shows the standard binary viewshed analysis from Vităneşti tell (see note 4).
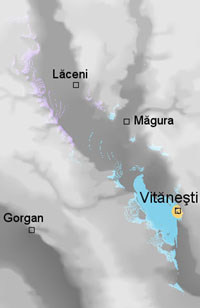
One of the standard criticisms of viewshed analysis is that it is a rather coarse representation of sensory experience which by its nature is characterised by variability, especially over distance. In order to address this, the so-called Higuchi enrichment, introduced by Wheatley and Gillings, was applied to the basic viewshed map, splitting the binary viewshed into three bands, each relating to a different grade of visual clarity (Wheatley and Gillings 2000). The enrichment described by Wheatley and Gillings is based on a classification introduced by the landscape designer Tadahiko Higuchi (Higuchi 1983). In this system each band relates to the visual clarity of a reference object over distance, in this case, a tree. The three bands are foreground, middle distance and background. In the foreground, individual leaves can be seen, and other senses come into play such as auditory conception of the rustling of the leaves. In the middle distance, individual leaves are no longer discernable, and the effects of haze or mist begin to come into play. In the background, objects are no longer recognisable as distinct entities, merging into a homogeneous two-dimensional backdrop. Figure 6c shows the Higuchi viewshed analysis from Vităneşti tell.
Figure 6: Viewshed analysis from the base context of Vităneşti tell.
 |
 |
 |
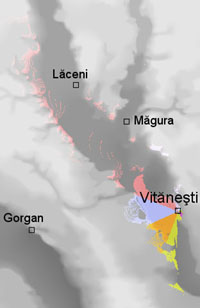 |
| a. DEM of Vităneşti locale | b. Binary viewshed overlaid on DEM | c. Higuchi viewshed overlaid on DEM | d. Directional viewshed overlaid on DEM |
Additionally, a further enrichment introduced by Wheatley and Gillings, which considers the inherent directionality in viewshed maps, was applied to the basic binary maps (see Fig. 6d). In this reclassification, the binary viewshed is split up into eight directional categories, north, northeast, east, southeast, south, and so on.
This analysis has revealed some common patterns of visibility from the initial occupation levels of the settlements. Primarily, visibility is confined to the river valleys; it is bounded by the terraces and follows the morphology of the valley up and downstream. In terms of clarity, foreground views are often split in two due to the presence of the eastern terrace adjacent to the tells. Most visibility occurs in the middle band, with the background band being poorly represented. This means that from the tell locations you either see something with a good deal of clarity, or you don´t see it at all. Above the crests of the terrace slopes there is only sky; there are no hazy vistas of distant mountain ranges or seascapes.
In terms of directionality, vision is heavily biased towards one half of the compass. If we quantify this directionality for each tell, measuring the visible area in each category, we can represent this directionality in graph form (see Fig. 7). Each line in the graph represents the visibility from a tell. If we overlay the results from a number of tells, the biased nature of visibility is illustrated. The tell of Plosca appears as an 'outlier' because it is in the far west of the study area where the floodplain is on a different alignment, but the principle is the same; the vision is biased toward one half of the compass.
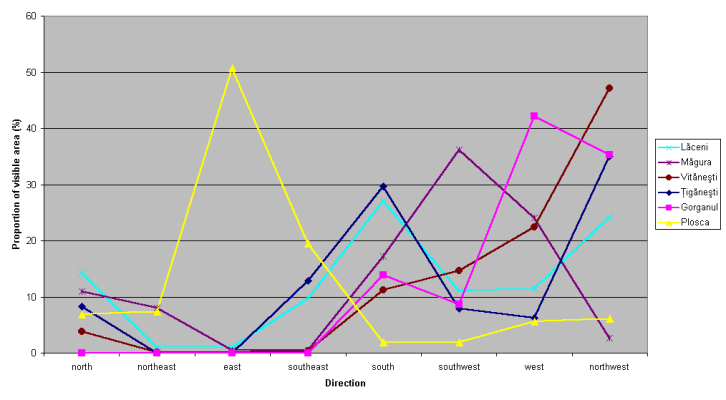
Figure 7: The directional viewsheds from a number of tells quantified and plotted on a line graph. Each line represents a different tell
The selection of places at the edge of river valleys for the foundation of long-term villages set up a particular way of habitually viewing the world. Vision was restricted to the river valleys. Since these valleys only comprise 16% of the total study area, tell vision could be said to inhabit small, micro-worlds of experience. Yet these micro-worlds maximised their potential, consisting of high- or medium-quality visual information. Visibility was strongly directed towards more open parts of the landscape, corresponding with floodplain topography (Trick forthcoming).
Vegetation is undoubtedly an important factor. I have argued elsewhere (Trick 2002) that recent geomorphological work in the study area (Bailey et al. 2002), together with pollen studies from the Romanian Plain (Tomescu 2000) and the effects of animal husbandry on the vegetational pattern (Ellenberg 1988, 17; Vera 2000; Sugita et al. 1999), suggest that the spread of vegetation in the valley floor during the latter half of the fifth millennium BC were similar to the present; mostly open grassland with occasional groves of woodland. However, more pollen sampling is required in the study area to clarify the local situation (Tomescu 2001).
© Internet Archaeology
URL: http://intarch.ac.uk/journal/issue16/7/8.1.html
Last updated: Thur Nov 11 2004