For this article I wish to concentrate on visibility from the tells themselves. From the start of the research the emphasis was on conducting a sensitive, high-resolution analysis of visibility in the study area, rather than attempting a coarser but more comprehensive study based on a larger corpus of tells. The analysis was done with the GRASS (Geographic Resources Analysis Support System) GIS package (Neteler and Mitasova 2002; see note 1).
A prerequisite of GIS-based viewshed analysis is a surface model, or Digital Elevation Model (DEM) of the study area. The source material for the development of this model were a set of 1: 50 000 mapsheets, Russian in origin, acquired through GeoStrategies, a Cambridge-based company with a branch in Sibiu, Transylvania. The mapsheets were scanned, imported and georeferenced. The latter process provided the opportunity to translate the native Gauss-Kruger projection of the maps, common in former Eastern Bloc countries, into the more modern, universal format of Universal Transverse Mercator (UTM). The contours of these maps were digitised using the mouse, and an interpolation process provided a continuous surface model, at a resolution of 20m per cell.
It may be considered a contentious issue that maps representing a modern topography have been used to investigate landscape visibility in the past. The morphology of the landscape has undoubtedly changed since the fifth millennium BC, especially in the floodplain where deposition of alluvial materials has continued to accumulate. In answer to this I would follow Gillings work on virtual reality models in archaeology (1999) and declare that the model is only true to itself and does not seek to imitate the fifth millennium BC situation. It is only by conducting investigations with a landscape amenable to modelling, i.e. the modern landscape, that we can begin to apprehend basic patterns of visibility in the region, and from here consider what degree of departure there may have been in the fifth millennium BC.
Owing to a lack of accurate locational information for the tells in the study area, a GPS survey was necessary. With the US Government no longer dumbing-down the signal received by non-military GPS equipment (Selective Availability), a small handheld device used in the field was able to report coordinates with an accuracy of ±3m. This was sufficiently accurate to enable the recording of large monuments such as the tells of the study area, which can be more than 100m in diameter and over 10m in height.
Plotting the locations of the tells on the contour map reveals some common patterning in the distribution (see Fig. 5). Many of the tells, especially those in the eastern half of the study area, are located at the edge of the floodplain, hard up against the eastern terrace slope. There also seems to be a correlation between tell location and springs issuing from the base of the terrace. This distribution fits favourably with the general model for tell distribution in the mid and northern Balkans, where tells are commonly found proximal to river valleys, on terraces or raised valley floor areas (Todorova 1978; Chapman 1997; Andreescu et al. 2001).
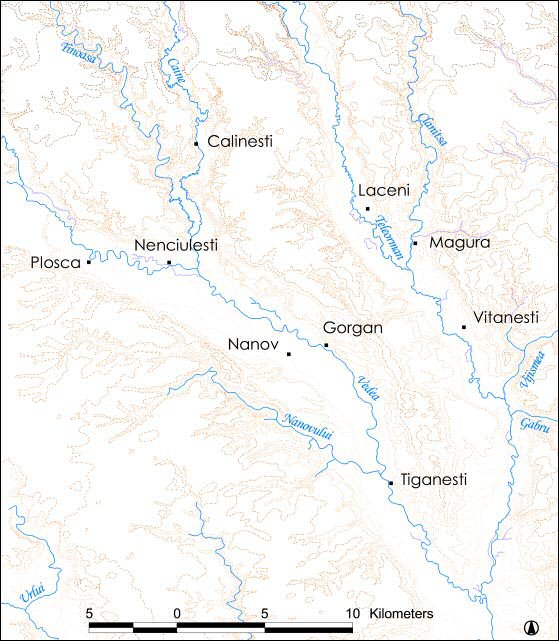
Figure 5: Tells of the study area. Rivers also marked
© Internet Archaeology
URL: http://intarch.ac.uk/journal/issue16/7/8.html
Last updated: Thur Nov 11 2004