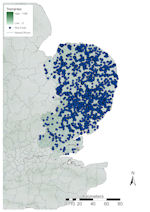
Figure 22: Distribution of finds in East Anglia against topographic base map
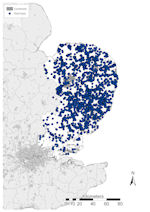
Figure 23: Distribution of finds in East Anglia against constraints base map
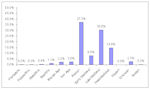
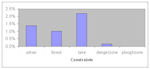
Figure 24: Chart showing PAS finds in East Anglia by period
Figure 22: Distribution of finds in East Anglia against topographic base map
Figure 23: Distribution of finds in East Anglia against constraints base map
Figure 24: Chart showing PAS finds in East Anglia by period
All of East Anglia is below 100m OD, except for a small area of Suffolk, to the south-west of Bury St Edmunds, where the eastern end of the Chilterns rises to over 100m OD. Rivers predominantly run at right-angles to the coast, and drain towards the North Sea in an arc from central areas, with outflow into the sea in all areas except the north-west tip of Norfolk. Here, watercourses run into the Great Ouse, and then northwards to the Wash (Fig. 22). East Anglia is the least urbanised area in England, and such centres are mostly confined to coastal areas (Fig. 23). The only large urban areas are few in number, including Norwich, Ipswich, Bury St Edmunds and the Essex coast. The area around Thetford constitutes the only extensive woodland in East Anglia, Thetford Forest Park, and adjacent to this is a designated military 'danger zone'.
A total of 29,488 finds have been reported in East Anglia, accounting for 24.2% of the national assemblage (Fig. 7). In Norfolk and Suffolk the relationship between metal-detector users and archaeologists has been developing since the 1970s, and although not all finds have been entered in the PAS database the quantity of finds is still considerable. Norfolk accounts for 25.04% (7384 records) of reported objects, Suffolk 66.52% (19,615 records), and Essex 8.44% (2489 records) (Fig. 22). A breakdown of the assemblage by period (Fig. 24) shows that it is dominated by Roman material, followed by Late and Post-medieval, between them making up 82.6% (24,354 records) of all records. Prehistoric material accounts for 6.7% (1931 records), Early Medieval 8.0% (2348 records), the highest proportion for any region of England, modern and foreign material 0.2% (61 records) and undated material 2.7% (794 records).
In general, East Anglia has produced finds in all areas of land, with a concentration in central areas thinning towards the north-west and south-west (Fig. 22). The kernel density plot is more illustrative in this respect, showing a concentration of finds across much of Suffolk and, to a lesser extent, central Norfolk (Fig. 25). North-east Suffolk, and coastal areas of Norfolk and Essex are noticeably less productive. This is probably due to the nature of reporting to the PAS database by Norfolk Museums Service, and the short length of time that Essex has been a PAS Recording Area (see Section 2.4.1). There is a generally significant correlation between finds and waterways, which is more important than the correlation with either the Roman or modern road network. The only exception to this is in north-west Norfolk where recovered finds following the Roman roads and rivers are scarcer.
The potential constraints on the data (Fig. 23), although less important than in other regions, do make a visible impact on finds recovery, with low numbers in urban areas and the Thetford Forest Park/military 'danger zone'. A total of 1401 finds (4.8%) were made within areas where constraints on recovery were calculated (Fig. 25), mostly in wetland/lakeland areas (642 records, 2.2%). Finds in urban areas were only low-level at 1.4% (406 records), and the 303 woodland finds were all from Thetford Forest Park, with concentrations between west of West Stow and just to the east of Brandon, both areas of well-known and extensive archaeological excavation (West 1985; Carr et al. 1988). Gurney has argued that care must be taken in interpreting the distribution of metal-detected finds spots in Norfolk (Gurney 1997). He has specifically suggested that the distribution of 7th- to late 8th-century coins simply reflects areas of metal-detecting activity. However, Hutcheson believes that the increased quantity of data has now removed some of the earlier biases. By 2007 the Norfolk Historic Environment Record recorded more than 9000 findspots discovered by metal-detecting, as opposed to some 1250 in 1997 (Hutcheson 2006, 82).
The high levels of cultivated land combined with low levels of constraints on data collection in East Anglia mean that a large proportion of land is available for survey in the region. The differences seen in the kernel density of finds across the region are more likely to reflect the relationship between individual counties and the PAS than historic settlement patterns. It is probable that both Norfolk and Essex would, in fact, produce as dense a distribution of finds as Suffolk if the longevity of reporting and the relationship with the PAS were equal. There are trends in finds location that may indicate the specific targeting of certain types of pre-modern landscape feature, with strong correlations between findspots and Roman roads especially visible in Norfolk. A general correlation with river systems was also apparent, and the routes of modern A-roads have little effect on distributions.
The breakdown of the region's assemblage by period follows the national trend (Fig. 7). Early medieval finds are proportionally more prolific in East Anglia than any other region of England or Wales, accounting for over a third of all finds for this period. This accords well with adjacent regions, East Central England and South-east England, which have produced the next highest proportional amounts of Early Medieval material. Like the latter area, late medieval material is also proportionally higher than elsewhere and Roman and prehistoric lower, which may reflect patterns known both archaeologically and historically.
© Internet Archaeology/Author(s)
URL: http://intarch.ac.uk/journal/issue25/2/2.4.2.4.html
Last updated: Tues Apr 21 2009