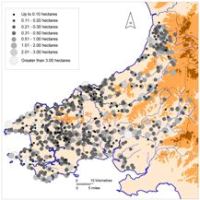
Map 6: Distribution of all sites showing size of main internal area.
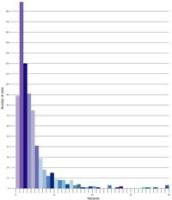
Figure 6: Bar chart showing the range and frequency of main internal area in hectares.
The distribution of sites by the size of the main internal area is shown on Map 6, and Table 7 shows the total number of sites broken down by range of internal area; this information is converted into a bar chart in Figure 6. Size in this study is defined by the internal area available for occupation, and does not include the area of defences or of annexes. In most cases it has been possible to calculate internal areas. Difficulties arise with coastal promontory forts, as the original internal area in many cases is not known owing to coastal erosion. Another problem with promontory forts in general, and coastal promontory forts in particular, is that a relatively short length of bank and ditch thrown up across a narrow neck can effectively defend a large internal area. This accounts for some of the large areas shown on Map 6. In some cases the whole of a coastal promontory may have been suitable for occupation (and therefore the large symbols on the map provide a relatively accurate guide to actual area available for occupation, even if not all of it was used), but in others only a small proportion of the defended area could have been used for buildings. An example of the latter is St Davids Head, where the remains of seven or eight stone-built roundhouses lie on the only area suitable for building — a grassy saddle between craggy bedrock outcrops, with the western end of the promontory washed by the sea during stormy weather.
Table 7: Range and frequency of main internal area size of all sites.
| Size of main internal area (hectares) | No. of sites |
|---|---|
| 0–0.10 | 89 |
| 0.11–0.20 | 178 |
| 0.21–0.30 | 120 |
| 0.31–0.40 | 91 |
| 0.41–0.50 | 75 |
| 0.51–0.60 | 41 |
| 0.61–0.70 | 29 |
| 0.71–0.80 | 18 |
| 0.81–0.90 | 12 |
| 0.91–1.00 | 15 |
| 1.01–1.10 | 9 |
| 1.11–1.20 | 8 |
| 1.21–1.30 | 8 |
| 1.31–1.40 | 4 |
| 1.41–1.50 | 8 |
| 1.51–1.60 | 3 |
| 1.61–1.70 | 4 |
| 1.71–1.80 | 1 |
| 1.81–1.90 | 1 |
| 1.91–2.00 | 2 |
| 2.01–3.00 | 9 |
| 3.01–4.00 | 7 |
| Greater than 4.01 | 2 |
| Unknown | 53 |
| Total | 787 |
The most striking aspect of these data is the very large number of small defended settlements — 553 of the 787 sites are less than 0.5 ha (this number of small sites is probably an under-estimate as it is likely that the 53 sites in the unknown category fall into this range). 387 are less than 0.3 ha in size, and only 29 are greater than 1.51 ha. Just two defended settlements are greater than 4 ha.
The distribution of sites by size shows some interesting patterns. The large number of small sites across central Pembrokeshire and western Carmarthenshire is clearly shown. This distribution extends into north Pembrokeshire and southeast Ceredigion. A lower density of medium and large sites in eastern Carmarthenshire (the Tywi valley) and up the Teifi valley in Ceredigion is also visible. On size analysis the Pembrokeshire coastal promontory forts and other forts immediately inland seem to form a separate group, while the cluster of sites in north Ceredigion cover a range of sizes.
© Internet Archaeology/Author(s) URL: http://intarch.ac.uk/journal/issue28/1/3.5.html
Last updated: Mon Dec 14 2009