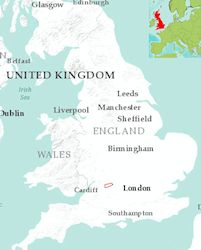
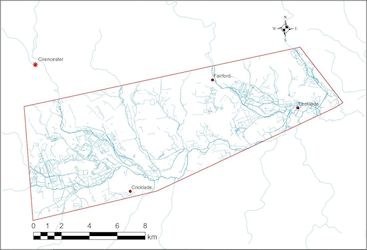
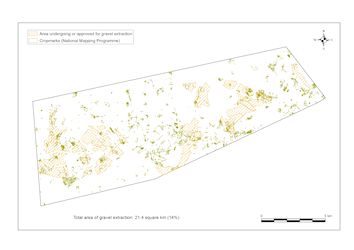
We took as our study area an elongated polygon covering 154km² to the south of Cirencester, stretching between Cricklade and Lechlade, in the uppermost part of the Thames Valley in southern England (Figure 1). The massive amount of archaeological excavation and other fieldwork here since the 1970s and, especially, since 1990 has occurred largely as a consequence of extensive gravel quarrying (Figure 2). The study area is archaeologically rich, as seen from the cropmark evidence (mapped in detail by English Heritage's National Mapping Programme (NMP: Fenner 1994). In total, over 630 separate investigations (or archaeological 'events') by more than 60 consultants have occurred (Figure 3), 78% of them involving some form of 'intrusive' archaeology. Further large areas have been subjected to geophysical survey.
Our main starting point for assembling information was Bournemouth University's Archaeological Investigations Project (AIP) database (Darvill and Russell 2002), checked against and supplemented by consultation with the county HERs. The study area is divided between the counties of Gloucestershire (55%) to the north and Wiltshire (43%) to the south, with Oxfordshire making up the easternmost 2%. Data gathering from this multiplicity of authorities highlighted a complication at the outset. Terminology and data classification systems were not standardised between the HERs (one person's evaluation was another's trial trenching and a third's watching brief). As anyone who has searched a large archaeological database will know, differences in terminology are widespread (Evans 2013, 26).
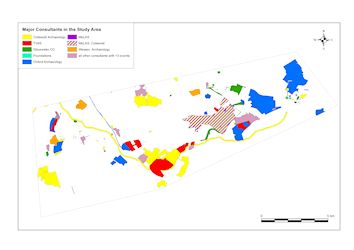
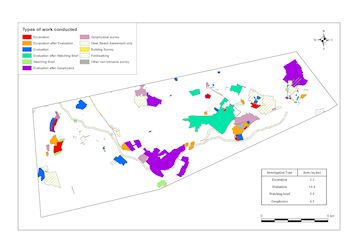
Most HERs distinguish between three types of record: 'events' (discrete episodes of archaeological investigation, such as excavation or building survey), monuments (i.e. types of archaeological site); and sources/archives. We were interested in modes and scale of investigation, so we entered relevant events into the GIS, allowing them to be analysed by event type, size and investigating organisation. In most cases these records provided a GIS boundary 'shapefile' for the limits of the investigative event, which enabled us to quantify what types of investigations were being conducted and on what scales (Figure 4). However, we wanted to be able to think at a more detailed level, showing actual features as recorded by the excavators or surveyors. Our next step was therefore to visit the investigating organisations to obtain their digital phased site plans. Our objective was to assemble all the relevant data, convert it into GIS-usable form (where it is not already in that form), integrate it within the GIS and then analyse these results, mainly in terms of the overall spatial and chronological patterning of features such as trackways, fields and settlements. The GIS software used was ArcGIS 10.1 and data management employed both Microsoft Access and Excel.
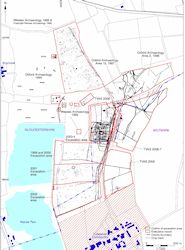
We were aware that the exact formats and recording methods of these data were likely to vary between investigating organisations and from site to site, but we believed (rather optimistically as it turned out) that most of the results of this work would be available in digital form; we assumed that GIS-ready phased shapefiles or CAD files of site plans were created routinely during the post-excavation and publication process. This assumption proved to be incorrect. Visits to commercial practices and searches of their digital archives showed that few sites have the sort of GIS-ready data available in an immediately useful format, but the data did exist; when digitised and made consistent the work of different practices could be fitted together in such a way as to enable views of entire excavated landscapes. In areas of continuing development, such as successive extensions of gravel quarries, it is important that new archaeological work takes full account of what was found previously, possibly by a different organisation, in adjacent or nearby areas (Figure 5). Because of a lack of integration of existing data, this is often not easily done at present. However, by combining digital (or digitised) site plans we can produce detailed views of the whole archaeological landscape. As well as being of interest to researchers, this is potentially of great value to archaeological practices and local authority archaeologists who are aiming to make the archaeological input to planning decisions as rapid and as soundly based as possible. Access to integrated GIS information of the kind described should assist greatly with this. Thus, a key outcome of our project is a series of suggestions for how data flow and curation could be improved for the future.
A major improvement would be that all future deposition of data to the HER includes not only the GIS shapefile of the investigation boundary, which has become standard current practice, but also digital phased feature plans in a format that can be readily (or easily modified for ready use) integrated into GIS. This should involve as a minimum:
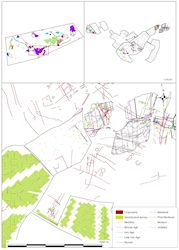
The first of these is the most basic yet often most neglected – the georeferencing of any digital plans. This permits the accurate integration of fieldwork work carried out by different organisations, allowing (for example) features only partially seen in one excavation to be understood over their entire length (Figure 6). Whether this takes the form of CAD .wld files or any real world coordinate system, plans without this type of referencing are problematic. Firstly, the organisation that has carried out the work is in the best position to know the precise geographical coordinates of the features and interventions, and therefore can produce the most accurate georeferencing if it is done at the same time as the illustrative figures are produced for the client. This might also include linking tabulated phased feature information with appropriate CAD layers. Secondly, the curators of the data (HERs, the National Monument Record (NMR) and the Archaeology Data Service (ADS)) should not have to bear the burden of georeferencing all incoming digital data in order to place them within the single GIS. While a degree of this will need to occur with the already extant backlog of held digital data, there is no need to add to the backlog when the remedy is relatively easy, and really just a matter of good professional practice. Digital plans showing at least the major excavated features, and linked dating information (or, alternatively, phased digital site plans) are also important for making the data readily useable.
Beyond these basic requirements, we feel that flexibility in data formats is important. This is partly because computer hardware and software changes regularly, but also because commercial archaeological work is carried out by organisations of varying size, some without the resources to support a specialist geomatics unit or to invest in the often costly software required for 'high-end' GIS and CAD manipulation of data. However, some of these limiting factors can be mitigated by the use of open-source programmes and 'free-ware', which should allow for some standardisation of geo-referenced site data.
As an early result of our project, both Gloucestershire and Wiltshire County Councils have begun requesting that archaeological practices deposit more detailed digital data in a form suitable for GIS. At the time of writing, the level of positive responses has reached nearly 50%. We are confident that, as the benefits of integrating phased digital feature plans become apparent, then that figure will rise. A presentation given at the 2013 Institute for Archaeologists (IfA) conference generated a great deal of interest both from HERs and commercial practices in other areas of the country, keen to discuss how they would benefit from having such a GIS resource for their region. It is also important to keep in mind that the digital spatial data created for the grey literature or published reports are a part of the site archive, and as such should form part of the archival deposition as well as the submission to the relevant county authority. The exact method of dissemination of the data still needs to be considered, in light of the responsibilities of the HERs and curatorial bodies; however, this is not an insurmountable hurdle and the channels of communication and spirit of teamwork engendered by this pilot project will likely lead to workable solutions.
When the National Mapping Programme was first suggested in the last century, there was some incredulity that so much data from so many diverse sources could possibly be brought 'under one roof' (R. Bradley, pers. comm.). When, however, the benefits of having such a resource were seen, these perceived stumbling blocks were quickly overcome and a tool of great value was created. It is our hope that such will be the case with the compilation of this mapping data in areas of intensive investigation.