Any artistic process involves a level of observation that goes beyond the glance. To create a painting, print, drawing or film, a great deal of time goes into really looking at the subject, to reach beneath its surface so that the essence and character can be transferred to a medium and communicated anew. One of the real advantages of geophysics is that it allows the time to be in the landscape. It involves an element of standing and looking as tapes wait to be moved, to cross the landscape back and forth, absorbing each lump and furrow, to revisit an area with different techniques, at various times of year and day. In this way, geophysicists have the opportunity to gradually learn the surface of the landscape, giving space for it to take shape in their minds. The collection (as well as the processing and interpretation) of data can be considered an act of repeated visiting of, and familiarisation with, an archaeological landscape. Working with geophysical data, we form understandings through 'repeated motion over a local terrain', an 'earthbound' geography of archaeological landscapes (Lorimer 2006, 499).
At the end of the day, when the geophysics data is downloaded, mapped in, and shows up on the screen, it is no longer just data. It knits the noise and quiet of data with a growing understanding of place. It is a collision and joining together of the data of the underworld with the ongoing liveliness of landscape. The data become permeated with a growing familiarity of the site. Past and present come closer together, and for the attentive geophysicist, the data become animated.
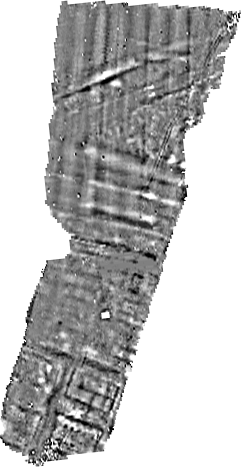
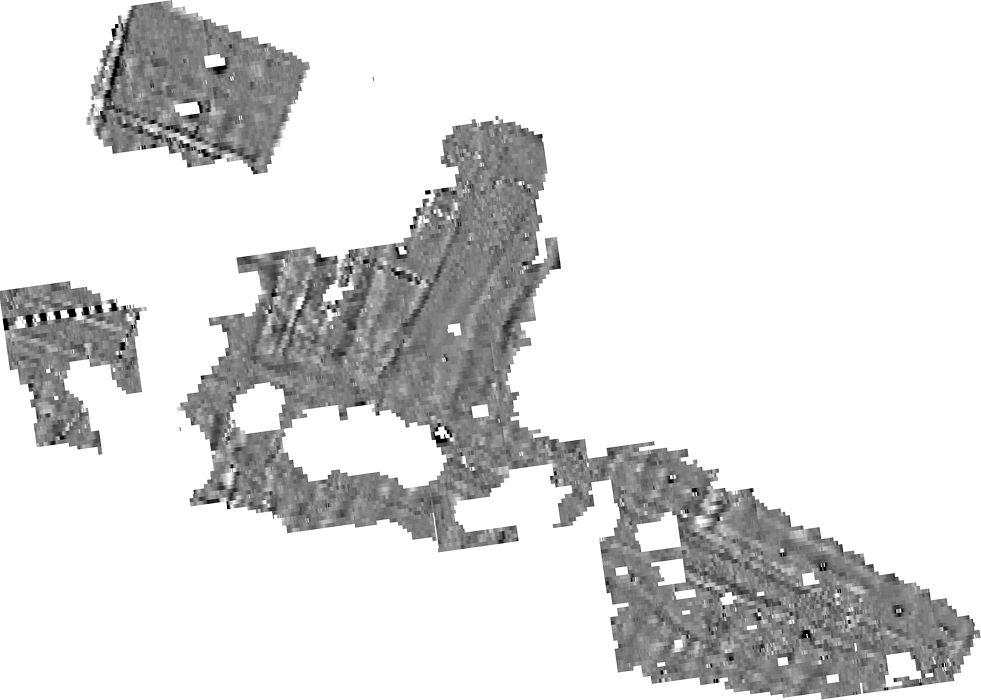
Processing geophysical imagery is an action of transformation, whereby mathematical algorithms are applied in various ways to create a clearer representation of the archaeology (Figure 1). The process of shifting emphasis is very like the process of drawing or painting, whereby subtle use of colour, tone, and layout is used to draw out a specific aspect of a landscape or seascape. To process the data well requires a combination of understanding the mathematics and physics of the dataset and programming, as well as a practised eye to ensure that the archaeological features show up clearly in the image itself. The geophysicist feels their way through the data, subtly tweaking it to achieve clearer results. In this way, the data can be processed to create different images, as alternative processes are run and outputs used.
Interpretation is a multi-purpose process. It is a process of looking and thinking through what aspects of geophysics really mean in order to find the best way of representing them; of considering the balance between simplicity and subtlety; communicating ideas to different audiences. As such, interpretation of archaeological landscapes in geophysical imagery is a process of thinking about what can be seen and what it means. An interpretation drawing is a series of features traced from geophysics, sometimes combining multiple images made using different techniques. To create these traces, lines are drawn over the feature. But sometimes there is doubt: a line is taken away, added again in a different place or given a different form. It is through this process that the interpreter decides whether or not the feature is real, and whether it will become part of the archaeological narrative.
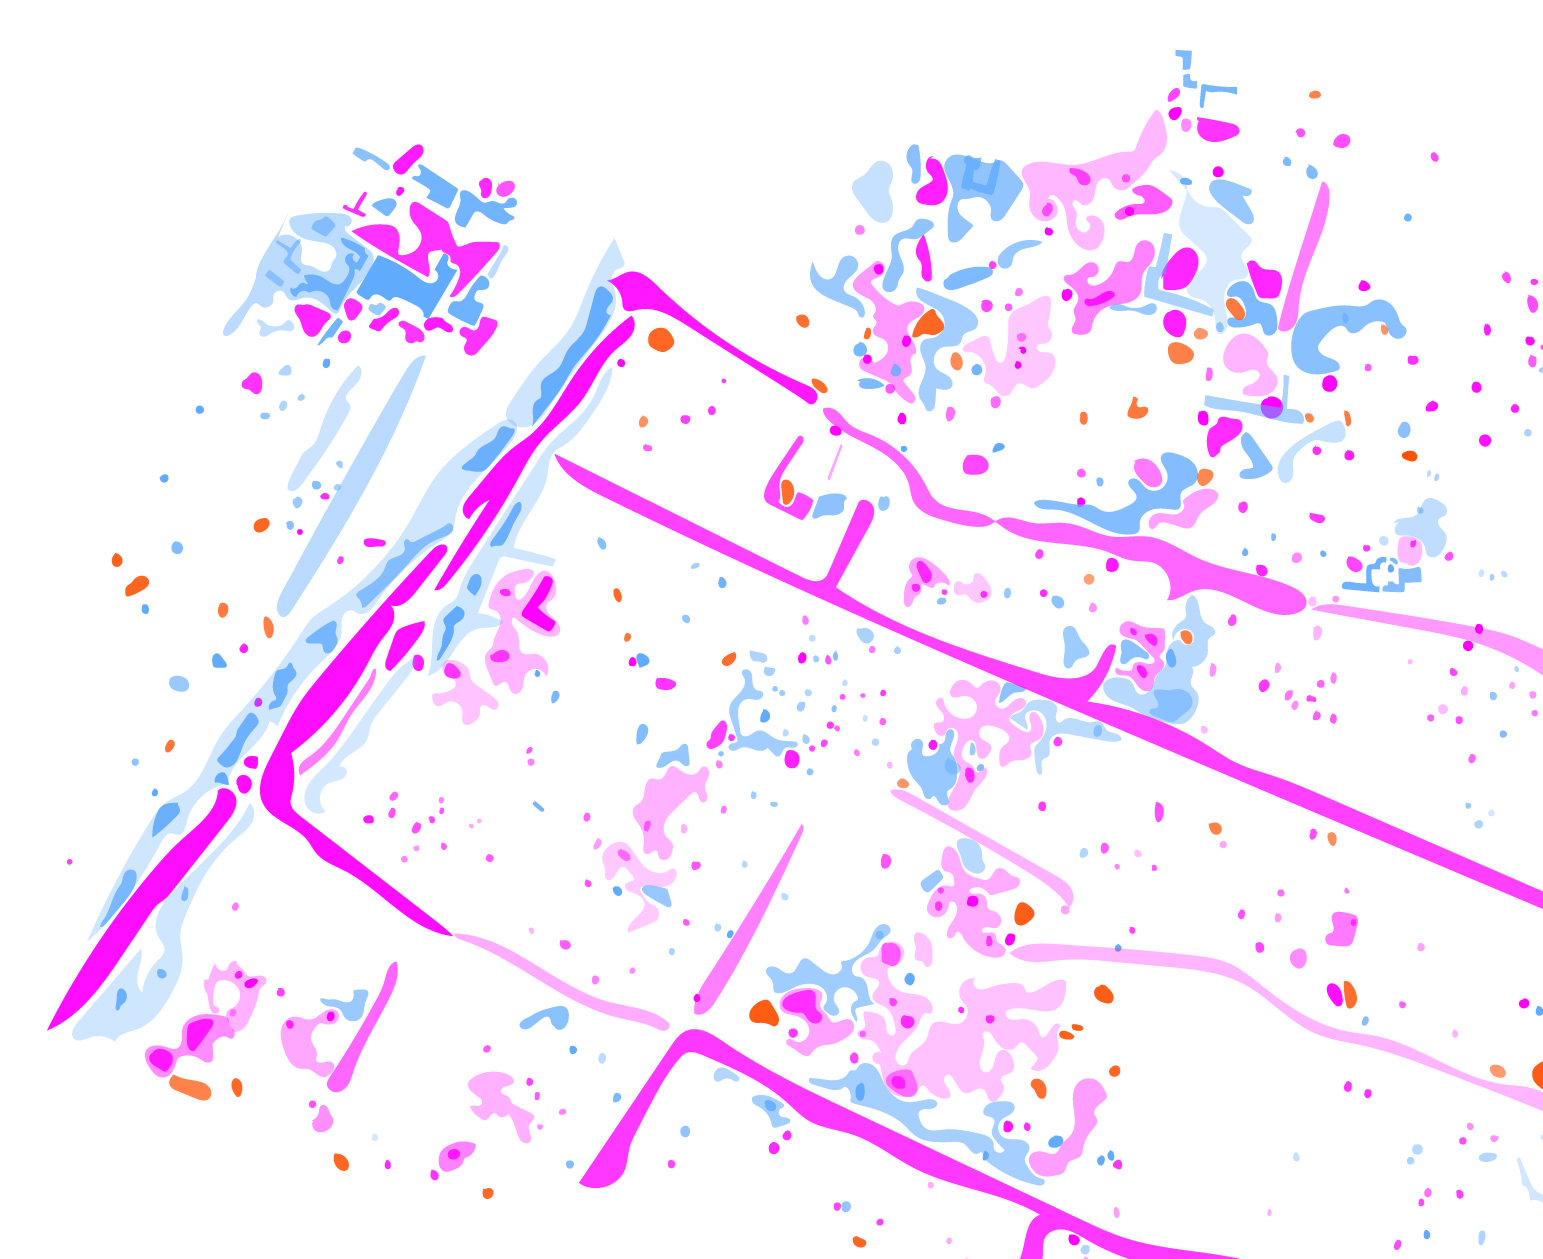
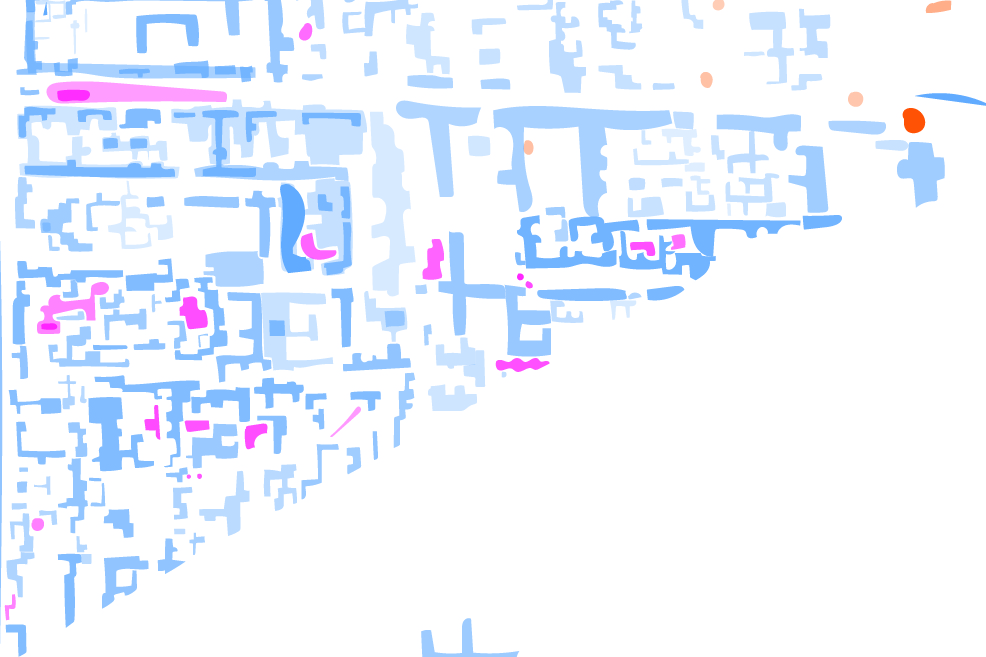
But what of the line? How can a line be made to communicate the form of the feature, its strength and relationship to other features, the confidence of its interpretation? How does the interpreter give a simplified, clear view of the archaeology while also showing its complexity? The interpretations of Aldborough Roman Town shown in Figure 2 are the results of my own long consideration of this particular dataset, as well as of years of experience of interpretation on other archaeological sites. It is my own individual style, something those interpreting geophysical data all develop. Although there are certain traditions around interpretation drawings, each practitioner has a slightly different style depending upon their illustration skills and ideas as well as their experience and ability to understand geophysics. There are small 'schools' of interpretation styles, where those with less experience have learnt from someone else, often adapting the same techniques, layouts, etc. These styles may evolve as each person finds new ways of solving problems for different sites. If we see these tracings and lines as a form of mark making, an interpretation image is very like an artwork: a process of choosing what and how to represent, what story to tell, and how the artist develops their own style for communicating this.
Internet Archaeology is an open access journal based in the Department of Archaeology, University of York. Except where otherwise noted, content from this work may be used under the terms of the Creative Commons Attribution 3.0 (CC BY) Unported licence, which permits unrestricted use, distribution, and reproduction in any medium, provided that attribution to the author(s), the title of the work, the Internet Archaeology journal and the relevant URL/DOI are given.
Terms and Conditions | Legal Statements | Privacy Policy | Cookies Policy | Citing Internet Archaeology
Internet Archaeology content is preserved for the long term with the Archaeology Data Service. Help sustain and support open access publication by donating to our Open Access Archaeology Fund.