Cite this as: Christmas, J. and Pitts, M.E.J. 2018 Classifying and Visualising Roman Pottery using Computer-scanned Typologies, Internet Archaeology 50. https://doi.org/10.11141/ia.50.14
Different forms or shapes of pottery are often subjectively classified into a small set of useful vessel categories (e.g. 'cups', 'plates' and 'bowls') in order to facilitate the comparison of pottery assemblages. The assignment of pottery forms to the different vessel categories may vary according to the site, the region, the period, or the specialist responsible for classifying the pottery, making direct comparison of the assemblages problematic. Although this subjective grouping of pottery shapes is usually accompanied by the more objective classification of vessels using specific type-series, most type-series, with the exception of wares with more universal circulation such as terra sigillata, only cover a limited region, typically focused on a single city. The vastness of the Roman world makes it desirable not only to compare styles and circulations of pottery within regions and provinces, but also between provinces in a connected empire.
We describe two alternative, objective, methods for grouping pottery forms together based on measures of physical attributes automatically extracted from standardised black-and-white line drawings, and a technique for comparing assemblages based on these measures. We demonstrate these methods using a long-established type-series for early Roman pottery in south-east Britain (Hawkes and Hull 1947), although the method is amenable to the future integration of multiple type-series from neighbouring regions and beyond.
The methods discussed in this article are dependent on data extracted from scanned pottery type-series from older excavation reports (e.g. Hawkes and Hull 1947) that have come to be applied to pottery from sites excavated at a later date. In this established archaeological practice, it is more often the case that newly excavated pottery vessels that can be assigned to existing typologies are listed as such rather than being illustrated again, which would be a time-consuming and costly endeavour – especially with common vessels such as the Drag. 27 or Cam 16. In this practice, only unusual or new forms tend to be illustrated in newer excavation reports, along with vessels discovered in exceptional circumstances (e.g. funerary contexts). One implication of this for the present article is that the scanned images from the original type-series provide a close approximation to the shapes and sizes of the same types of pottery found at other sites (but not conventionally illustrated), but in reality a small degree of variation between the pots should be expected. Another proviso is that the methods described only relate to pottery vessels that can be classified according to an existing typology. That said, there is no reason why the methods described here could not be used to extend and build in concordance between different type-series in the future.
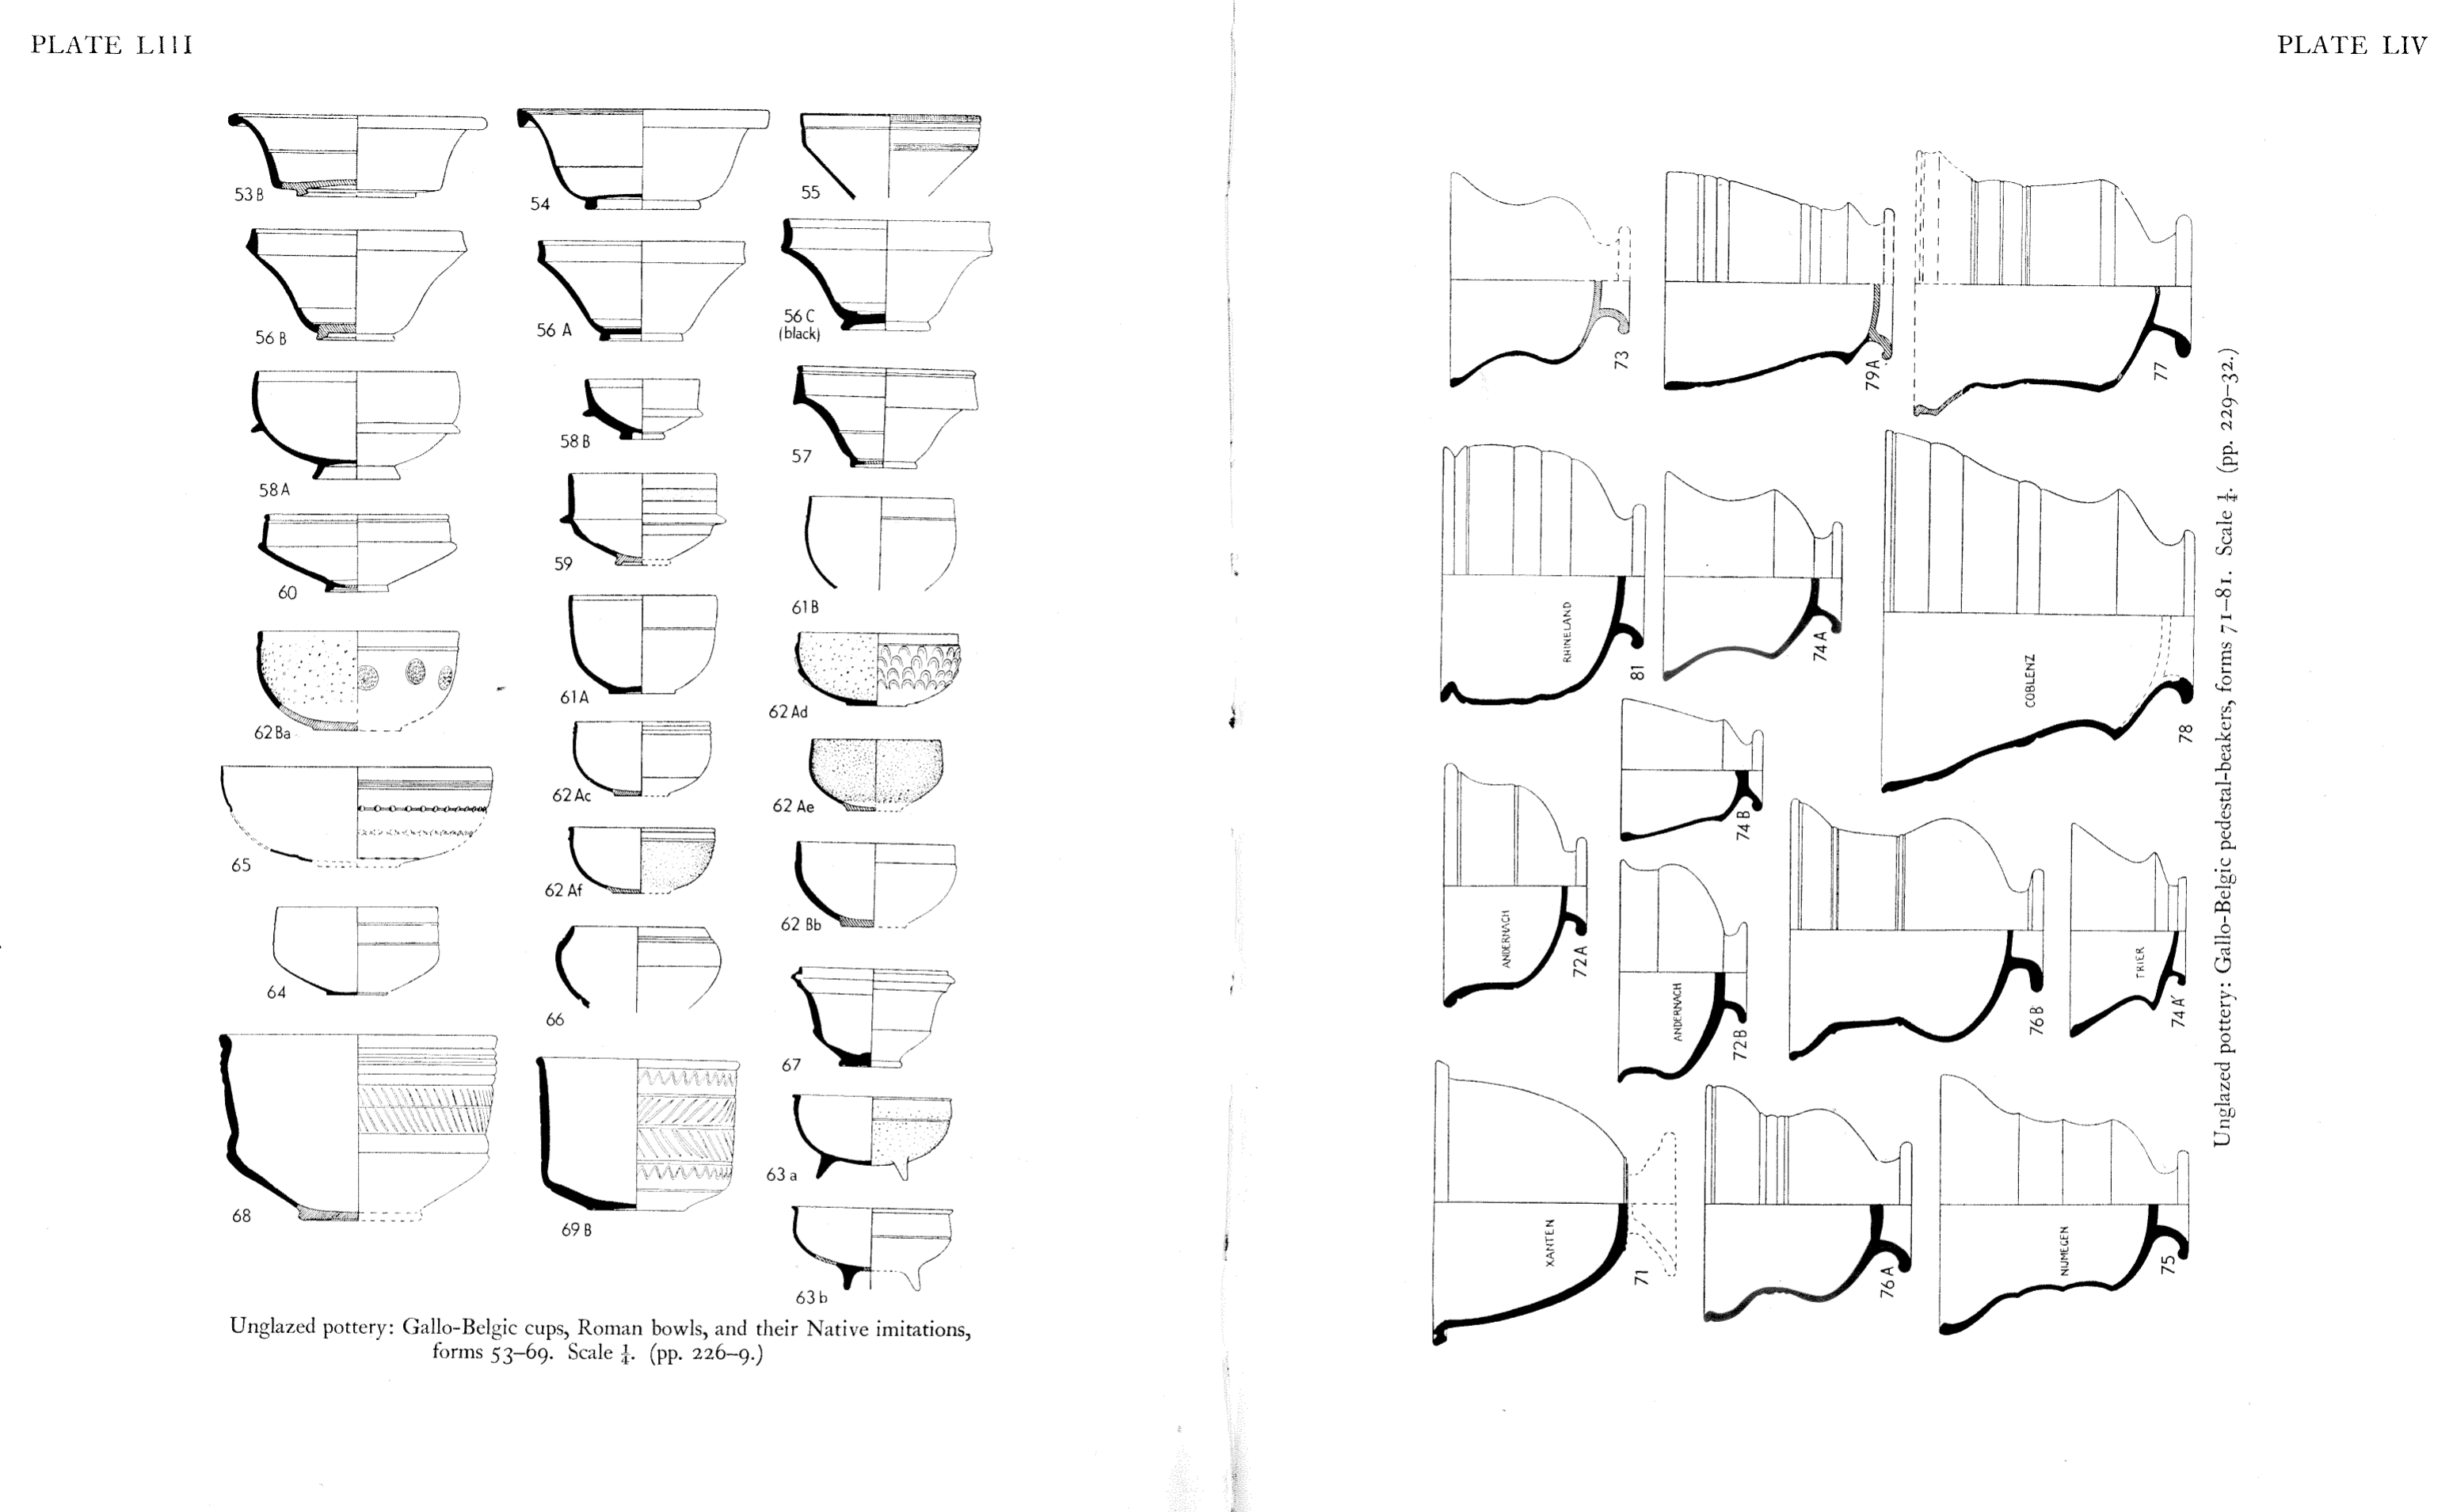
The standardised pottery drawings shown in this article are automatically extracted from scanned pages of the Camulodunum type-series (Hawkes and Hull 1947), an example of which is shown in Figure 1. The automated process (a custom-written computer program) locates discrete regions in the page and extracts them into separate pottery images. From these segmented images, a number of different measures is automatically extracted.
The size of each pottery image (in pixels) is dependent on three things: (a) the size of the original pottery vessel, (b) the scale of the original drawing, which for the Camulodunum series is either 1/4 or 1/8, and (c) the process by which the pages were digitised. The unknown effect of the latter means that although we can directly compare the sizes of the segmented images extracted from a single page, we are less secure comparing between pages from the same book, and direct comparison between images extracted from different books or using different scanning methods is not possible. However, we can compare all these different sources if we base the comparison on unitless measures; for example, we may compare the proportions of pottery vessels (width divided by height, for example) rather than their size, which would address both (b) and (c).
Suitable measures may then be used in three different ways. Firstly, we make two-dimensional plots comparing selected measures and look at how each of the different, manually classified vessel form groups are distributed within the plots. This procedure allows us to test the usefulness and validity of labels assigned manually by pottery specialists to both groups of vessels (e.g. so-called 'butt-beakers') and individual types (e.g. whether or not the terra sigillata Drag. 27 is best classed as a cup, a bowl, or something else). Secondly, we use histograms of the different measures to compare pottery assemblages found at a range of different archaeological sites, without having to depend on the original form groupings. This method provides a useful means of establishing the degree of stylistic and functional similarity between tableware assemblages from different archaeological sites classified by the scanned type-series. Thirdly, we can use different machine-learning algorithms to locate meaningful clusters of points in these graphs that might lead to an objective means of defining form groups. This procedure may have useful applications in assigning more objectively derived labels to groups of vessels, for example, in establishing clearer boundaries between categories like 'cups' and 'bowls', and distinguishing meaningful sub-groups, e.g. 'hemispherical cups' and 'shallow bowls'.
We start, in Section 2.1, by describing the way the segmented pottery vessel images are extracted. Section 2.2 describes the different measures that have been considered so far, and how unitless measures can be constructed from them, to allow comparisons to be made between the different pottery types. Section 3 looks at how the vessel form groups are clustered in different two-dimensional plots, and how one- and two-dimensional histograms can be used to compare assemblages from different sites. Lastly, Section 3.4 describes the results of the machine-learning algorithms.
Each page image (see, for example, Figure 1) is first separated out into individual pottery vessel images. This depends on a minimum distance between pottery vessels on the page, and is only a first effort at locating the vessel images, often including label text. At this point it is necessary to manually remove extracted images that are not pots, for example, the caption text. Some images are rotated through 90°; in this first effort these were manually rotated to be approximately upright.
The second step is to refine these extracted images into segmented images that identify up to four regions for each pottery vessel:
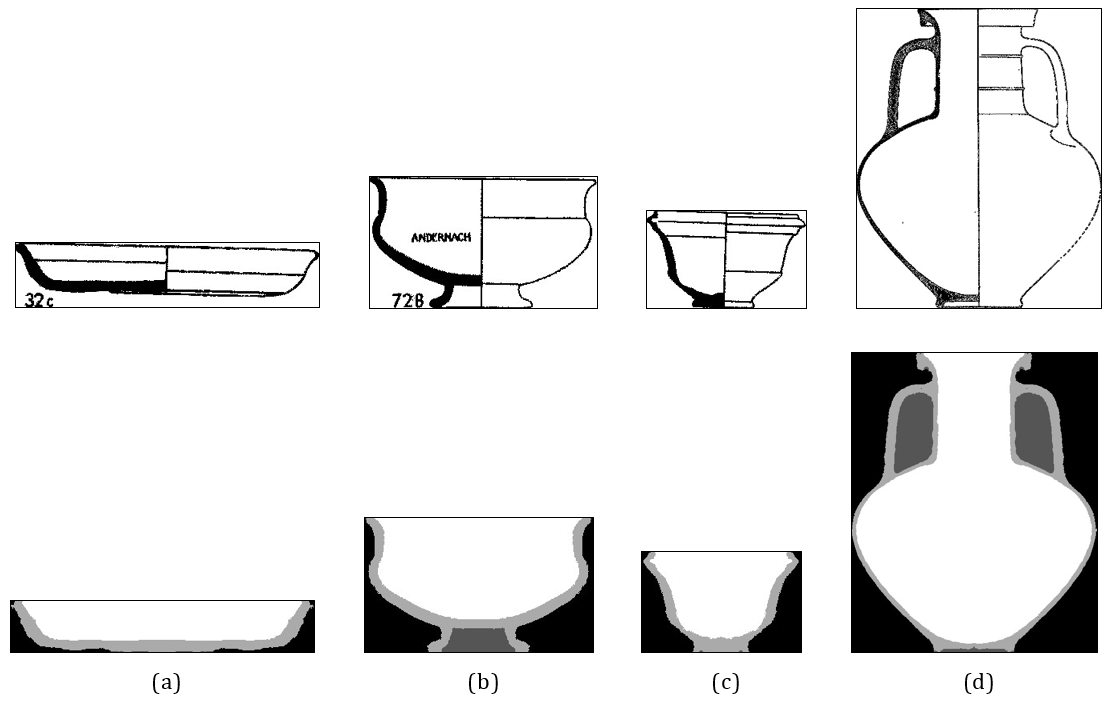
The pottery vessel is assumed to be the largest connected set of 'drawn' pixels in the image; other connected sets of pixels are deleted. This process removes labels and text that lies within the vessel (see, for example, Figure 2b). The segmented image is generated from the part of the image that lies to the left of the vertical centre-line; locating this centre-line often requires the image to be rotated slightly. The left-hand side is tidied up by removing horizontal structure lines and blurring it slightly to fill in areas where the shading is not quite solid, and then its mirror image used to generate the right-hand side. Segmentation is now straightforward: any drawing lines that remain are the structure of the pottery vessel; all pixels that are connected to the right- or left-hand edges of the image are outside the vessel; all remaining pixels must be interior to the vessel. The main chamber of the pottery vessel is the connected, interior region in which the centroid of all interior pixels falls. Finally, the edges of the segmented image are contracted so that the pot exactly fits within the image. Figure 2 shows four examples of pot images with their associated segmented images.
From each of the segmented images a number of different measures may be calculated:
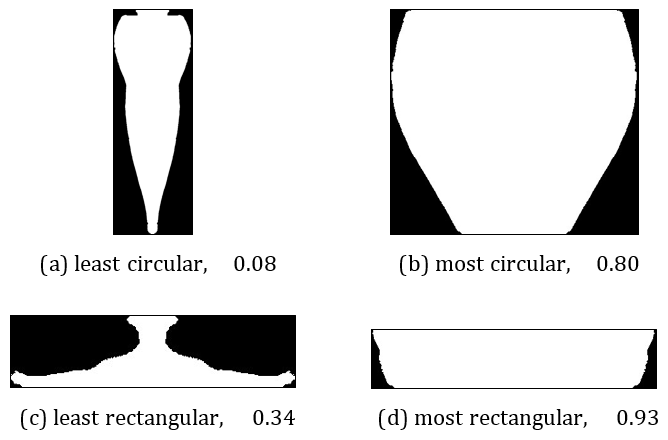
Two of these measures require further explanation. Circularity is a measure, in the range 0 to 1, of how close a shape is to a perfect circle, with 1 being a perfect circle. There are different ways of calculating this; we have used the following definition:
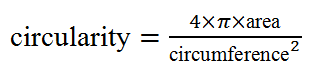 (1)
(1)
Figures 3a and 3b show the outlines of those pottery vessels with the lowest and highest circularity measures. Similarly, rectangularity is a measure, in the range 0 to 1, of how close a shape is to a rectangle. We have used the following definition:
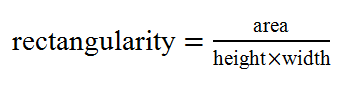 (2)
(2)
Figures 3c and 3d show the outlines of those vessels with the lowest and highest rectangularity measures.
Having calculated a set of measures for each vessel type, we can use them to: compare pottery assemblages from different sites (see Section 3.1); compare the shapes of multiple vessel types (Section 3.2); and investigate the ways that different pottery vessel types fall into the same manually specified form groups and cluster together when different measures are plotted (Section 3.3). Finally, we may apply machine-learning methods to these data in order to arrive at objective classifications of pottery vessels into form groups. In Section 3.4 we briefly describe one of these techniques: k-means clustering.
The comparison of sites in this section uses quantified data from early to mid-first century CE imported fineware assemblages from a range of sites in south-east Britain, previously analysed and fully documented in a study of the material culture of Britain's first Roman cities (Pitts 2014). Coarse wares and other objects have been excluded from the data comparisons, but are included in some of the approaches to classifying variation within the whole Camulodunum type-series. Most vessels are from settlement contexts, but some data derive from funerary assemblages, notably the Folly Lane and King Harry Lane sites (both St Albans), and Stanway (Colchester). For those not familiar with the archaeology of this region and period, several of the sites examined here are in fact sub-sites from different larger settlements. At Colchester, the sites of Sheepen (subject to major excavations in 1930 and 1970) and Stanway may be considered to have originated as part of the pre-conquest (43 CE) stronghold of Camulodunum, whereas material from the fortress and colonia exclusively derives from the post-conquest military and colonial settlements. Likewise, at St Albans the sites of Prae Wood and King Harry Lane originated in the pre-conquest period, whereas Verulamium is taken to refer to the post-conquest city, which forms a contemporary assemblage with the rich Folly Lane burial chamber.
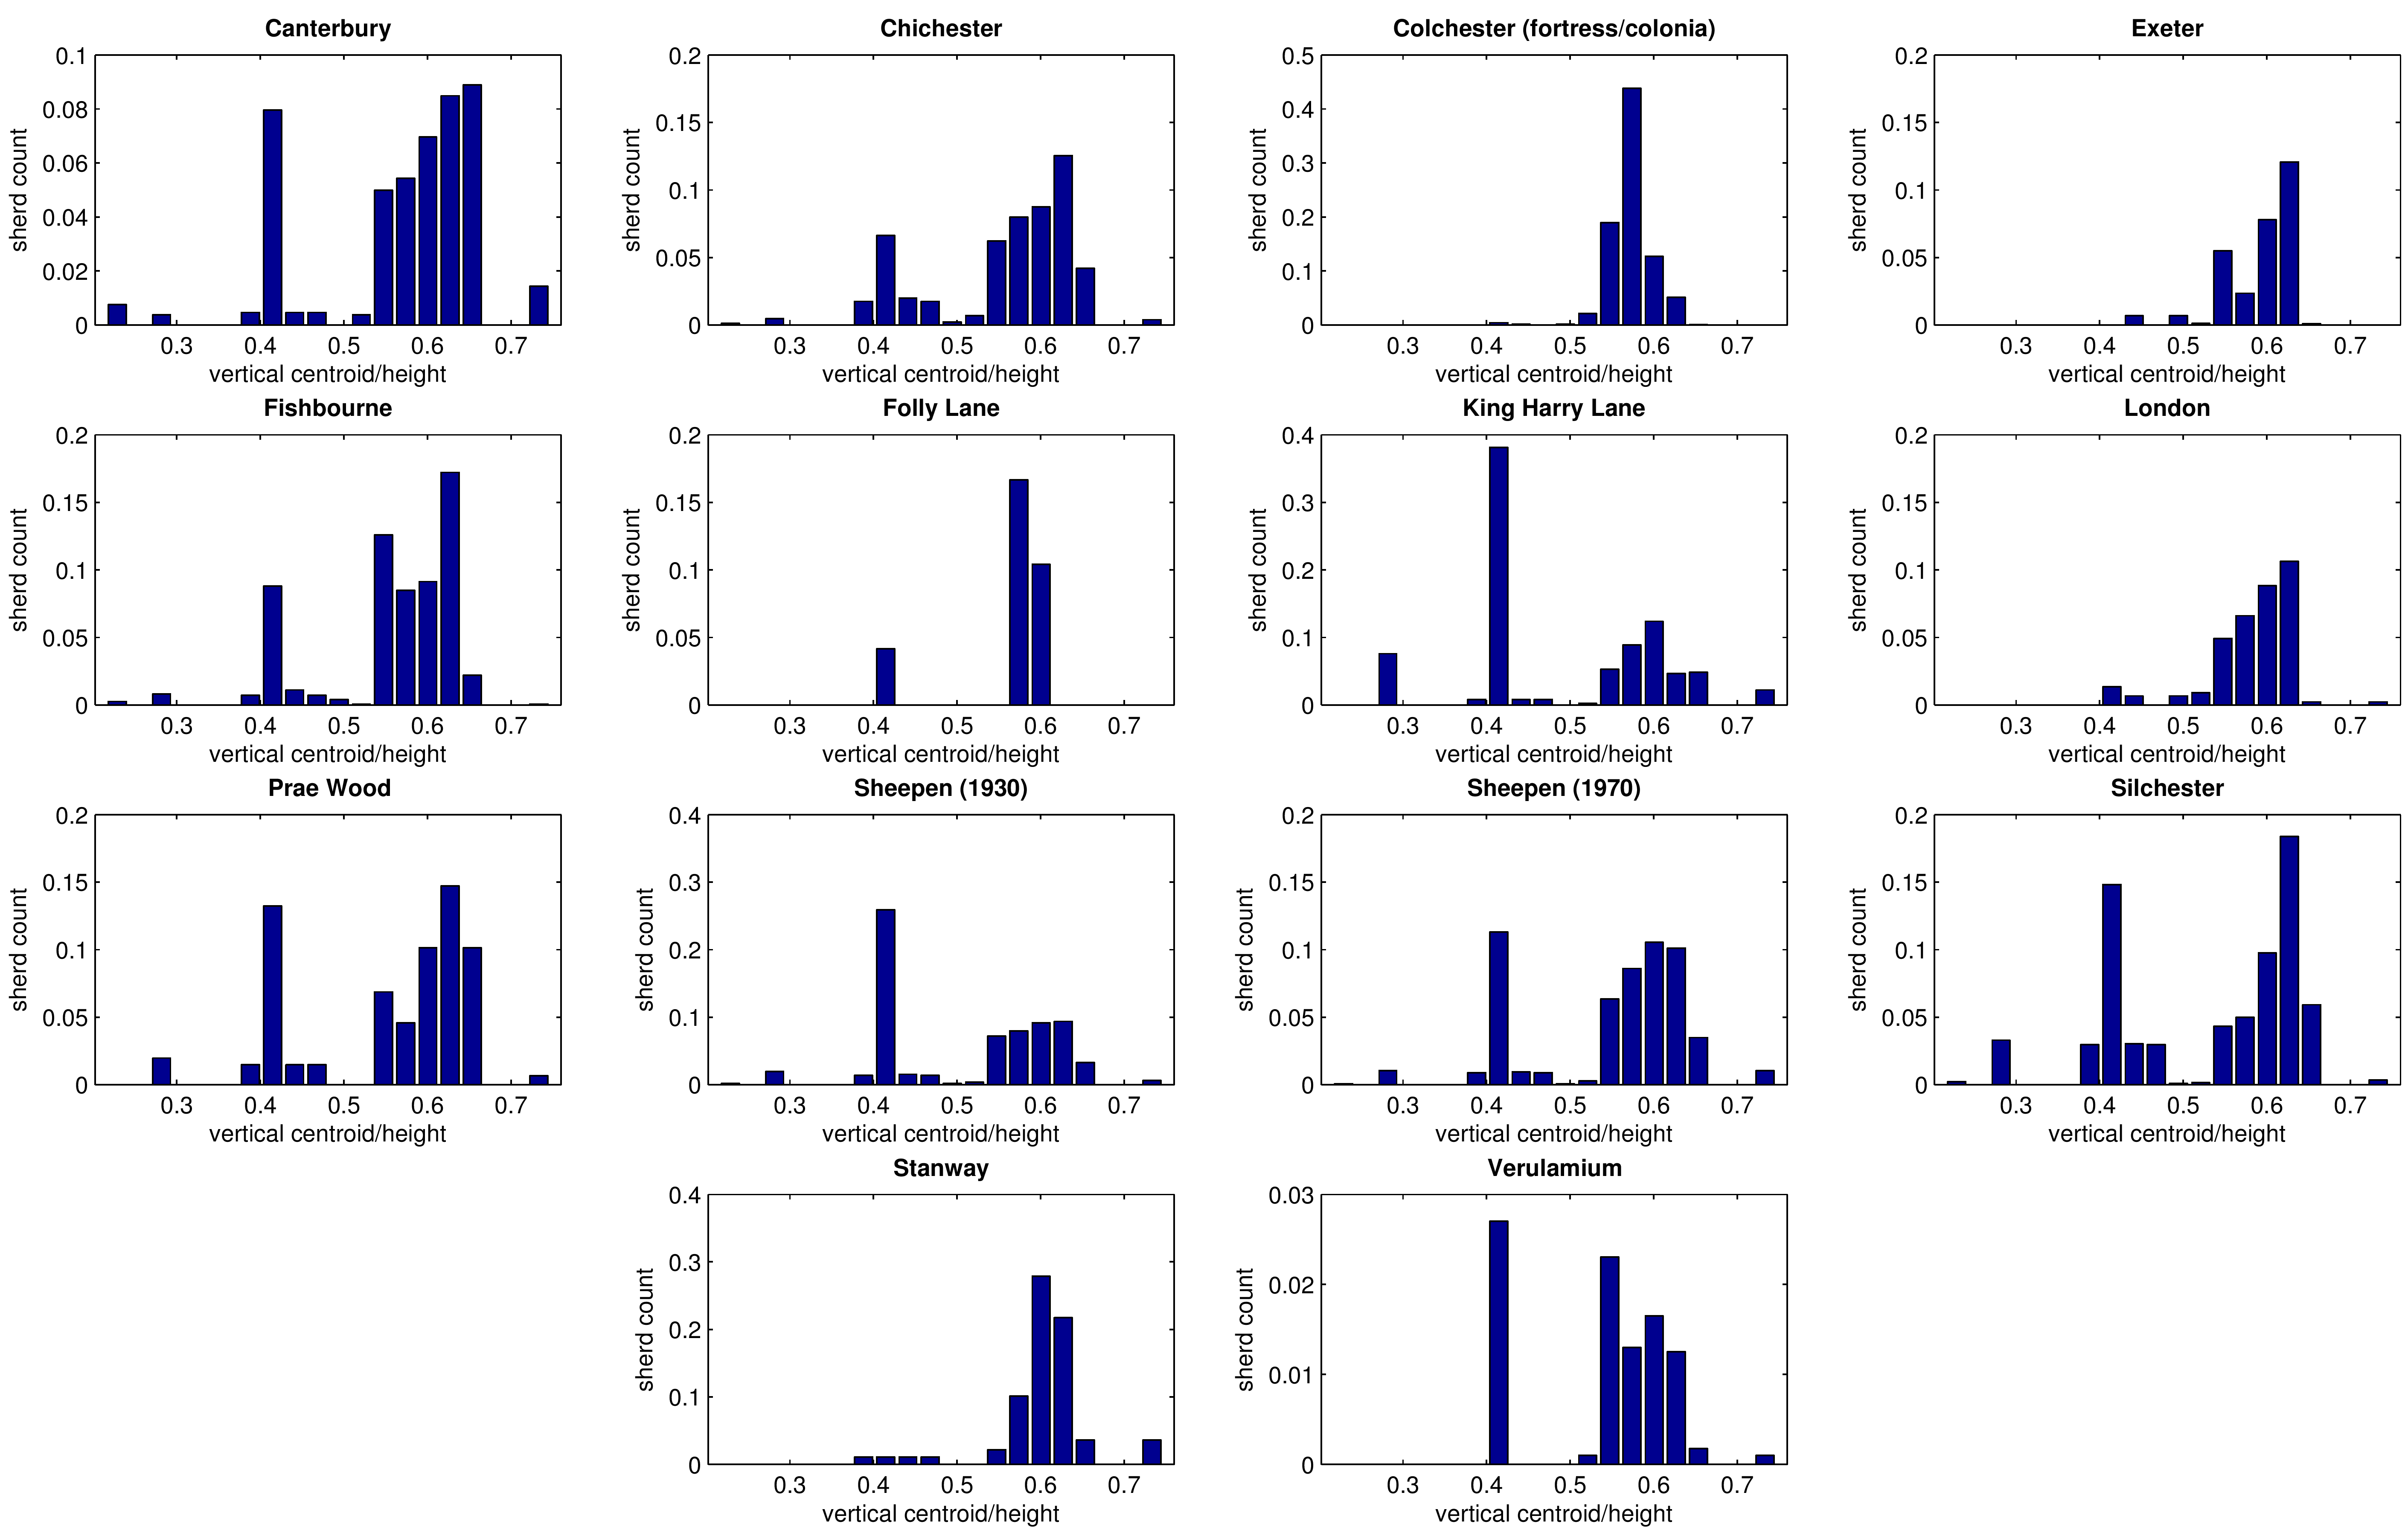
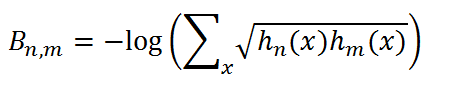
Based only on these extracted measures, we may draw histograms of the quantities of finds for the different sites. Figure 4 shows histograms based on the proportion of vertical centroid to total height of each vessel. By eye we can see that the distributions for some pairs of sites are more similar than others. We may obtain an objective measure of this similarity by calculating the Bhattacharyya distance (Bhattacharyya 1943) between each possible pair of histograms:
 (3)
(3)
where hn(x) is the quantity of finds in the xth bar of the histogram for site n.
The quantities have been normalised before the calculation of the distance, meaning that the total quantity in each histogram is 1. This allows a direct comparison of sites with widely differing quantities of finds, though it should be noted that assemblages with small quantities of finds are less robust, statistically speaking, than those with large quantities.
| Site | most similar site | Bhattacharyya distance |
|---|---|---|
| Canterbury | Prae Wood | 0.028 |
| Chichester | Sheepen (1970) | 0.016 |
| Colchester (fortress/colonia) | London | 0.128 |
| Exeter | London | 0.046 |
| Fishbourne | Chichester | 0.024 |
| Folly Lane | Colchester (fortress/colonia) | 0.249 |
| King Harry Lane | Sheepen (1930) | 0.031 |
| London | Exeter | 0.046 |
| Prae Wood | Silchester | 0.018 |
| Sheepen (1930) | Sheepen (1970) | 0.021 |
| Sheepen (1970) | Chichester | 0.016 |
| Silchester | Prae Wood | 0.018 |
| Stanway | London | 0.093 |
| Verulamium | Sheepen (1970) | 0.062 |
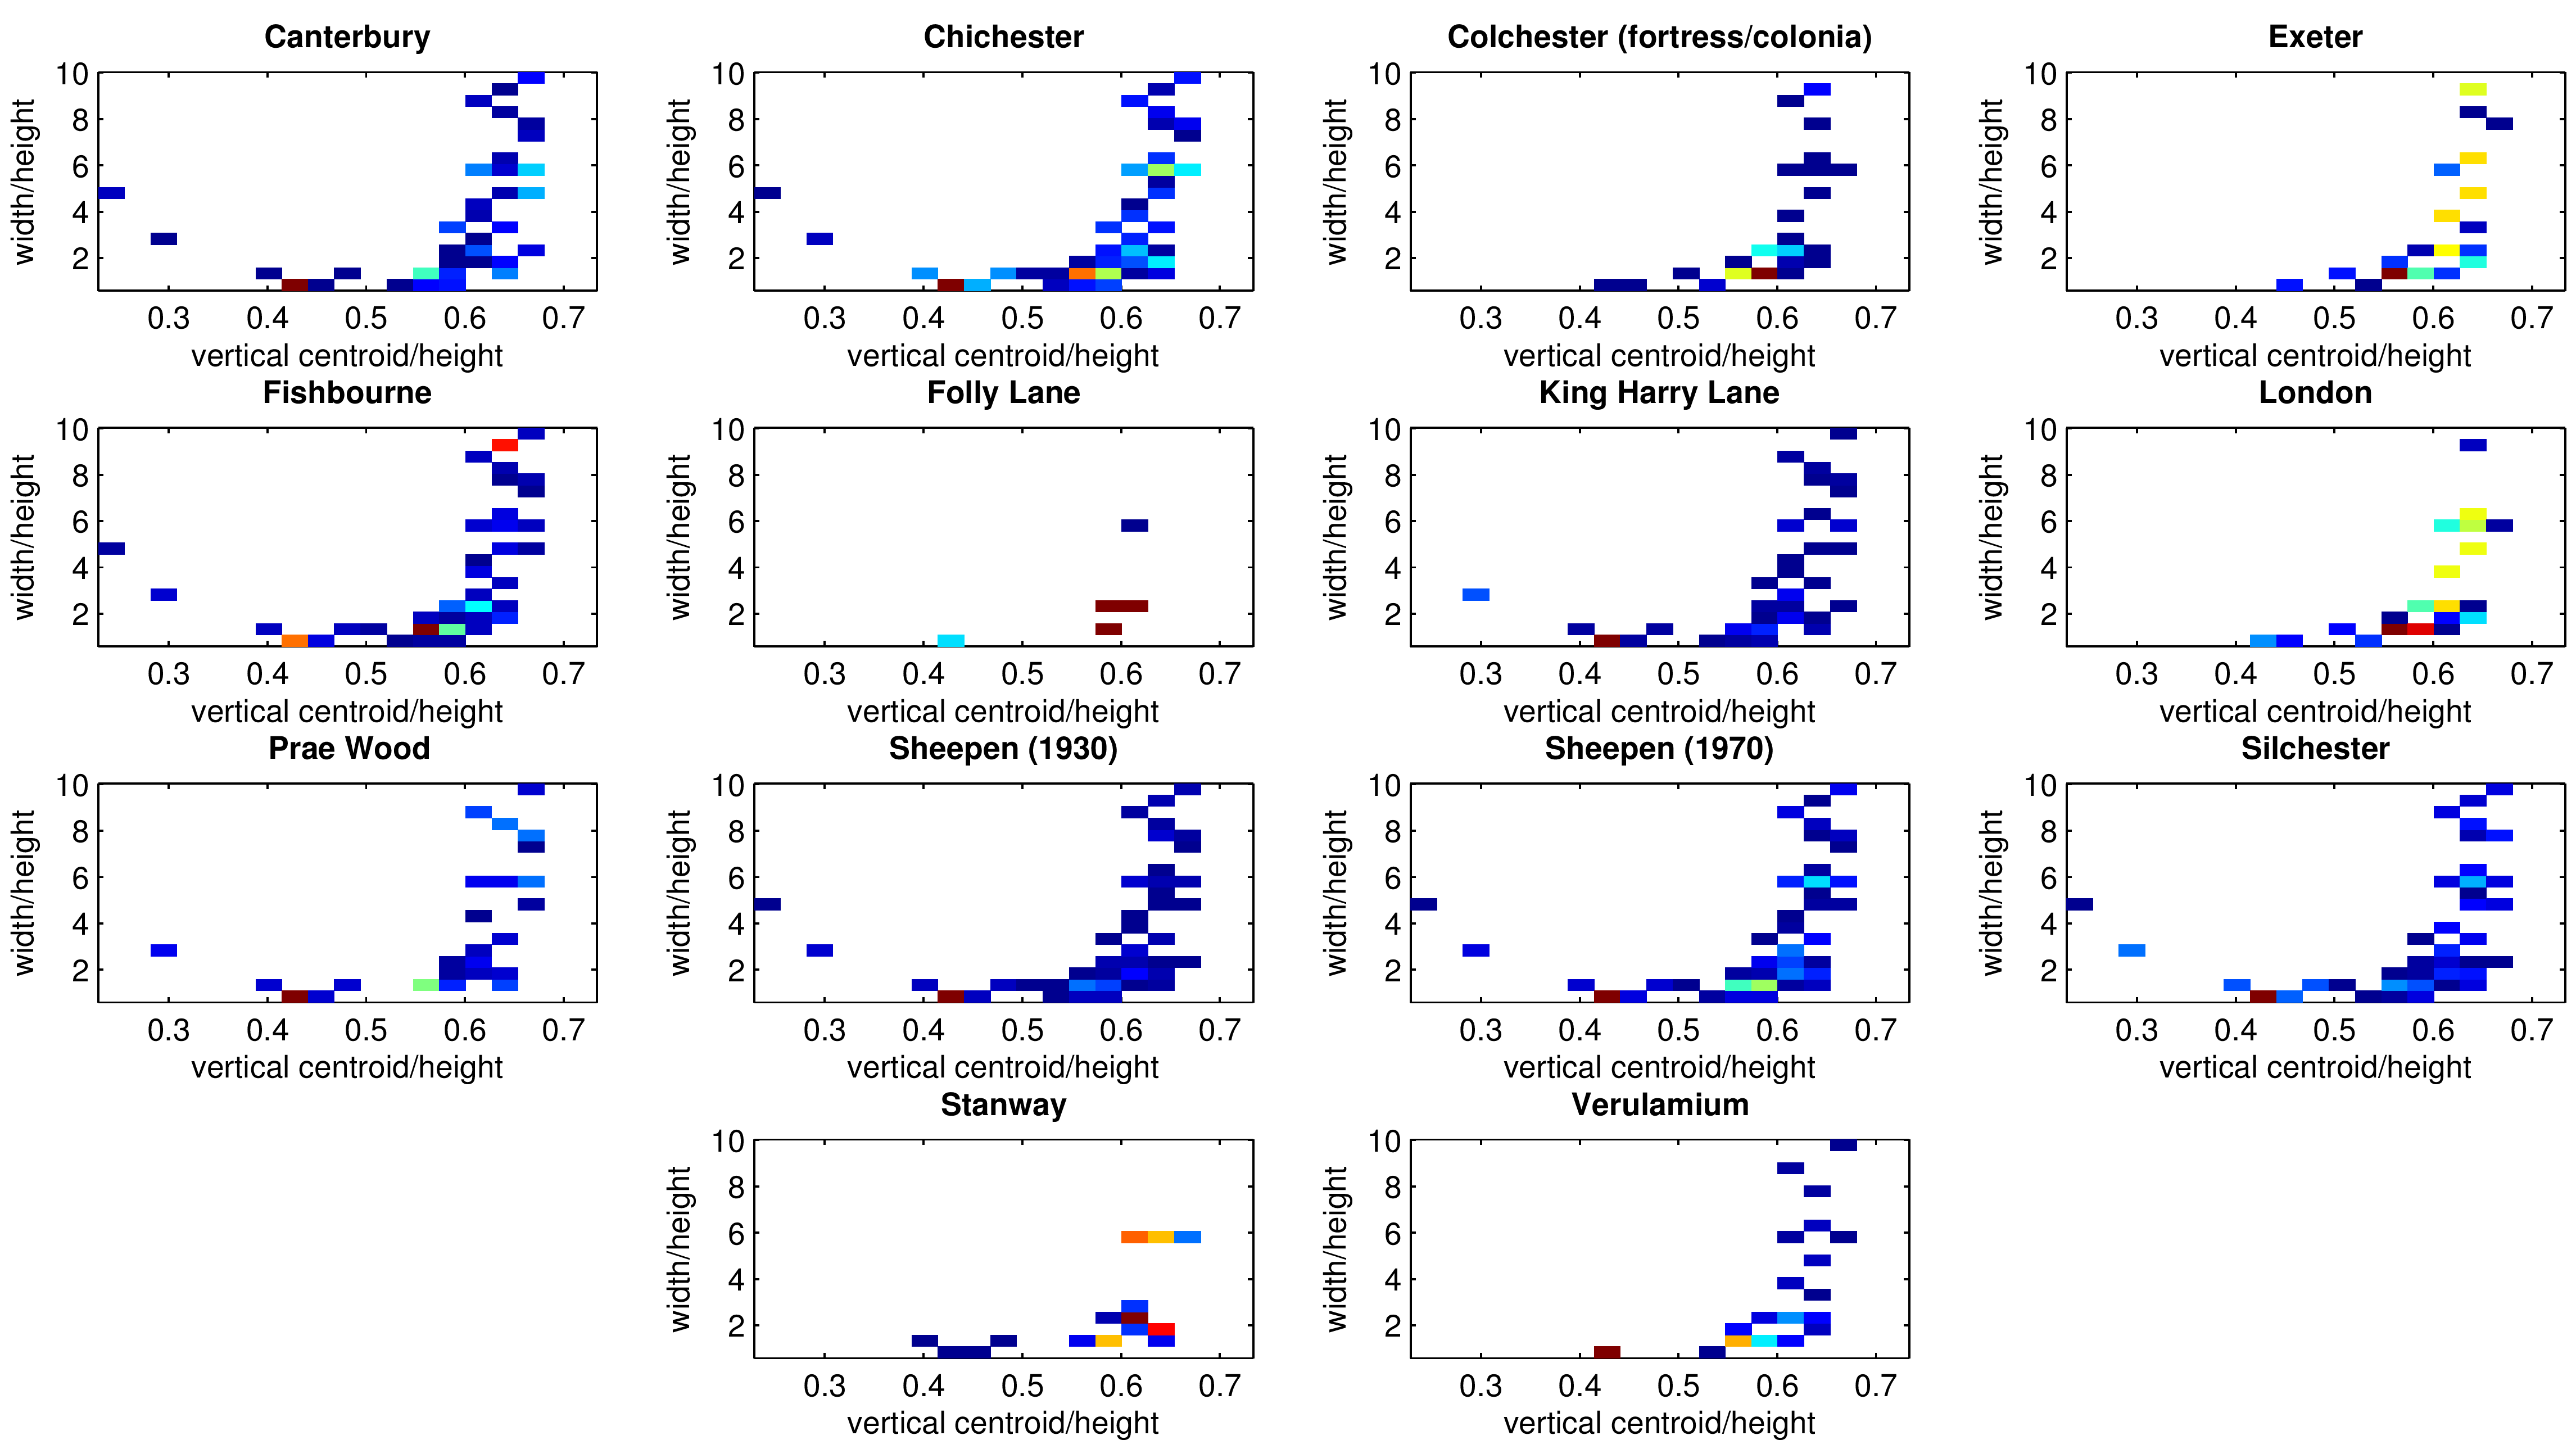
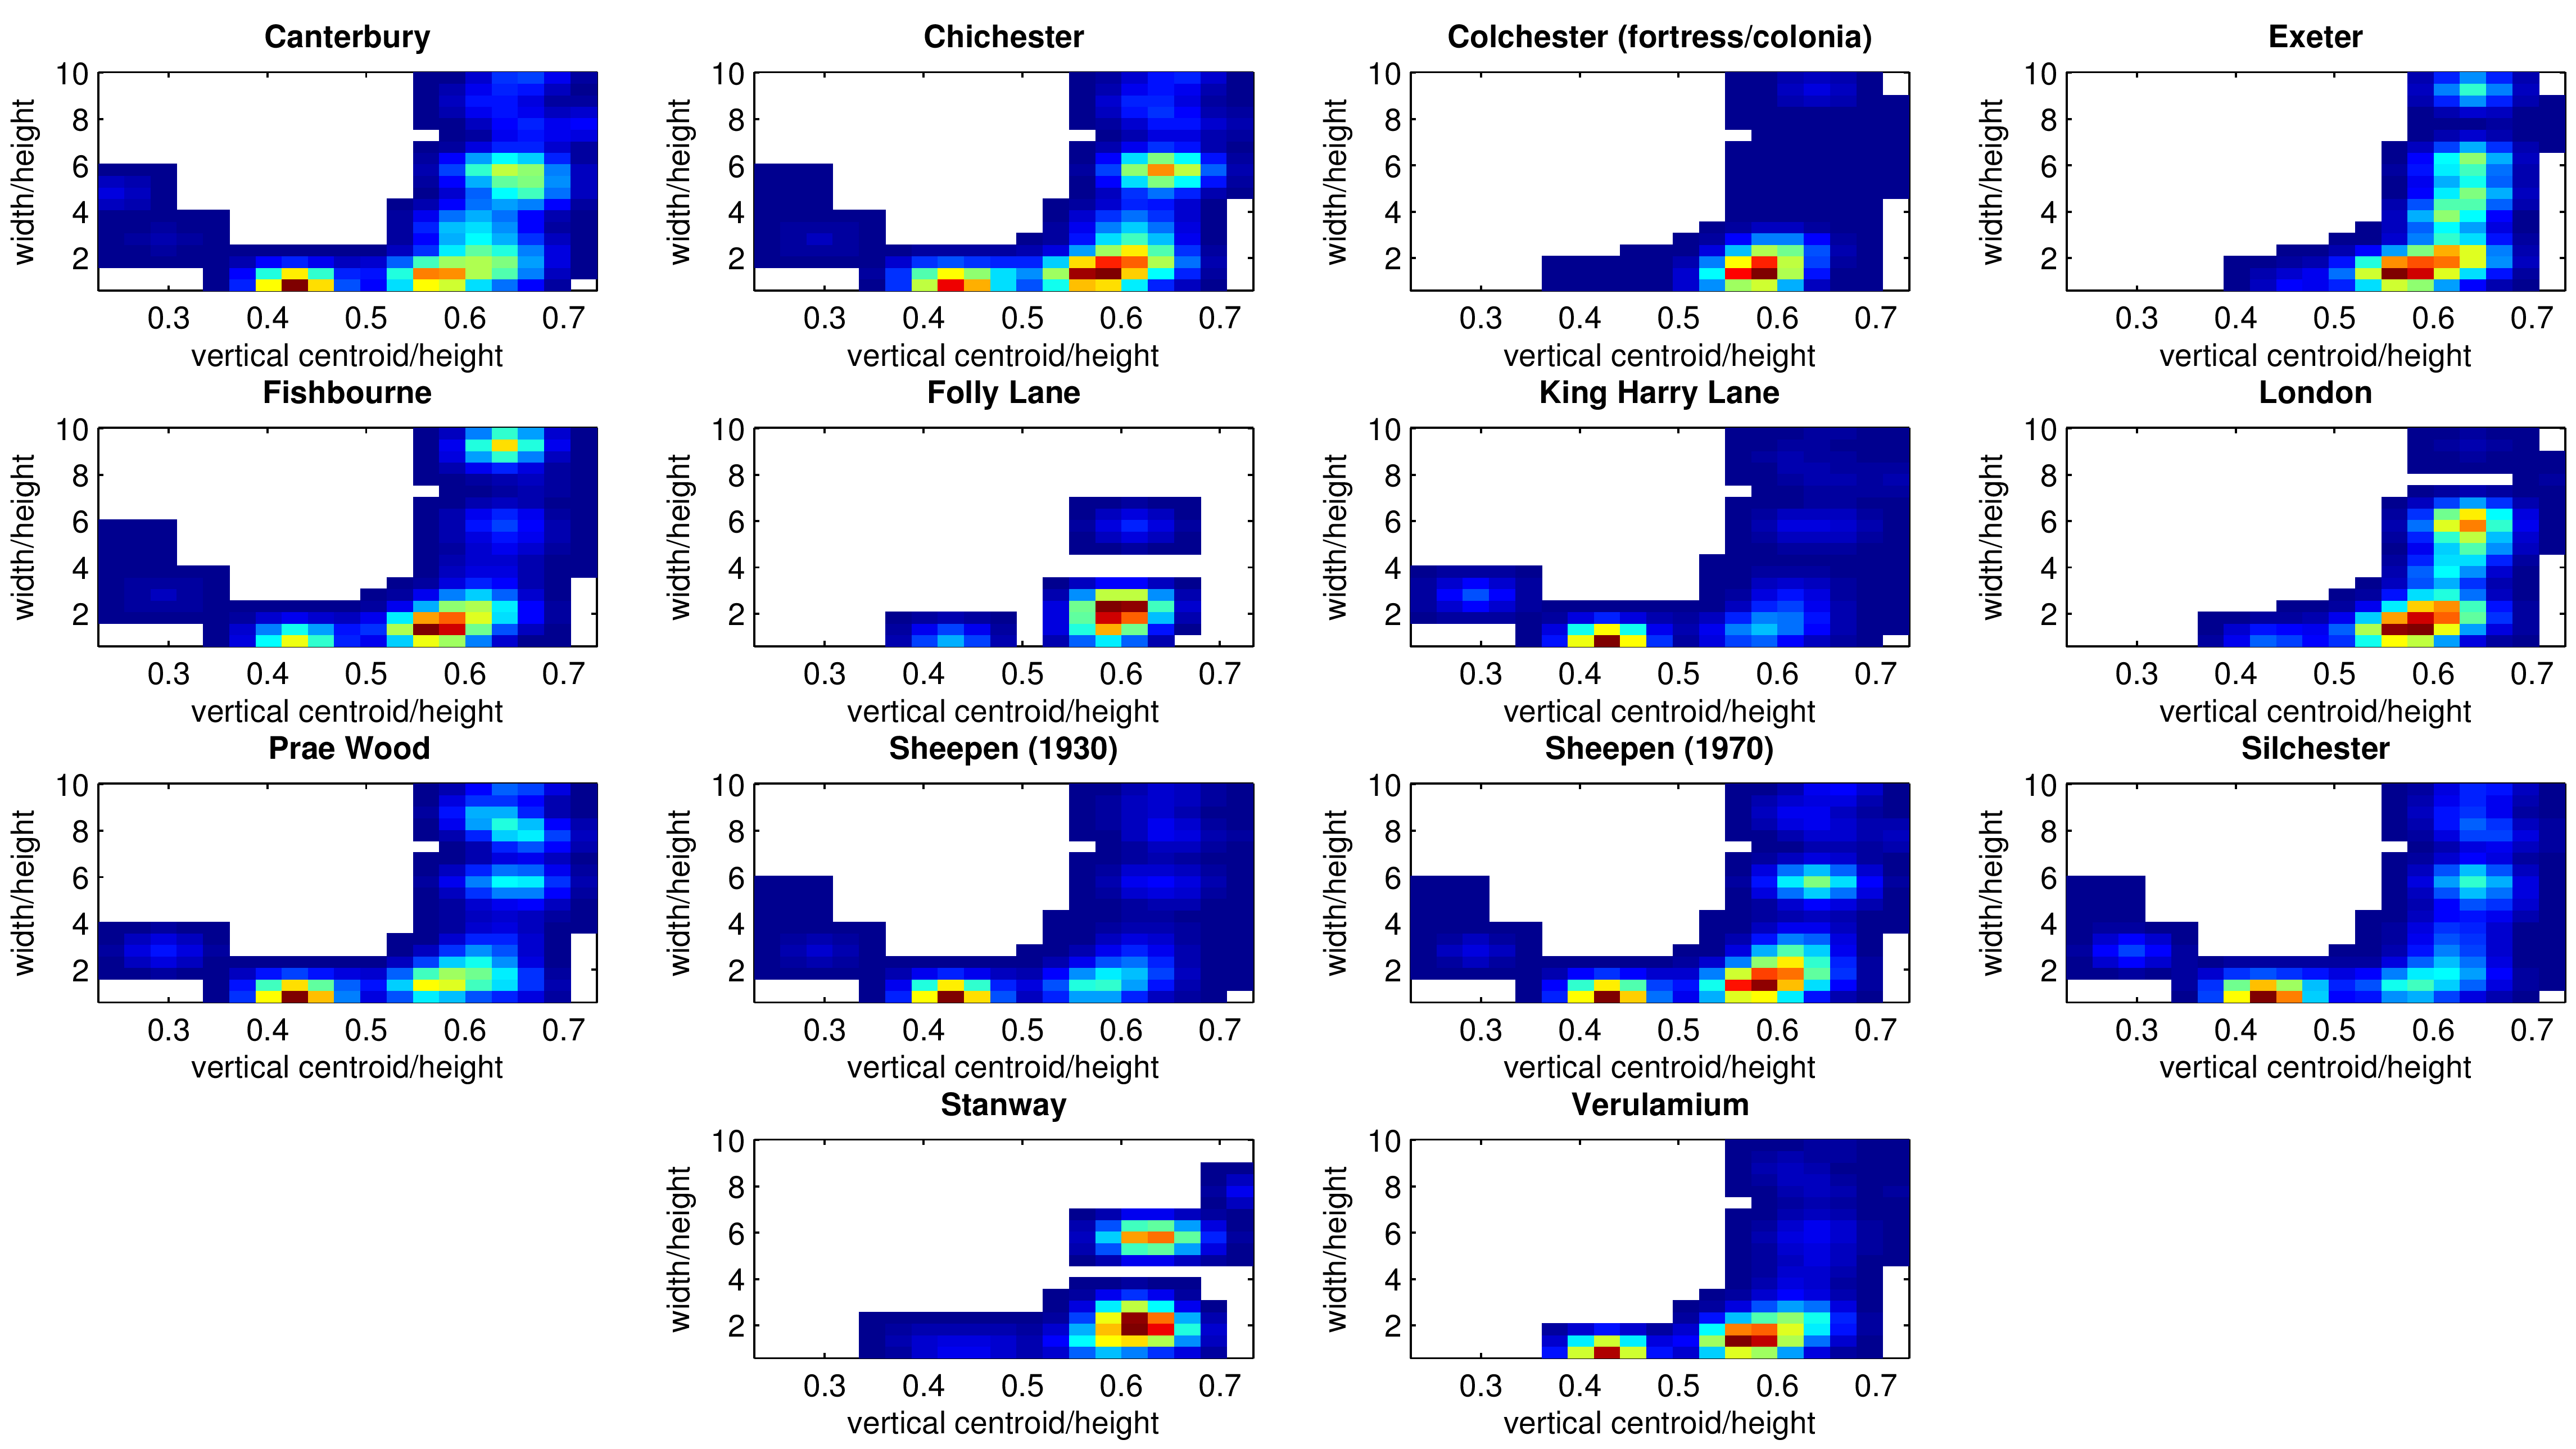
The more similar two assemblages are, the smaller the Bhattacharyya distance between the two. Using this measure, Table 1 shows which site is most similar to each of the sites in the set. We can see that Chichester and Sheepen (1970) are the most closely related pair, while Exeter and London are also closely related. We may also do this using two-dimensional histograms. Figure 5 shows histograms of quantities of pottery vessels, by centroid height proportion (as before) and the proportion of width to height. The colour scale ranges from blue (low) to red (high); white represents zero finds in that range. By eye it is slightly difficult to compare these histograms; Figure 6 shows the same histograms, but smoothed (using a Gaussian filter), which makes it much easier to see similarities and differences.
| Site | most similar site | Bhattacharyya distance |
|---|---|---|
| Canterbury | Chichester | 0.023 |
| Chichester | Sheepen (1970) | 0.011 |
| Colchester (fortress/colonia) | Folly Lane | 0.131 |
| Exeter | London | 0.041 |
| Fishbourne | Sheepen (1970) | 0.046 |
| Folly Lane | Verulamium | 0.127 |
| King Harry Lane | Sheepen (1930) | 0.023 |
| London | Exeter | 0.041 |
| Prae Wood | Silchester | 0.018 |
| Sheepen (1930) | King Harry Lane | 0.023 |
| Sheepen (1970) | Chichester | 0.011 |
| Silchester | Prae Wood | 0.018 |
| Stanway | London | 0.095 |
| Verulamium | Sheepen (1970) | 0.039 |
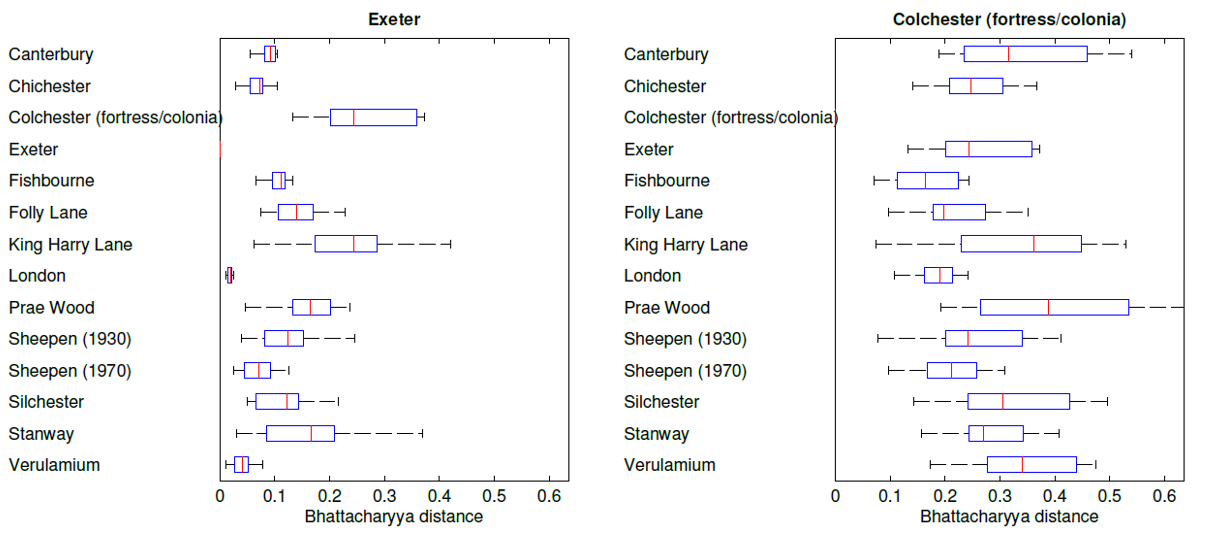
As before, we may use the Bhattacharyya distances to find the most similar sites. Based on the smoothed histograms, these are shown in Table 2. As before, Chichester and Sheepen (1970) are the most closely related pair, while Exeter and London are also closely related. These distances will vary for the different measures, so that similarities between site assemblages will not be consistent. However, we can calculate the Bhattacharyya distances between each pair of sites for each measure (for one-dimensional histograms) or each pair of measures (for two-dimensional histograms) and inspect the results by looking at the spread of distances for each pair of sites. Results from the one-dimensional comparisons for two selected sites (Exeter and Colchester) are shown in Figure 7. From these we can see that London is very clearly the most similar site to Exeter, while for the Colchester site, Fishbourne is probably the most similar, although it is not nearly as clear-cut.
The strong similarities between the Sheepen (1970) site and Chichester, on one hand, and London and Exeter on the other, demonstrate a close correlation with the results of Correspondence Analysis (CA) of different attributes of the same data (Pitts 2014, 143-7, figs 2-3), which separated the same group of sites into two major clusters. The first cluster was defined by sites that had origins before the conquest of 43 CE, including Sheepen and the high-status burials at Stanway (Colchester), Chichester, Canterbury, Fishbourne, Silchester, and St Albans (the King Harry Lane and Prae Wood sites). Figure 4 and Tables 1–2 reveal that this group share common characteristics in terms of quantities of imported finewares with similar vertical centroid/height. The second group that emerged from CA (Pitts 2014) consisted of sites with military and colonial origins such as Exeter and Colchester's fortress and colonia, in addition to other sites that shared a similar artefactual signature, notably London and Verulamium (the Roman town and rich Folly Lane shaft grave, to be distinguished from the pre-conquest sites). While the latter association ran contrary to historical expectations, since neither London nor Verulamium have proven colonial or military origins, their imported fineware assemblages are confirmed in Figure 4 and Tables 1–2 to show affinity with those from other military and colonial sites in Britain in terms of vertical centroid/height.
In general, these results highlight a potentially useful heuristic method for comparing pottery assemblages. The analyses imply that the difference between these two groups of pottery assemblages was not simply one of variations in quantities of vessel types, but one underpinned by quantitatively derived discrepancies in the shapes and volumes of the pots in question. In other words, the two groups were defined by different physical proportions of vessel types with very dissimilar shapes. The consistency of these patterns suggests that different consumption practices may have been involved, or at least opposing styles of consumption involving fundamentally different supplies or selections of pottery shapes. This underlines the likelihood that two broadly defined styles of consumption existed in the first generation of urban communities in Britannia: one characterised by the presence of high proportions of butt-beakers, correlating with pre-existing communities of the south-east, and the other by a focus on dishes, cups and bowls (alone) for military and colonial populations. The high levels of butt-beakers and related forms is evidenced by the spike of vertical centroid/height at a value of 0.4 at multiple sites in Figure 4 (e.g. Canterbury, King Harry Lane and Silchester), which is lacking at sites with known military and colonial origins (i.e. Exeter and Colchester's fortress and colonia). Both kinds of communities had similar access to vessels in the dish-bowl-cup continuum, evidenced in Figure 4 by vertical centroid/heights in the region of 0.55–0.65, which are least pronounced at sites with limited post-conquest activity (i.e. King Harry Lane). These results show that the vertical centroid to height ratio can be a useful addition to the toolbox of more established analyses for assemblages involving standardised pottery from the Roman period (and beyond).
In a couple of instances, assemblages did not fit the overall picture in our analyses discussed above, and outlined elsewhere (Pitts 2014). At one site, Stanway, the imported fineware assemblage of this small but well-furnished cemetery associated with the Camulodunum oppidum at Colchester is shown in Tables 1–2 to have most similarity with that of London in terms of vertical centroid/height, as opposed to a site with pre-conquest origins. The small assemblage size at Stanway is probably not robust enough for comparison with bigger settlement assemblages, although some similarity with London is not implausible given the cemetery's evident connectedness and status. Another outlier is the assemblage from Verulamium having most similarity with Sheepen (1970) according to Tables 1–2. While the town of Verulamium has very small quantities of Gallo-Belgic wares, unlike Sheepen, we speculate that the statistical similarity of the two assemblages in terms of vertical centroid/height relates instead to the South Gaulish terra sigillata component of the assemblage, a fabric that is prevalent at both sites. Indeed, the basis of this similarity is strengthened by the likely presence of a military compound at Sheepen (1970) (Perring and Pitts 2013, 232-8). It follows that both of these seemingly anomalous results can be accounted for by particular contextual circumstances and more sensitive selection of data that breaks down larger site assemblages into more meaningful activity areas.

Using pairs of these measures, we may also compare the shapes of pottery vessels that have been assigned the same subjectively derived form type. Figure 8 is a plot of outer circularity by proportion of width to height for all vessels that have been classified as 'bowls'. Each vessel type is represented by a picture of its shape, which has been assigned a random colour to make it easier to distinguish between overlapping pots. Figure 8 presents a useful visual breakdown of the formal variation within the subjectively defined 'bowls' category. Rather than reflecting a general continuum of change, the graph instead shows several clusters of vessels, from those with more dish-like profiles (upper-left), bowls with flanges (centre-left), hemispherical bowls (upper-right), and jar-like and beaker-like vessels (lower-right), with less easily defined types such as the bobbin-shaped bowls standing out from the main clusters (lower-left). Likewise, bowls lacking obvious differentiating features plot towards the middle of the graph. Plotting all the forms in a notional class of vessels in this way has clearly visible advantages in highlighting, for example, which types are not well categorised as bowls, as well as different sub-categories of bowl types that may be productively grouped in further analyses.
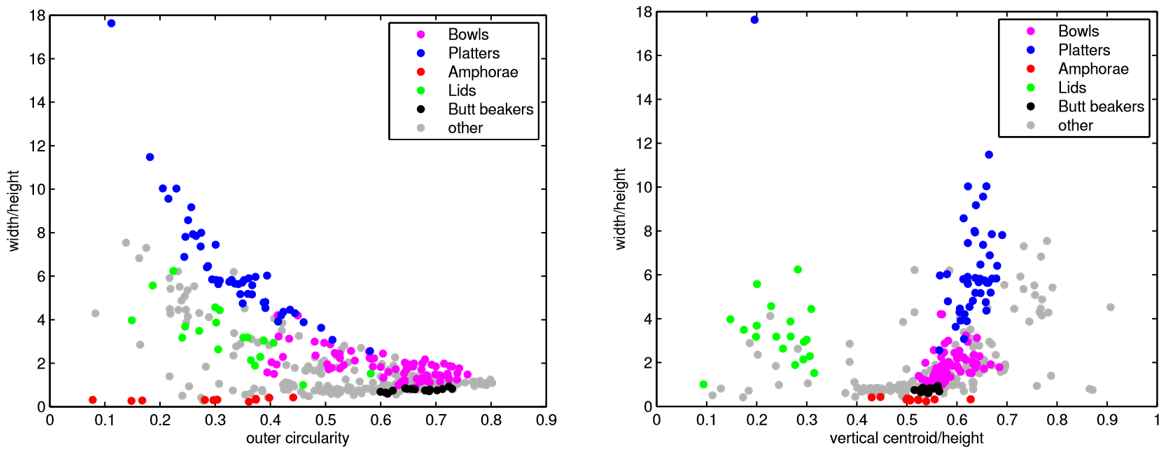
Using pairs of these measures, we may compare how vessels classified into the different, subjectively defined, form groups cluster together. Based on the form groups from the captions in Hawkes and Hull (1947), Figure 9 shows plots based on two different pairs of measures, with 'bowls', 'platters', 'amphorae', 'lids', 'butt beakers' and everything else coloured differently (e.g. cups, jars and other beaker forms). For this particular selection of form groups there is a clear localisation of the different types in both plots, with few anomalies. Looking at the right-hand plot, there are two areas that we might choose to investigate: the clear outlier at the top left-hand side of the plot, and the region where platters (blue) and bowls (magenta) overlap.
However, if we compare other sets of form groups, this localisation is very unclear. Perhaps not surprisingly, there is no clear distinction, for example, between cups and bowls, among what we have described as 'bowls' in Figure 9, regardless of which pairs of measures we choose to plot. Further measures are probably required, but it must also be borne in mind that a lack of numerical separation is likely to reflect the real-life ambiguity of function for vessels not easily classified as either cups or bowls. It is not difficult to conceive that such vessels could have had multiple functions, for example, as a sauce bowls and/or drinking vessels, as the occasion or cultural context required.
Figure 9 demonstrates that comparing both vertical centroid/height and outer circularity to width/height can be a useful means of testing the validity of labels for groups of vessel types. In the case of Hawkes and Hull's (1947) typology, while their butt-beaker category seems well defined and coherent (especially in terms of vertical centroid/height), other labels, such as bowls and platters, have much more diffuse distributions of types, which may warrant being broken down into further sub-categories. This kind of distribution used in conjunction with plots like Figure 8, can provide a useful starting point for more objectively derived form-sensitive re-categorisations of pottery types across larger areas in the Roman world. Such an approach has considerable potential for cultural analysis, adding confidence to the use of certain (etic) material categories derived by modern analysts to elucidate patterns that are likely to have held (emic) meaning in the past. For example, the well-defined butt-beaker category seems a particularly meaningful classification, which is also underscored by striking patterns of distribution as well as a virtual absence in military and colonial settings in Britain in this period (Pitts 2017).
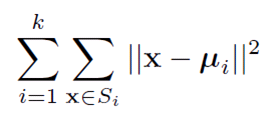
In the right-hand plot in Figure 9 we can see that the different form groups are clustered into approximate ellipses. K-means clustering (Lloyd 1982) is a machine-learning technique that attempts to find a number (the 'k') of elliptical clusters in a set of data. It is an unsupervised learning technique, which means that it looks for clusters without the benefit of any training by humans. The algorithm assigns each point, x, to one of k clusters so as to minimise the following expression:
 (4)
(4)
where Si is the ith cluster and μi is the centroid of all points allocated to Si.
This is achieved iteratively, starting from a random assignment of points to clusters, so multiple runs of the algorithm on the same data may result in slightly different clusterings. The results displayed in this article are from a single, representative run.
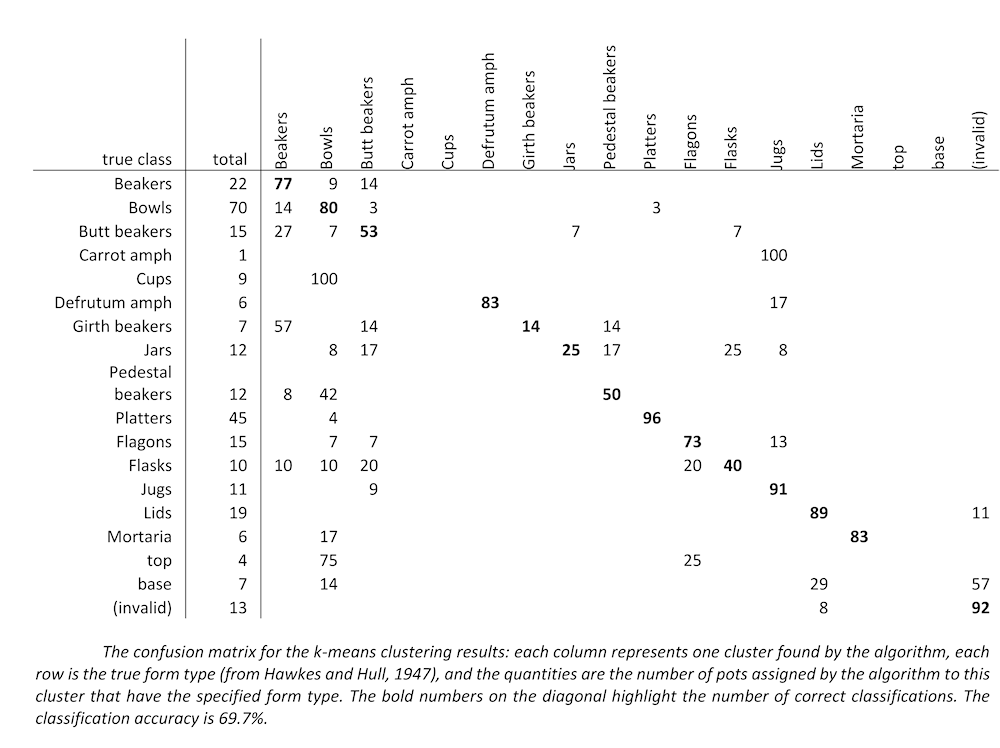
With each point x being a vector containing all the measures for one vessel type, k-means clustering was performed for the different vessel types. While it is able to identify clusters, it cannot identify labels for them, so for this test each cluster was assigned the most numerous form type of the pottery vessels assigned to it. Figure 10 shows the confusion matrix for the clustering results: each column represents one cluster found by the algorithm, each row is the true form type (from Hawkes and Hull 1947), and the quantities are the number of vessel types assigned by the algorithm to this cluster that have the specified form type. The total accuracy of classification is 69.7%. Note that for some of these form groups there are very few examples available, so it is not surprising that no clusters have been identified for them.
We may use the clusters identified by the k-means algorithm to classify the terra sigillata pottery types extracted from Hawkes and Hull (1947, plates 39-40). Figure 11 shows the extracted pottery diagrams, their corresponding segmented images and the classifications assigned to them by their proximity to the cluster centroids. Clearly, two of the pot images have not been correctly segmented (row 4 column 7, and row 5 column 5) and have therefore not been correctly classified, while others (e.g. row 1 column 6) are less badly segmented but correctly classified. Of the remaining images labelled as '(invalid)', the system has grouped them with various partial or otherwise unidentifiable fragments extracted from the pages of the book.
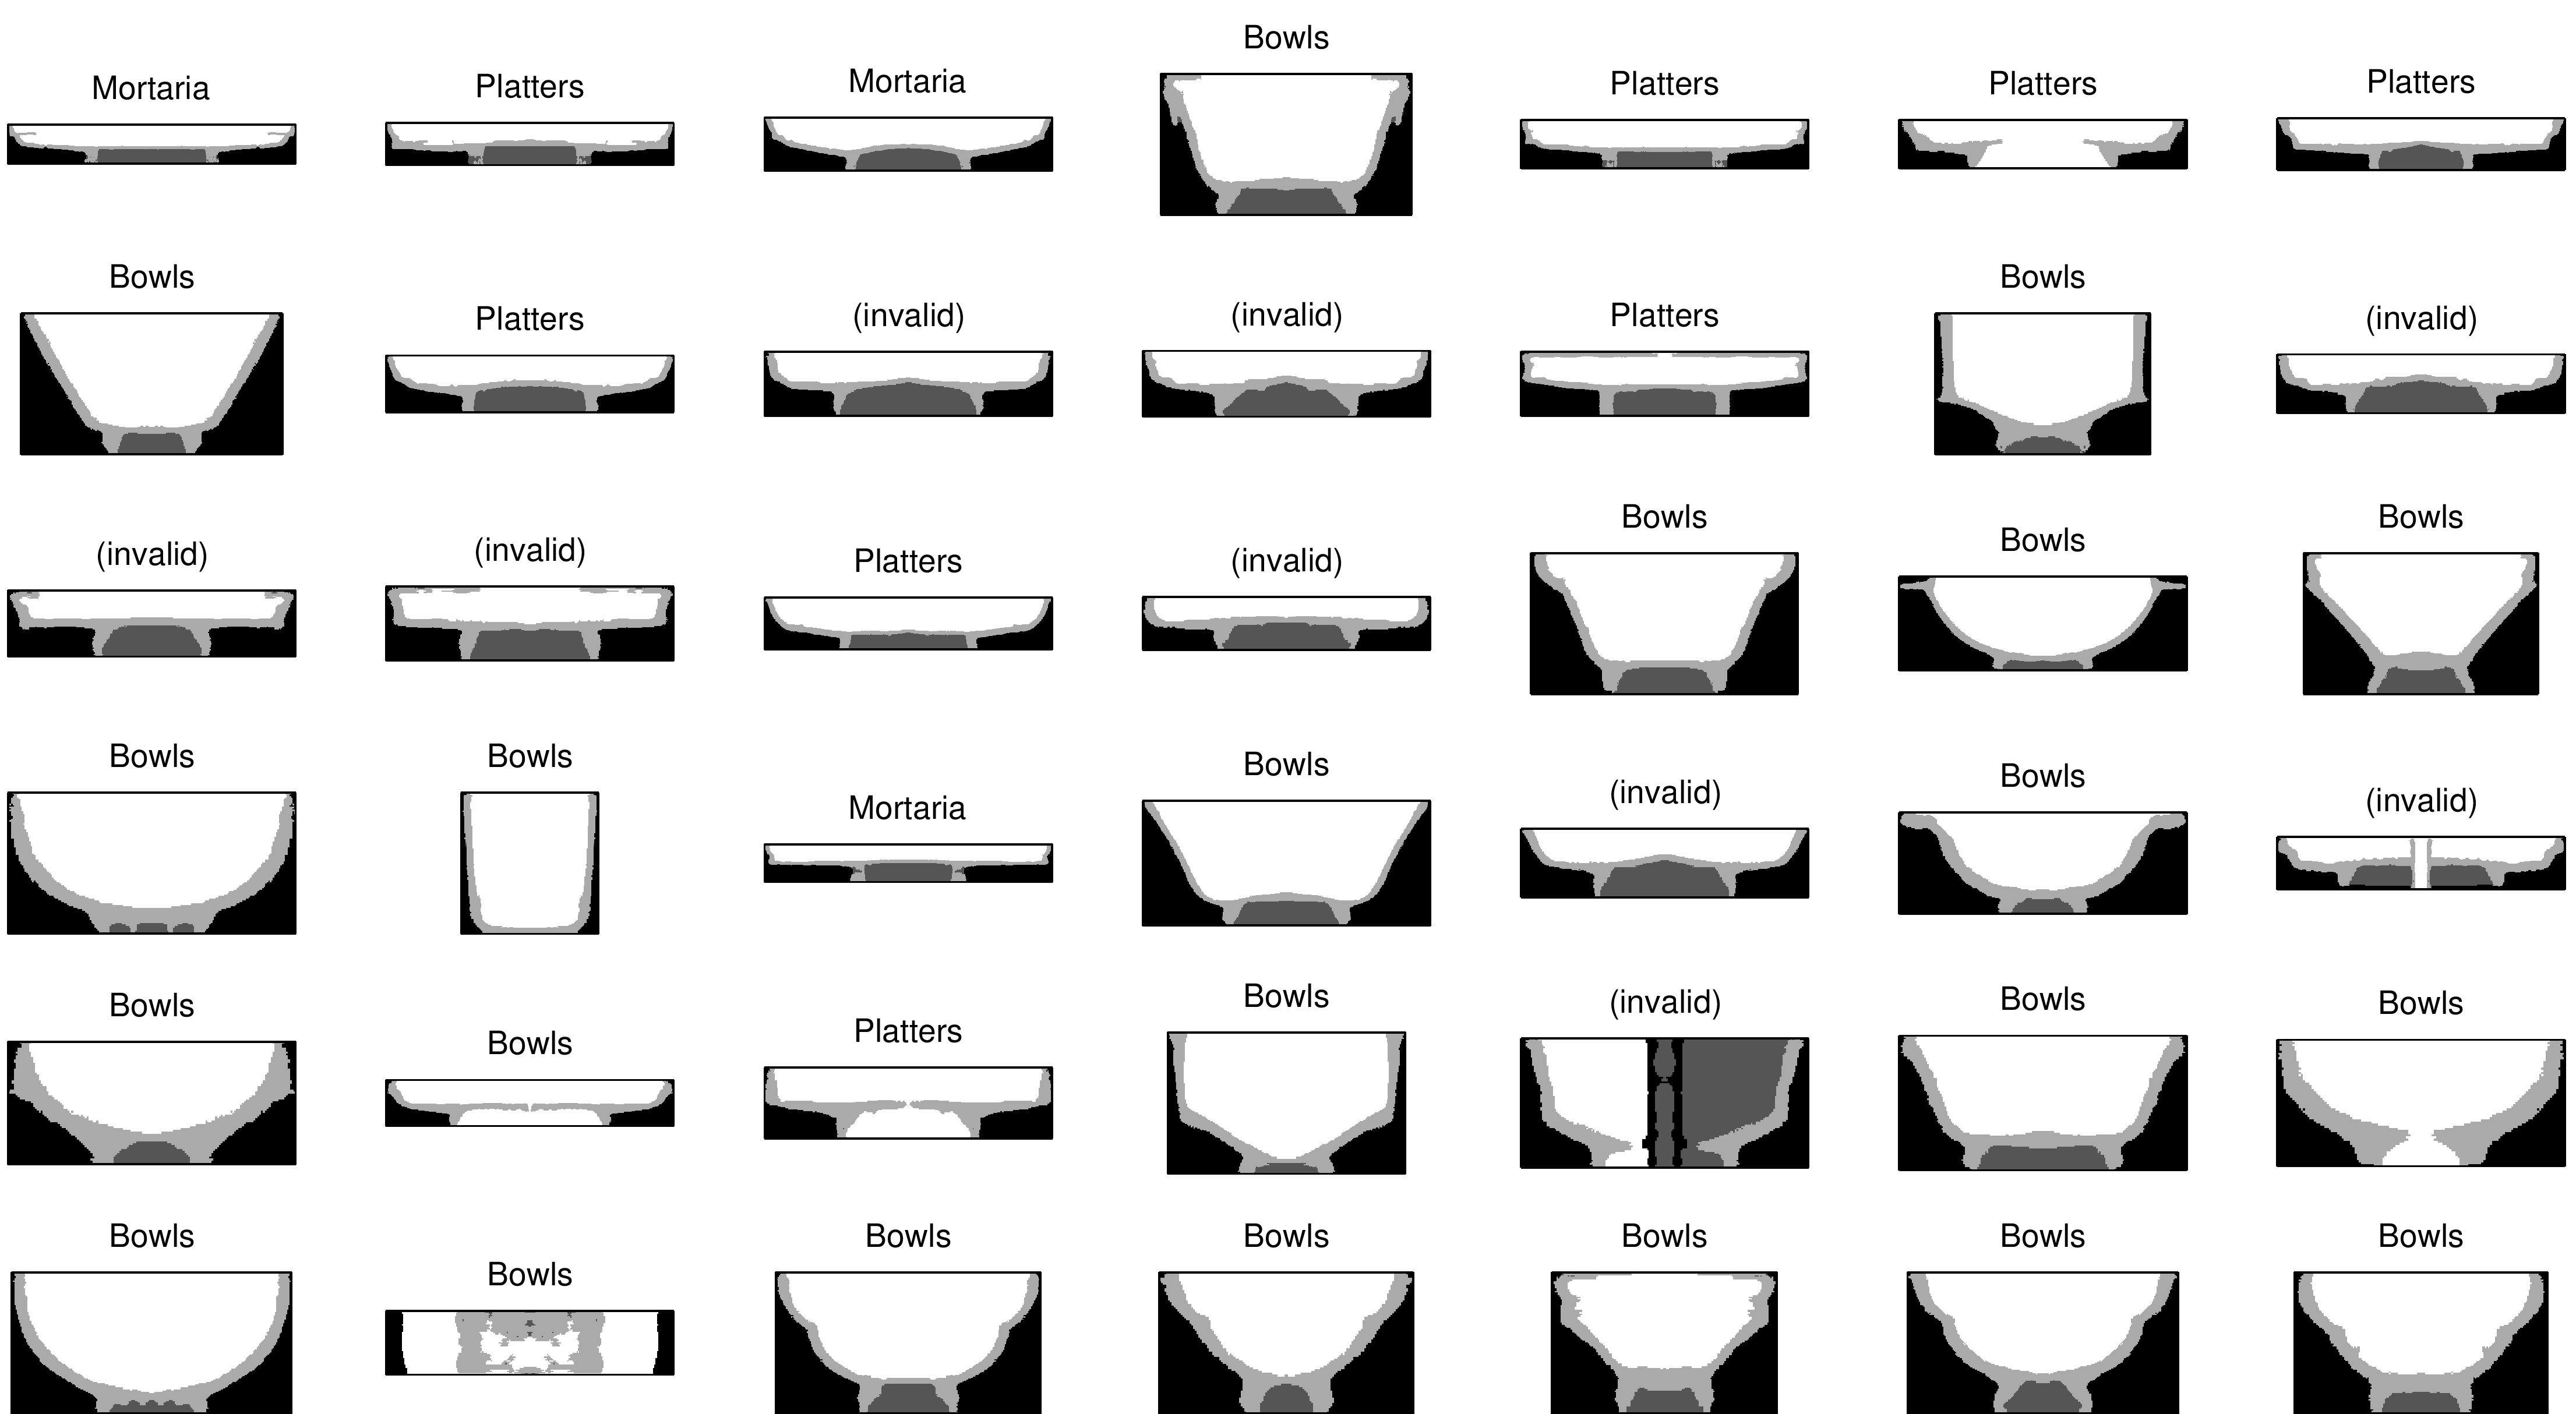
From the perspective of Roman pottery studies, future applications of this kind of automated approach have much potential to contribute to working towards a genuinely unified use of terminology to assign to regularly occurring form types across the breadth of the Roman world. While many identifications are confused (i.e. assigning the mortaria label to certain platter types), the method distinguishes platters and bowls rather well. Applying this approach more widely provides a more objectively derived means of classifying common forms such as the Drag. 27 (bottom-right, Figure 11). In this case the software agrees with the majority of 'Big Data on the Roman Table' participants that this form is a bowl, and not a cup.
The archaeological applications of the methods outlined here are threefold: (a) to provide an objective means of assessing the value of existing means of categorising groups of pottery forms under umbrella headings like 'bowls' and 'platters', (b) to provide a more objective way of determining meaningful distinctions between different styles and shapes of pots, that may in turn have implications for how the pots were used, and (c) to offer a suite of measures that may be used to supplement existing approaches to conduct comparative analysis of the formal characteristics of pottery assemblages from different sites, contexts and periods. We also see considerable potential in extending the methods outlined here to multiple type-series at once, and indeed other relevant classes of archaeological material such as glass and alloy vessels. Such wider applications have significant potential to help overcome boundaries for undertaking meaningful and rigorous comparisons of ceramic and related archaeological data from across the breadth of the Roman world.
The measures described in this article are just a selection of the more obvious ones available. In particular, as well as circularity and rectangularity, there is a variety of other so-called shape descriptors that might be employed. Equally, k-means is just one method for discovering clusters of pots based on their measures, and the classification of pottery vessels into form groups is just one example. Indeed, this latter point is one of the reasons for trying to arrive at an automatically derived classification that would enable the comparison of finds and assemblages of finds from different sites and different periods.
Internet Archaeology is an open access journal based in the Department of Archaeology, University of York. Except where otherwise noted, content from this work may be used under the terms of the Creative Commons Attribution 3.0 (CC BY) Unported licence, which permits unrestricted use, distribution, and reproduction in any medium, provided that attribution to the author(s), the title of the work, the Internet Archaeology journal and the relevant URL/DOI are given.
Terms and Conditions | Legal Statements | Privacy Policy | Cookies Policy | Citing Internet Archaeology
Internet Archaeology content is preserved for the long term with the Archaeology Data Service. Help sustain and support open access publication by donating to our Open Access Archaeology Fund.