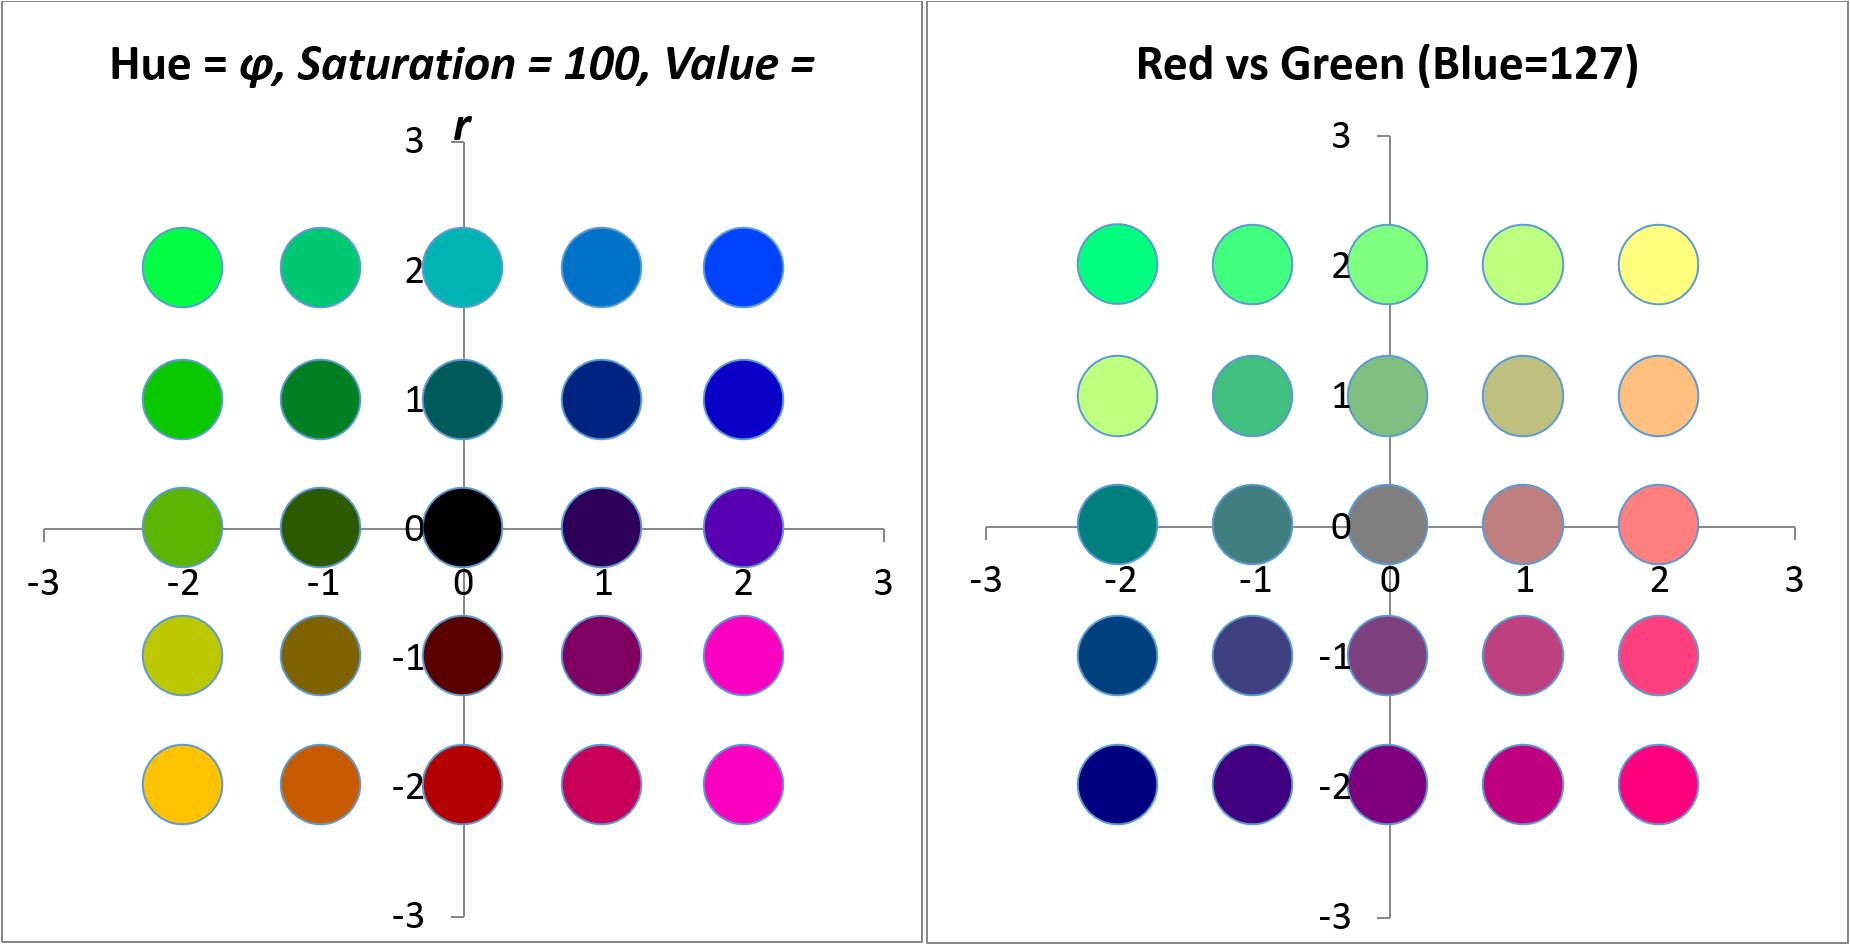
Figure 1: The Hue-Saturation-Value (left) and Red-Green-Blue (right) colour models applied to an x-y scatter graph. The colours of the symbols equate to the symbols position on the graph.
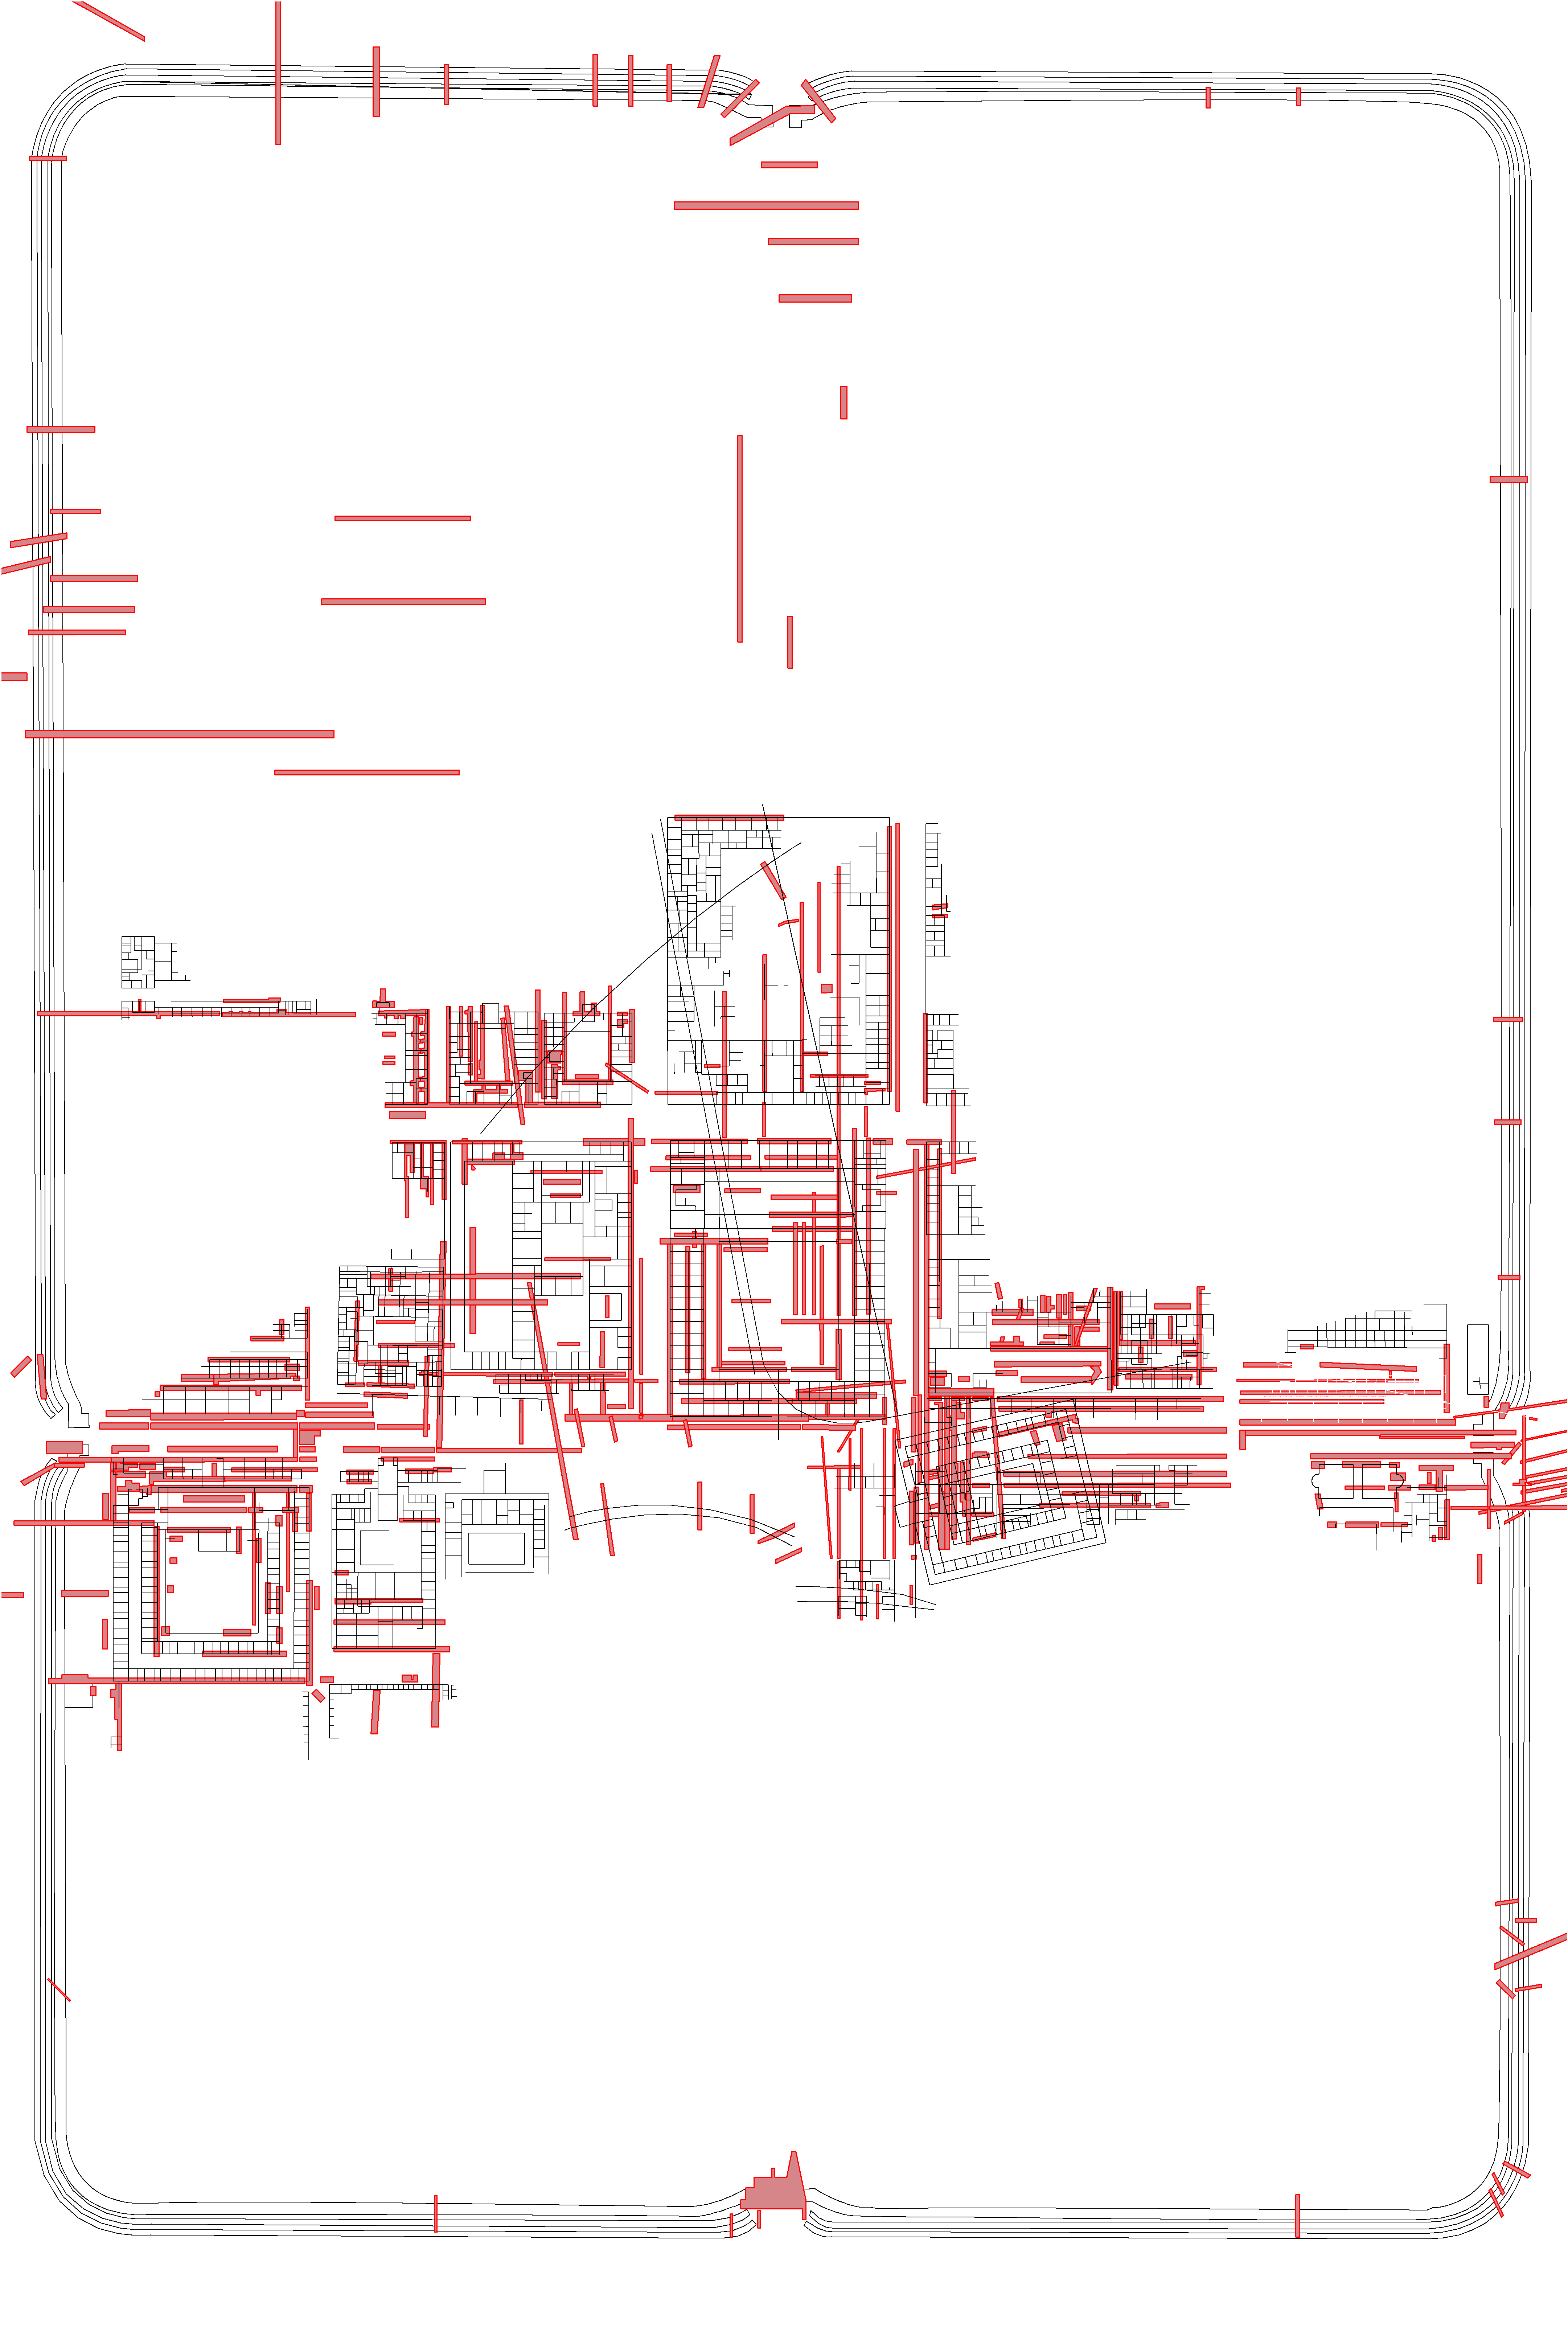
Figure 2: The Roman fortress of Vetera I showing excavation trenches (red) and reconstructed plan (black). Data compiled and digitised by Steven Ellis, available from Allison 2012.
Figure 3: CA bi-plot of diagnostic sherds fabrics from Vetera I, samples are trenches. [SVG file]
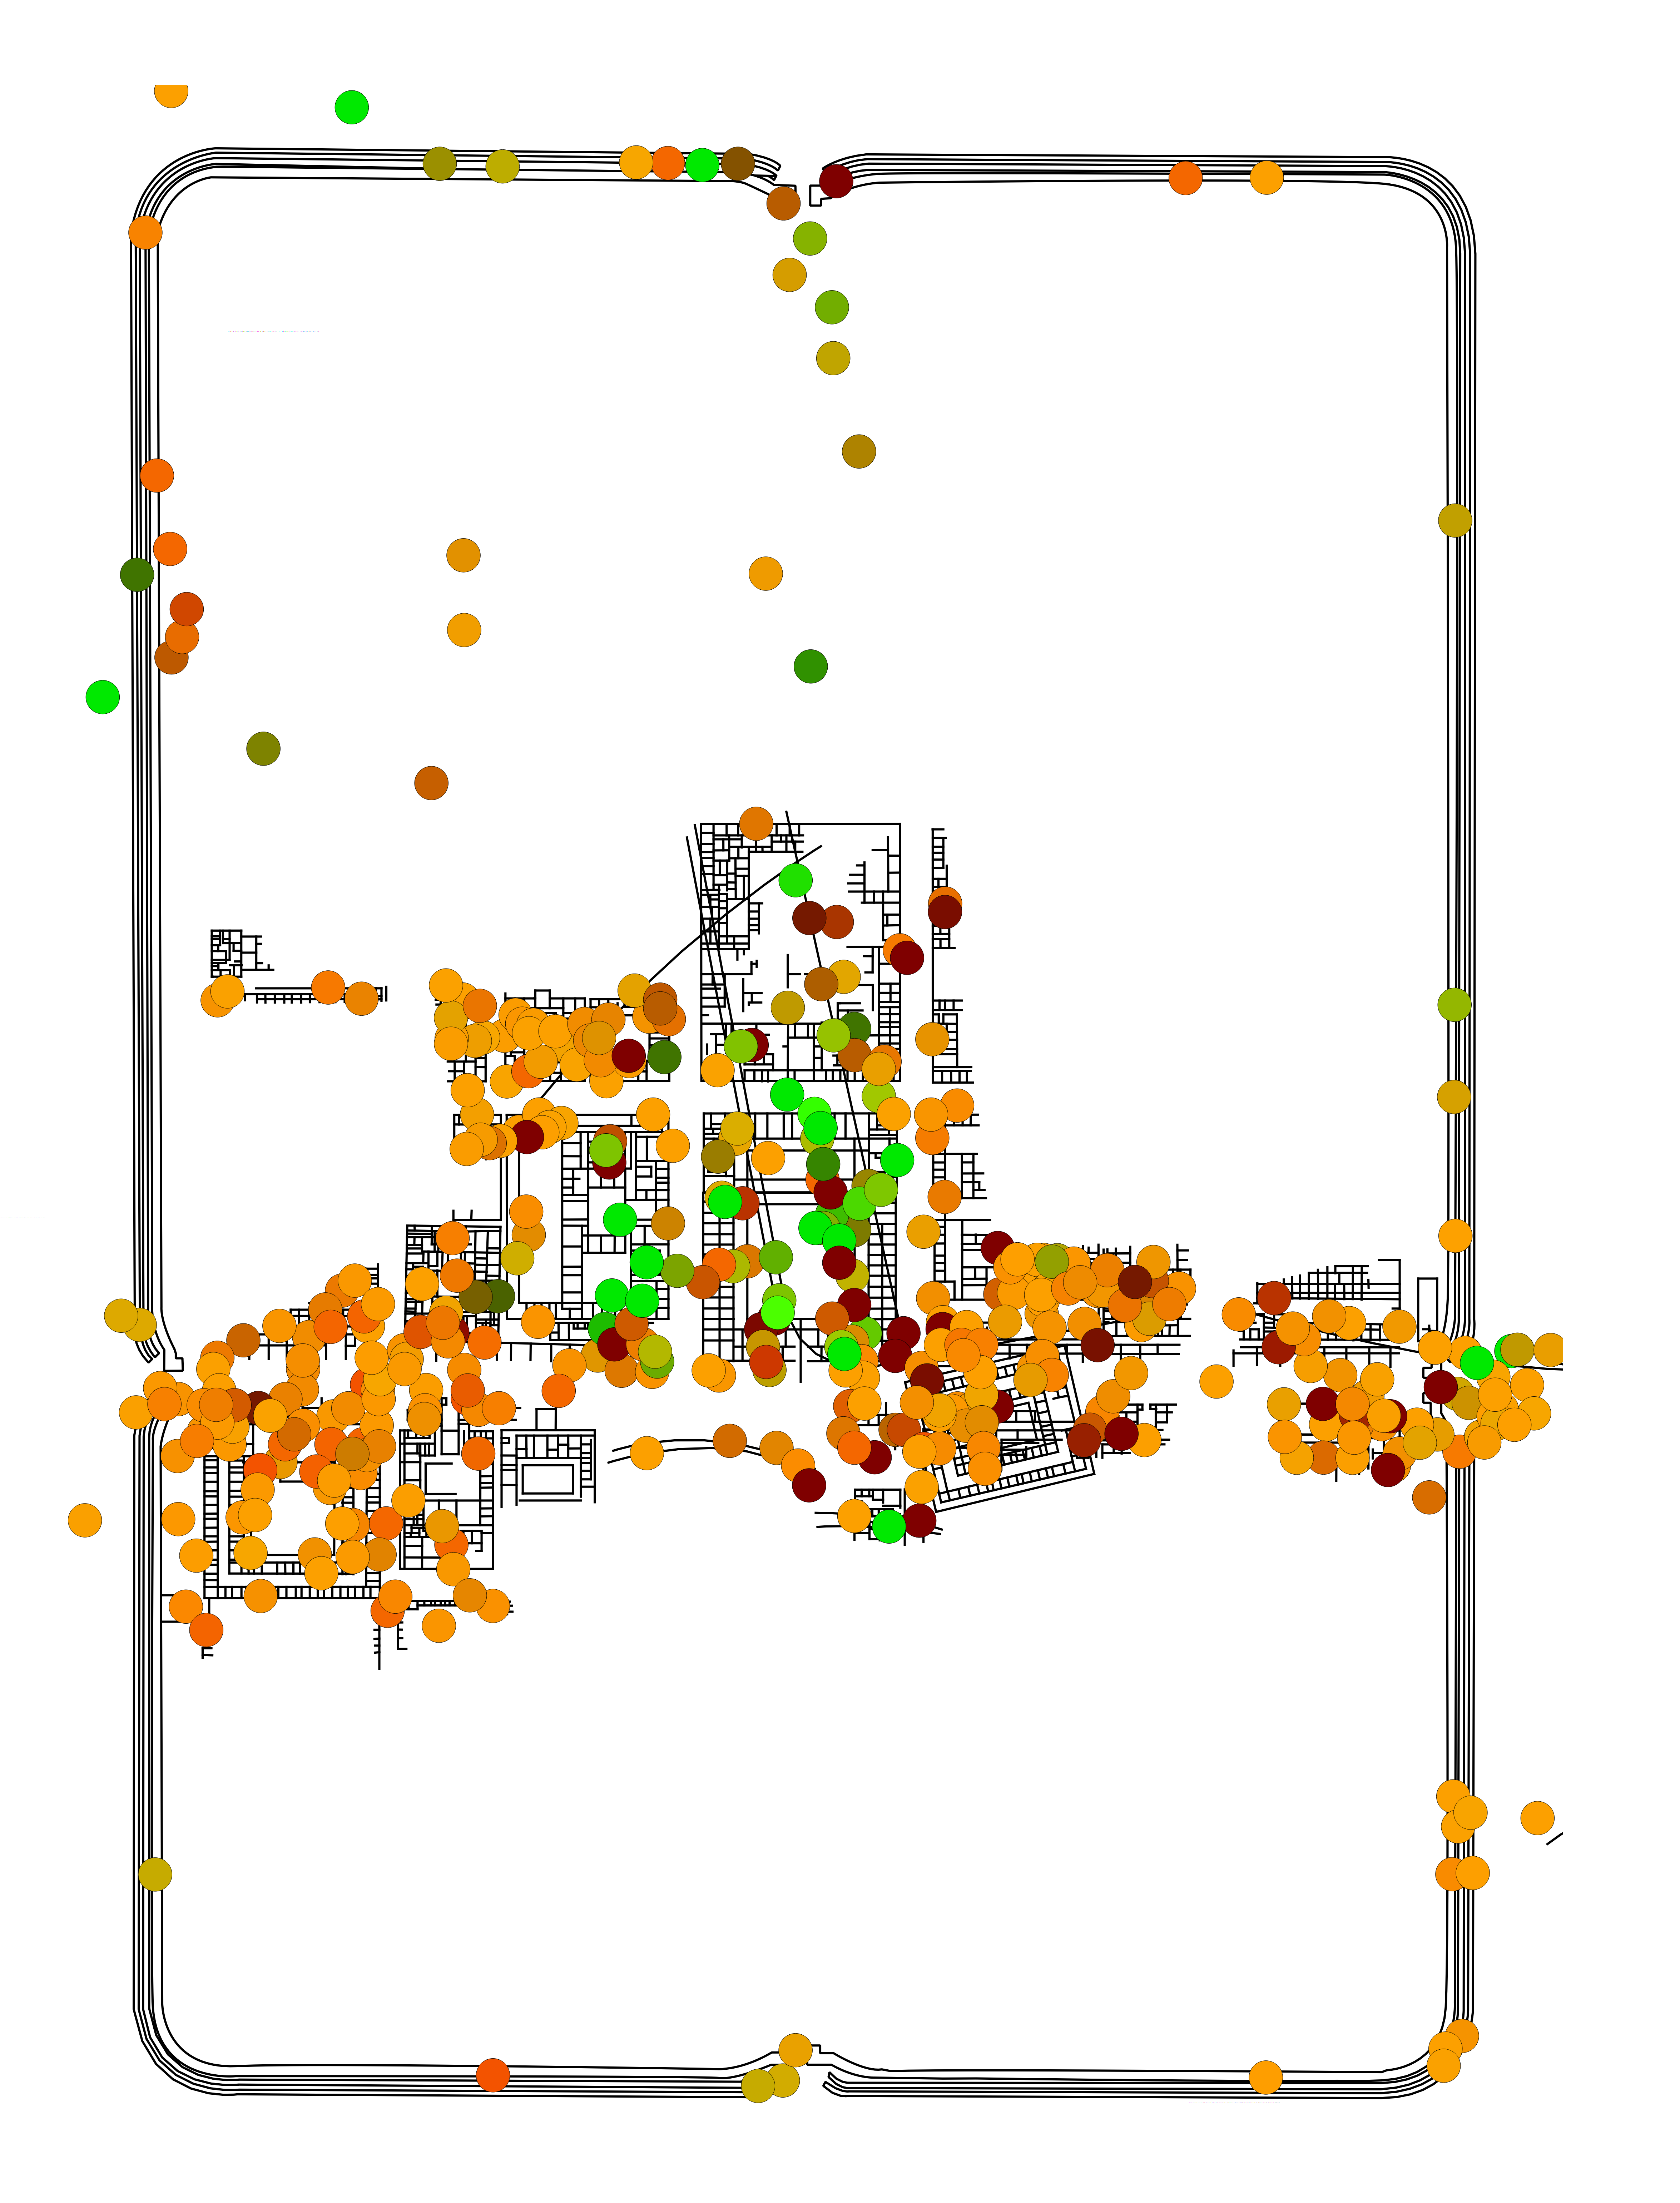
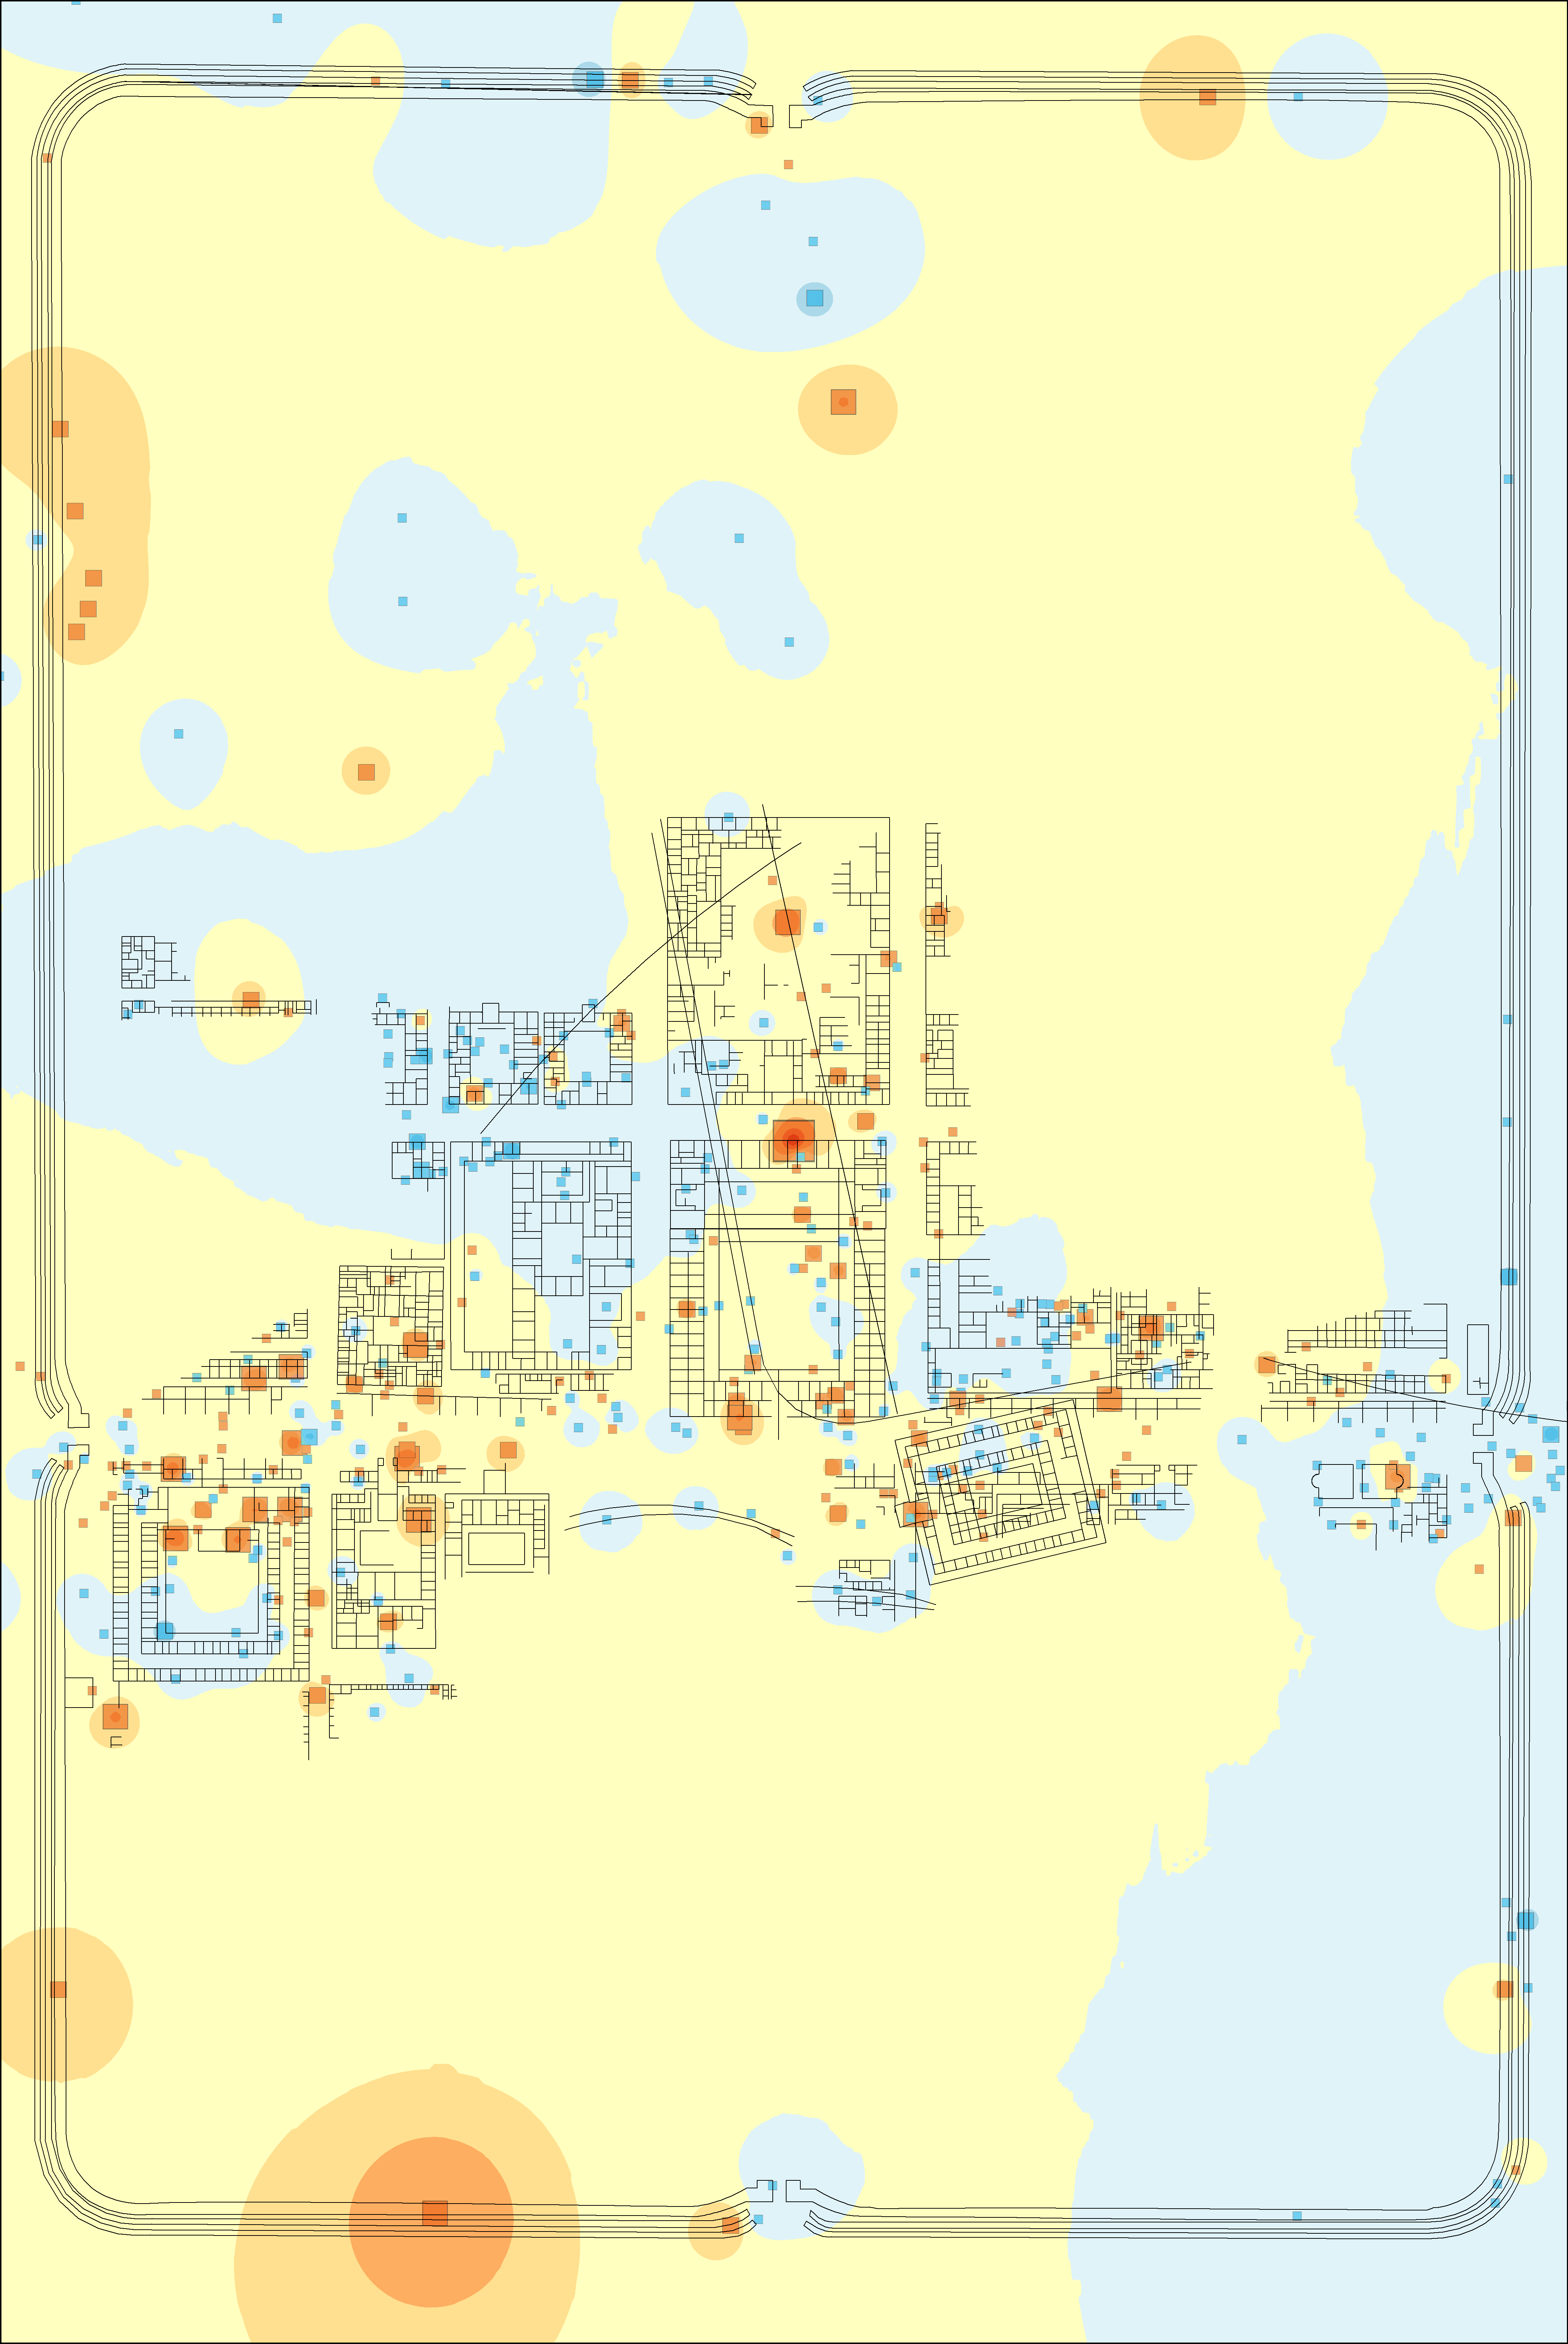
Figure 4: Point distribution of trench centroids coloured by CA axis scores using RGB.
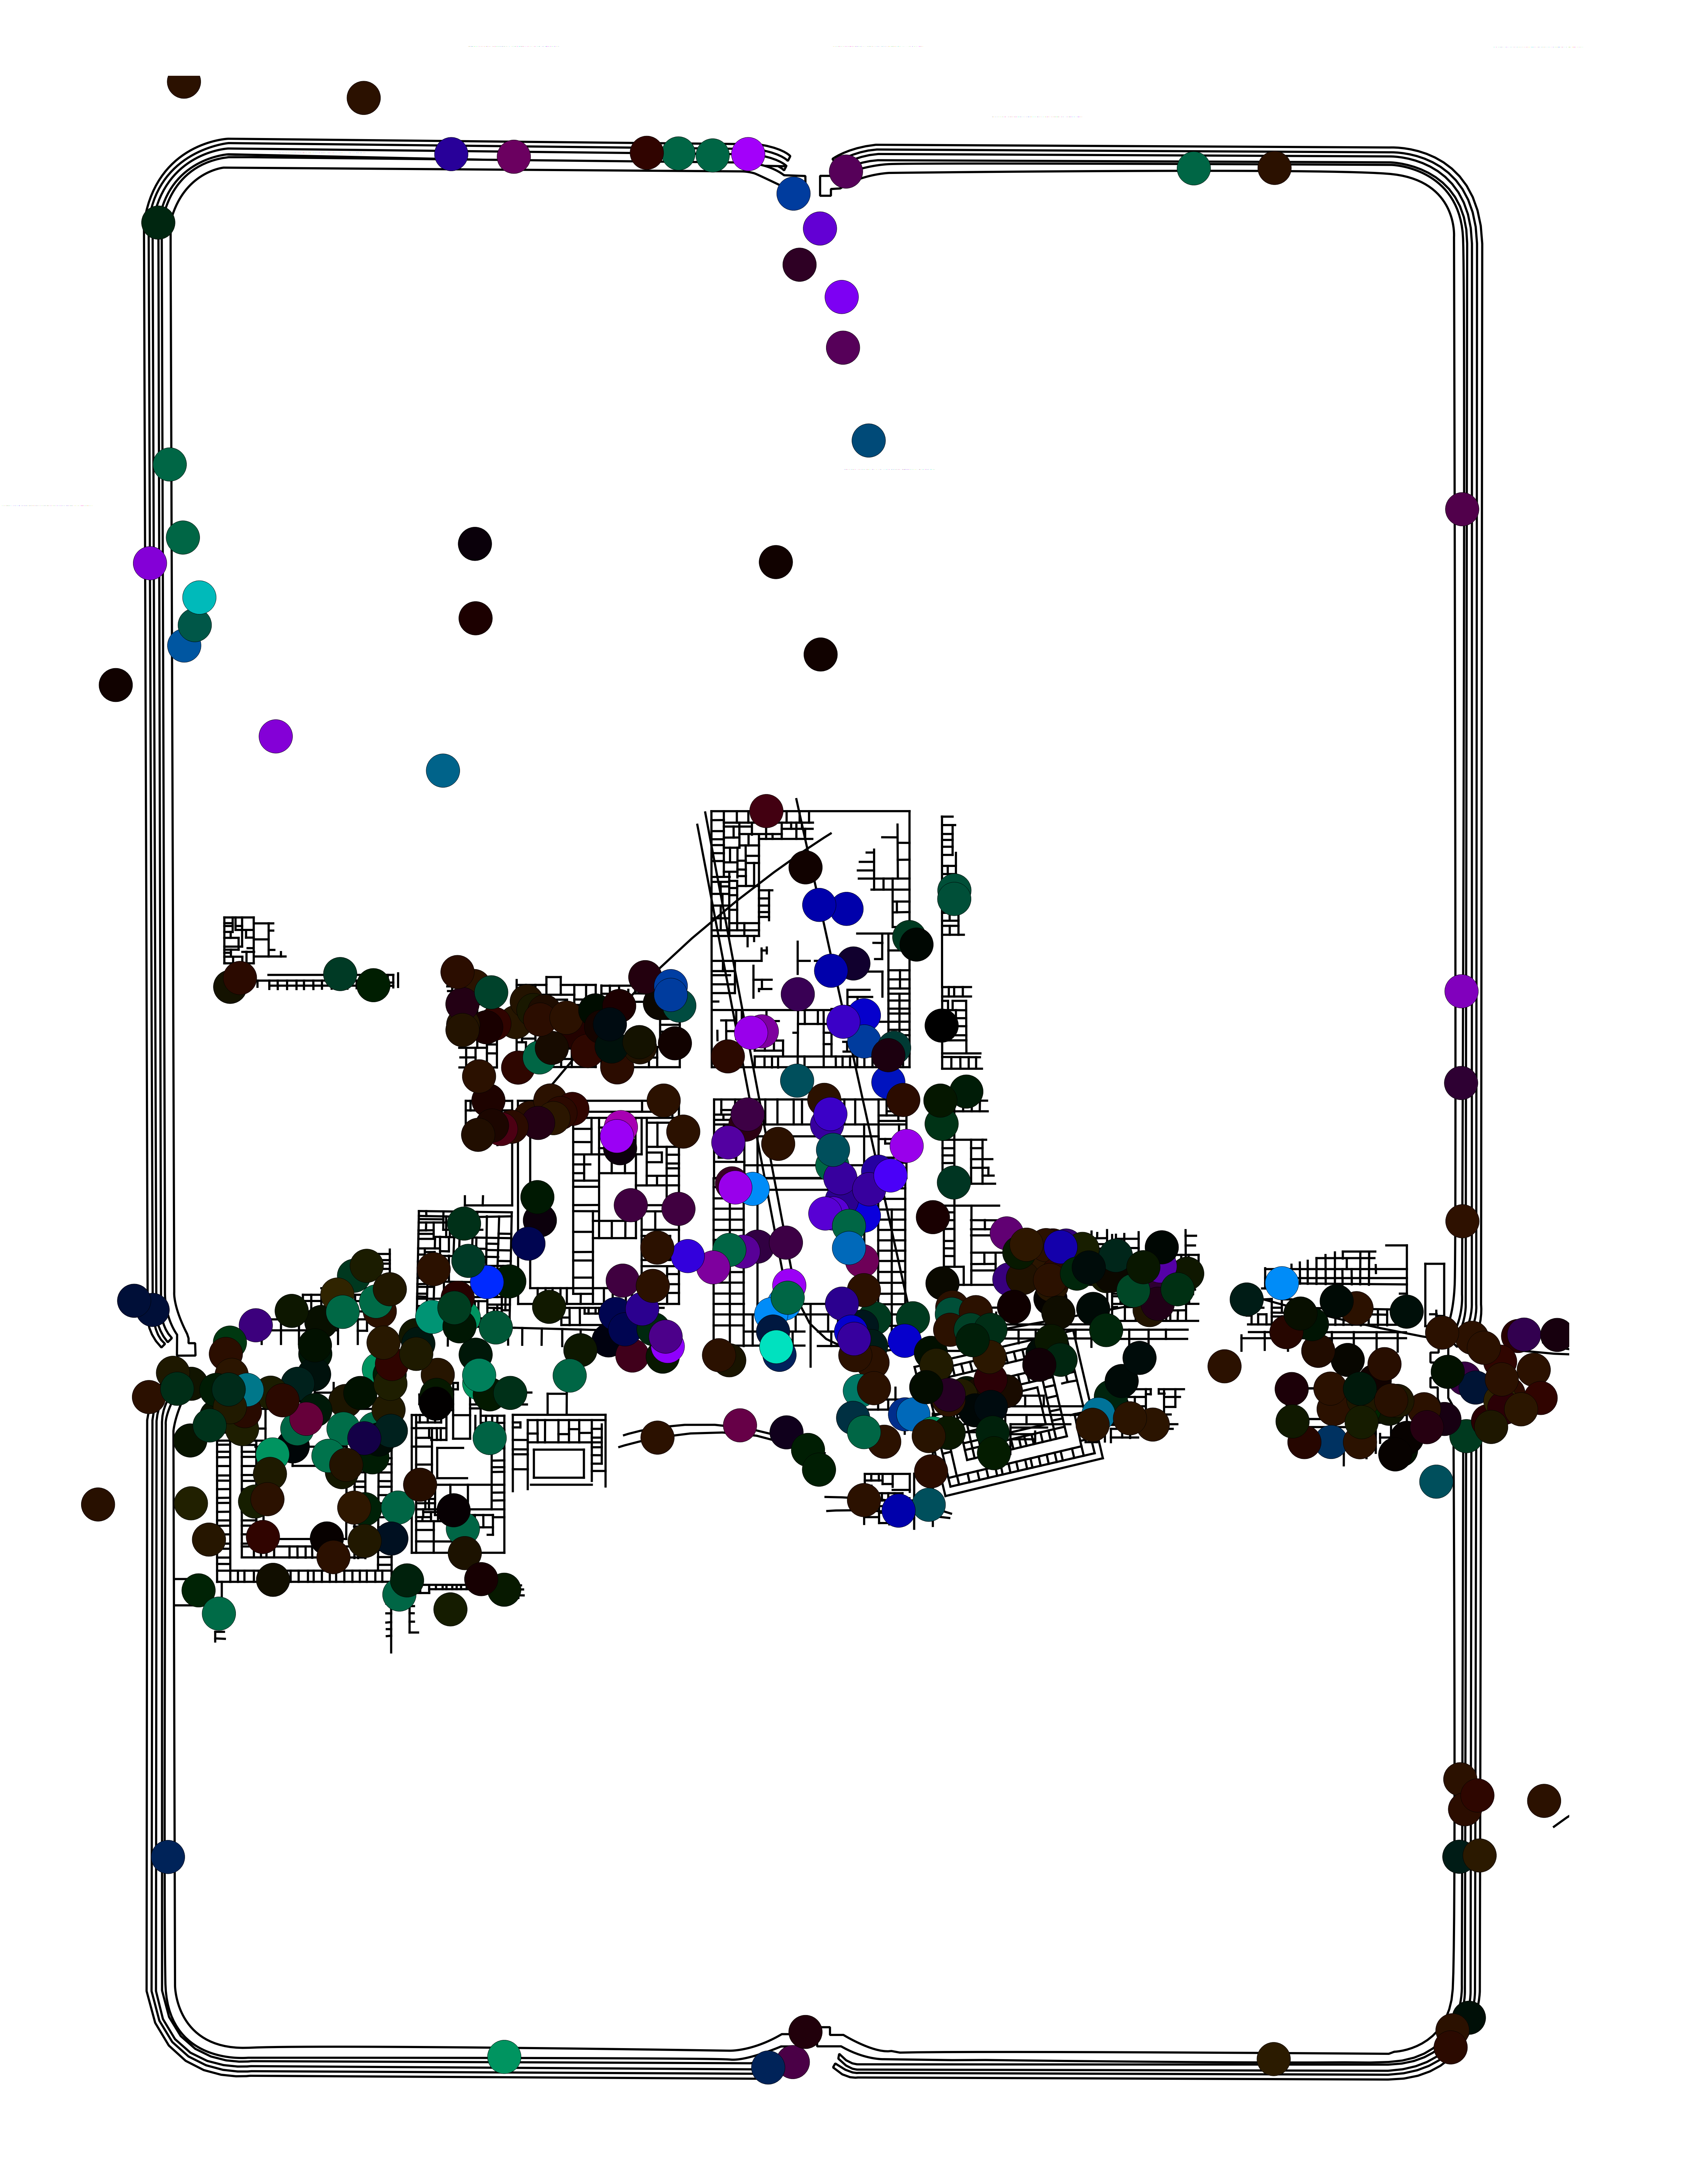
Figure 5: Point distribution of trench centroids coloured by CA axis scores using HSV.
Figure 6: CA bi-plot of diagnostic sherds fabrics from Vetera I with hues used in the HSV colour model. [SVG file]
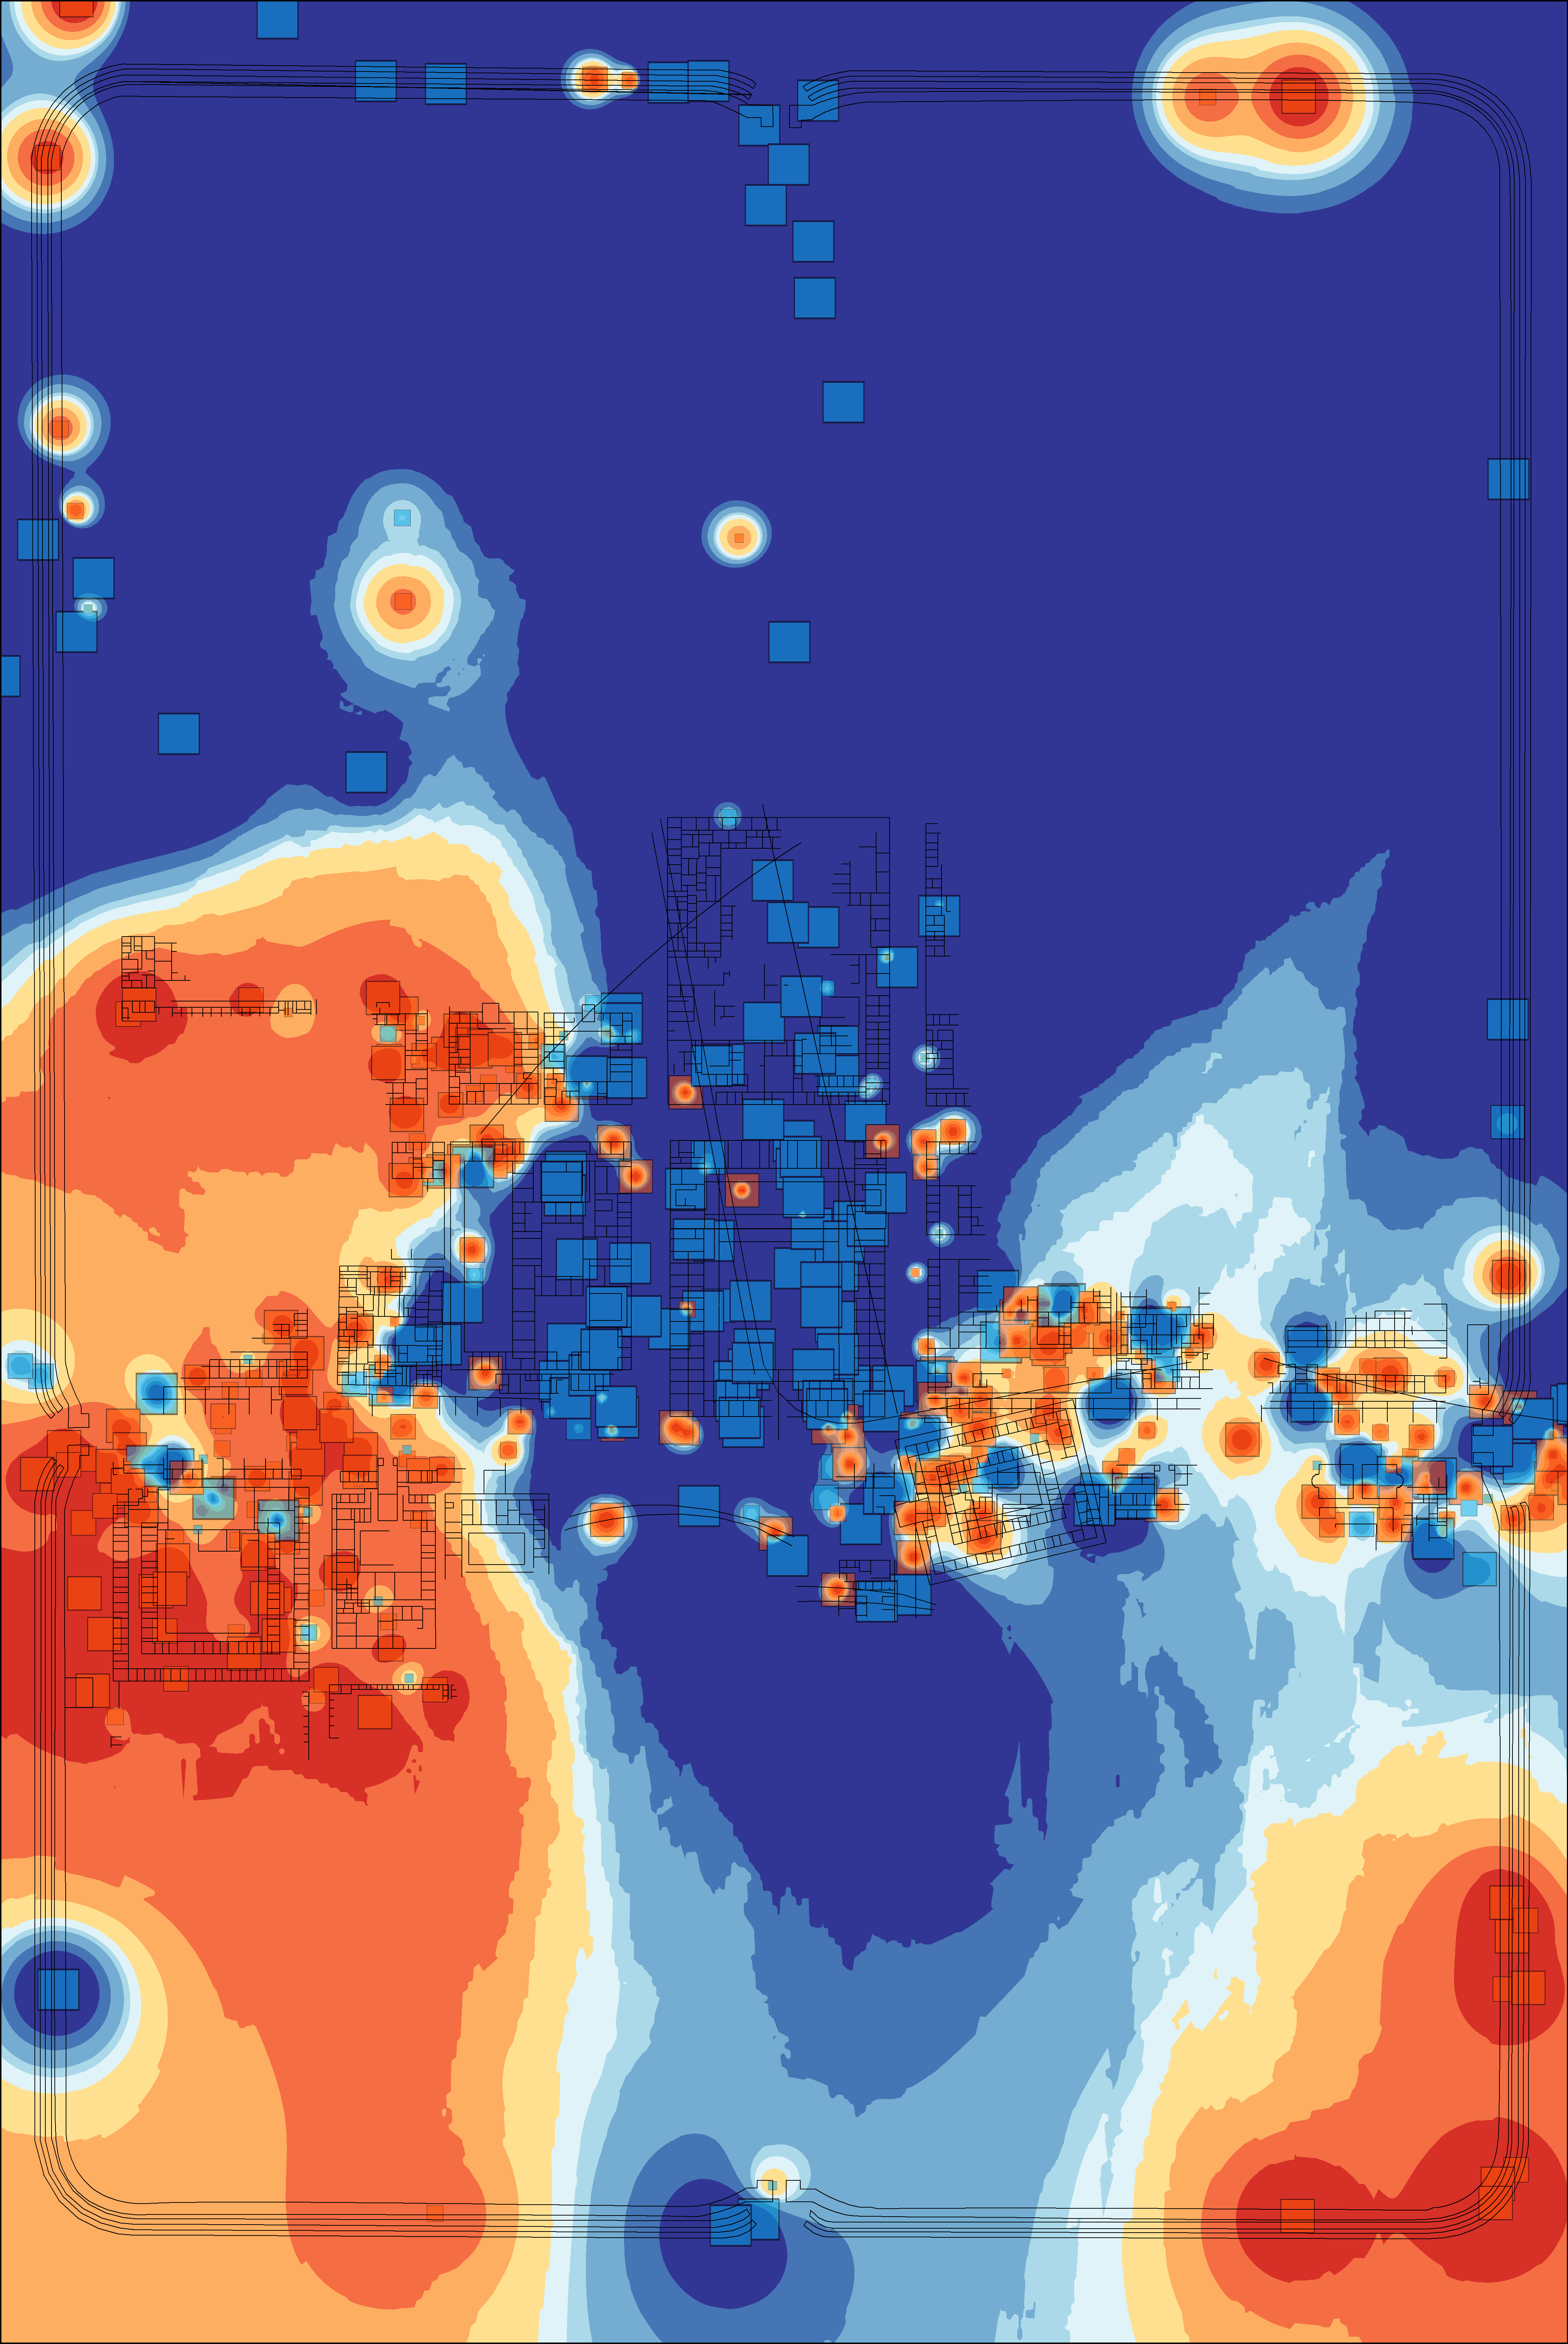
Figure 7: Interpolations of CA first axis scores.
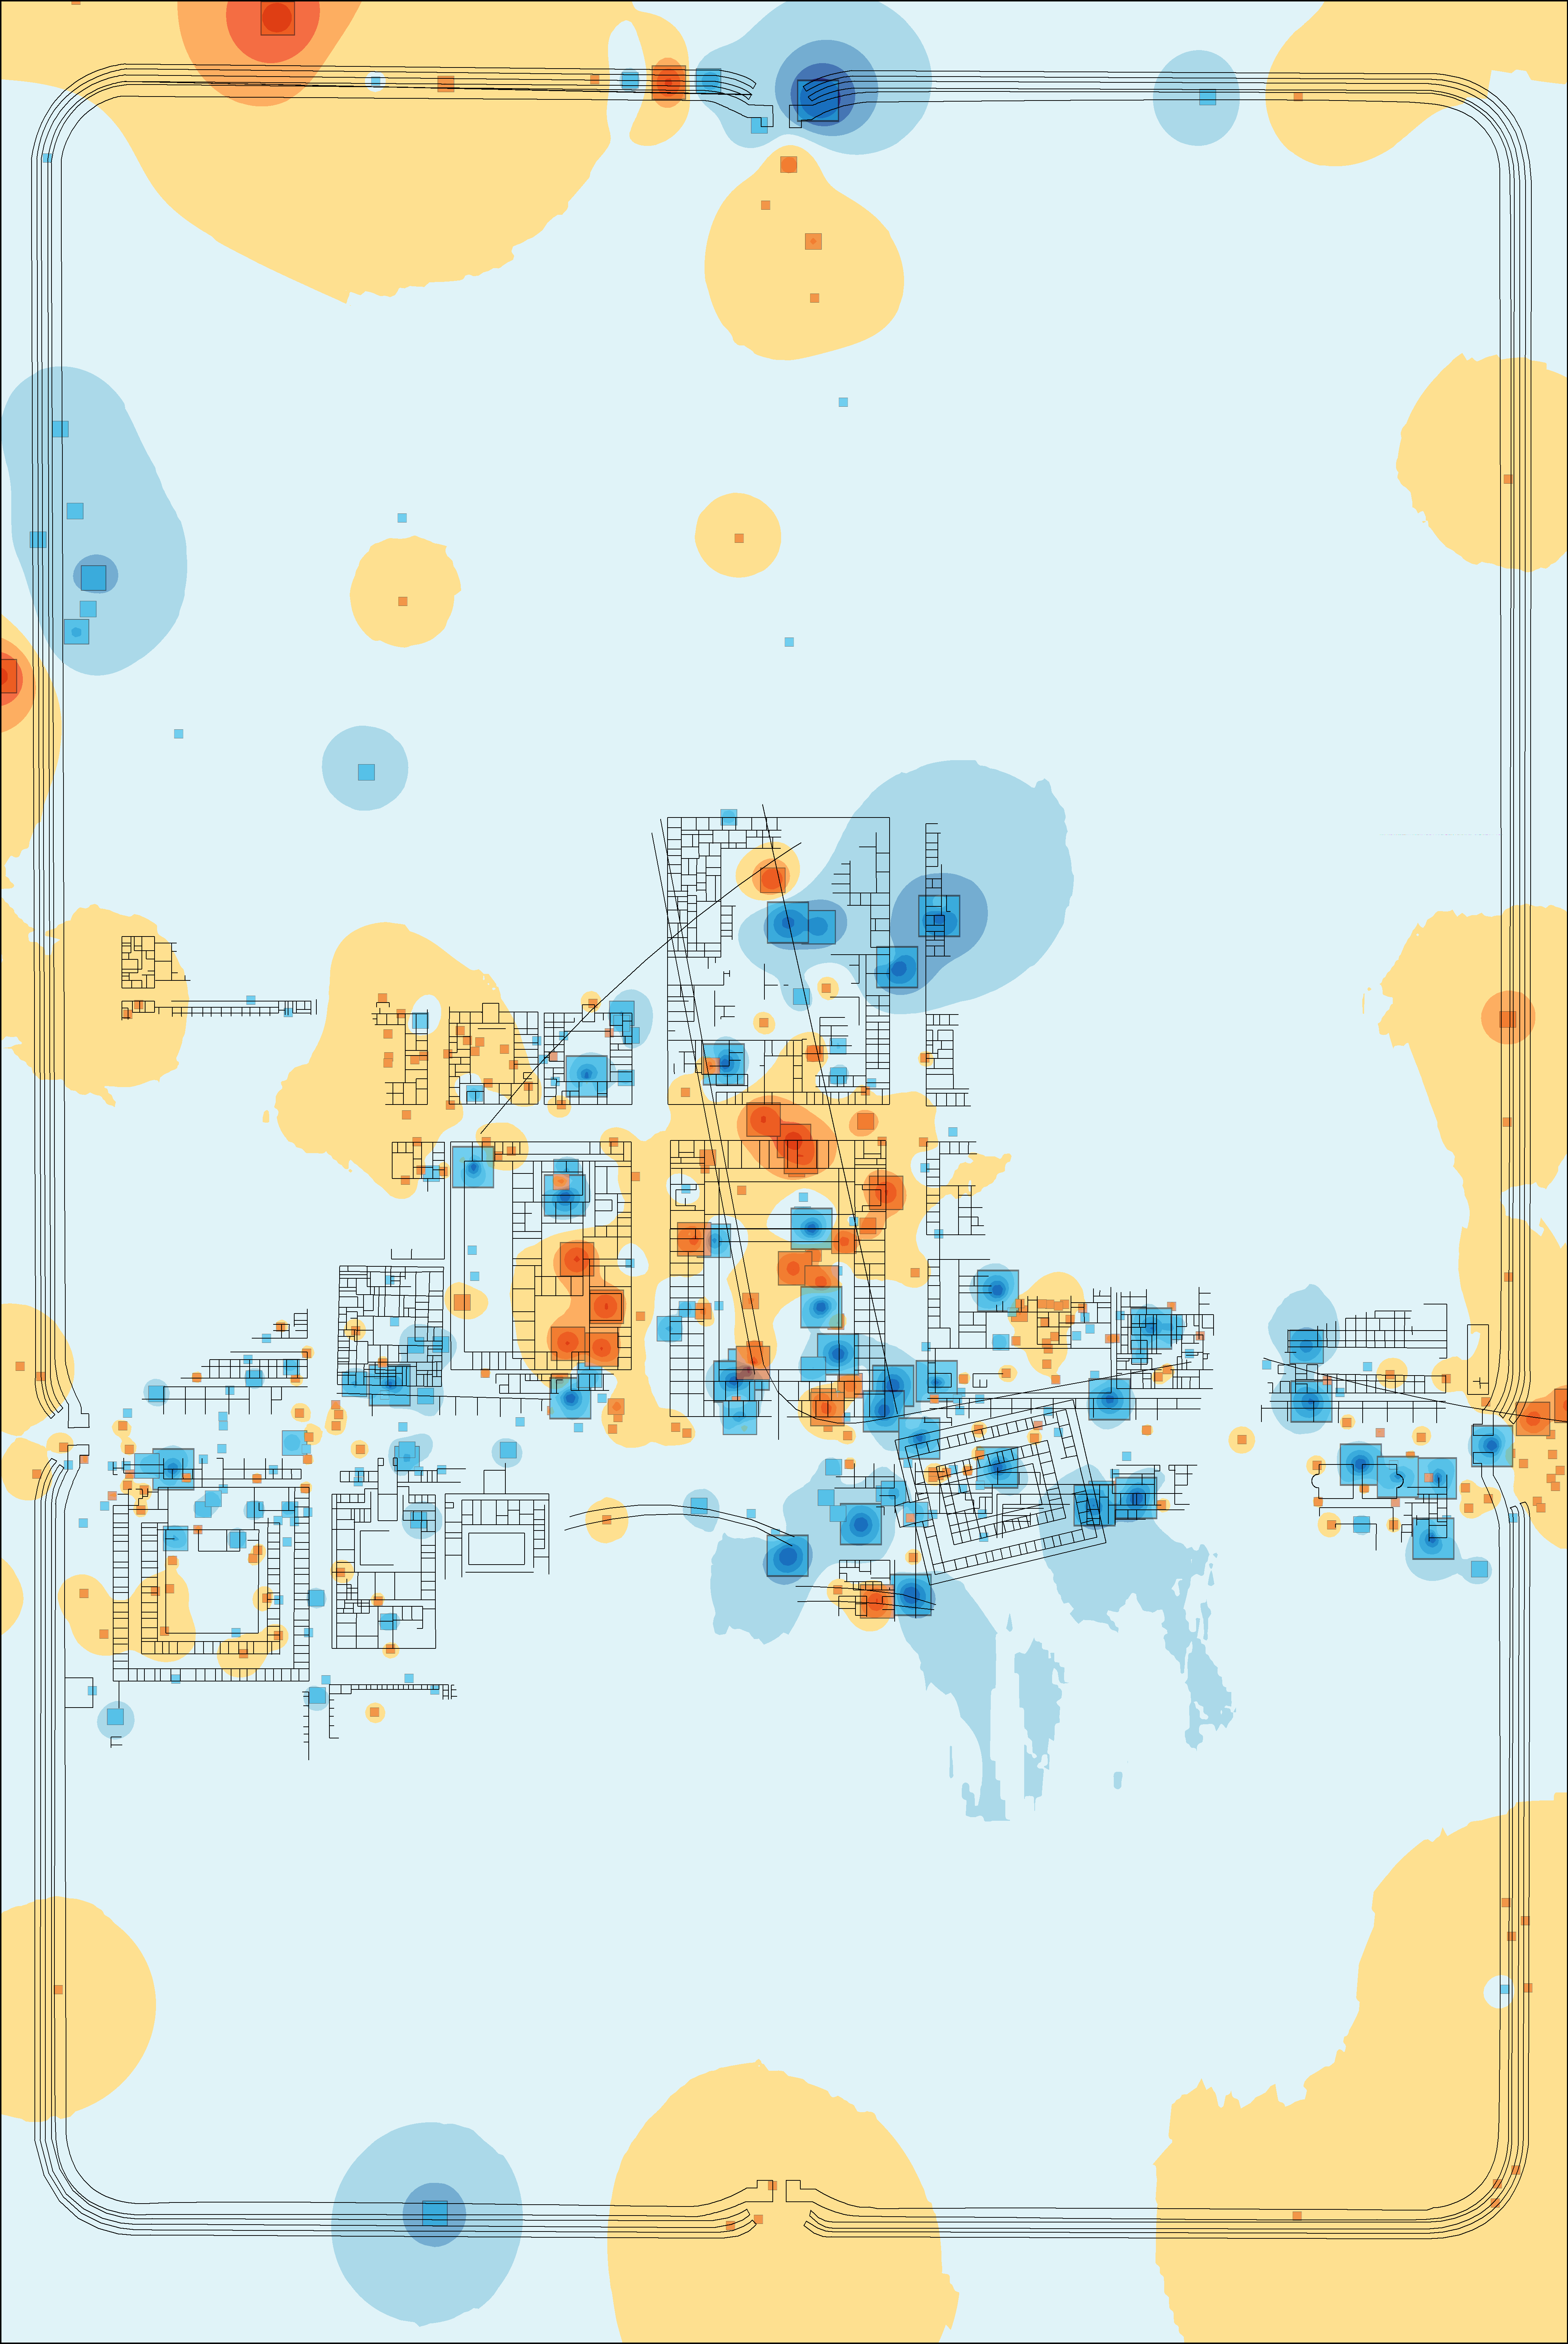
Figure 8: Interpolations of CA second axis scores.
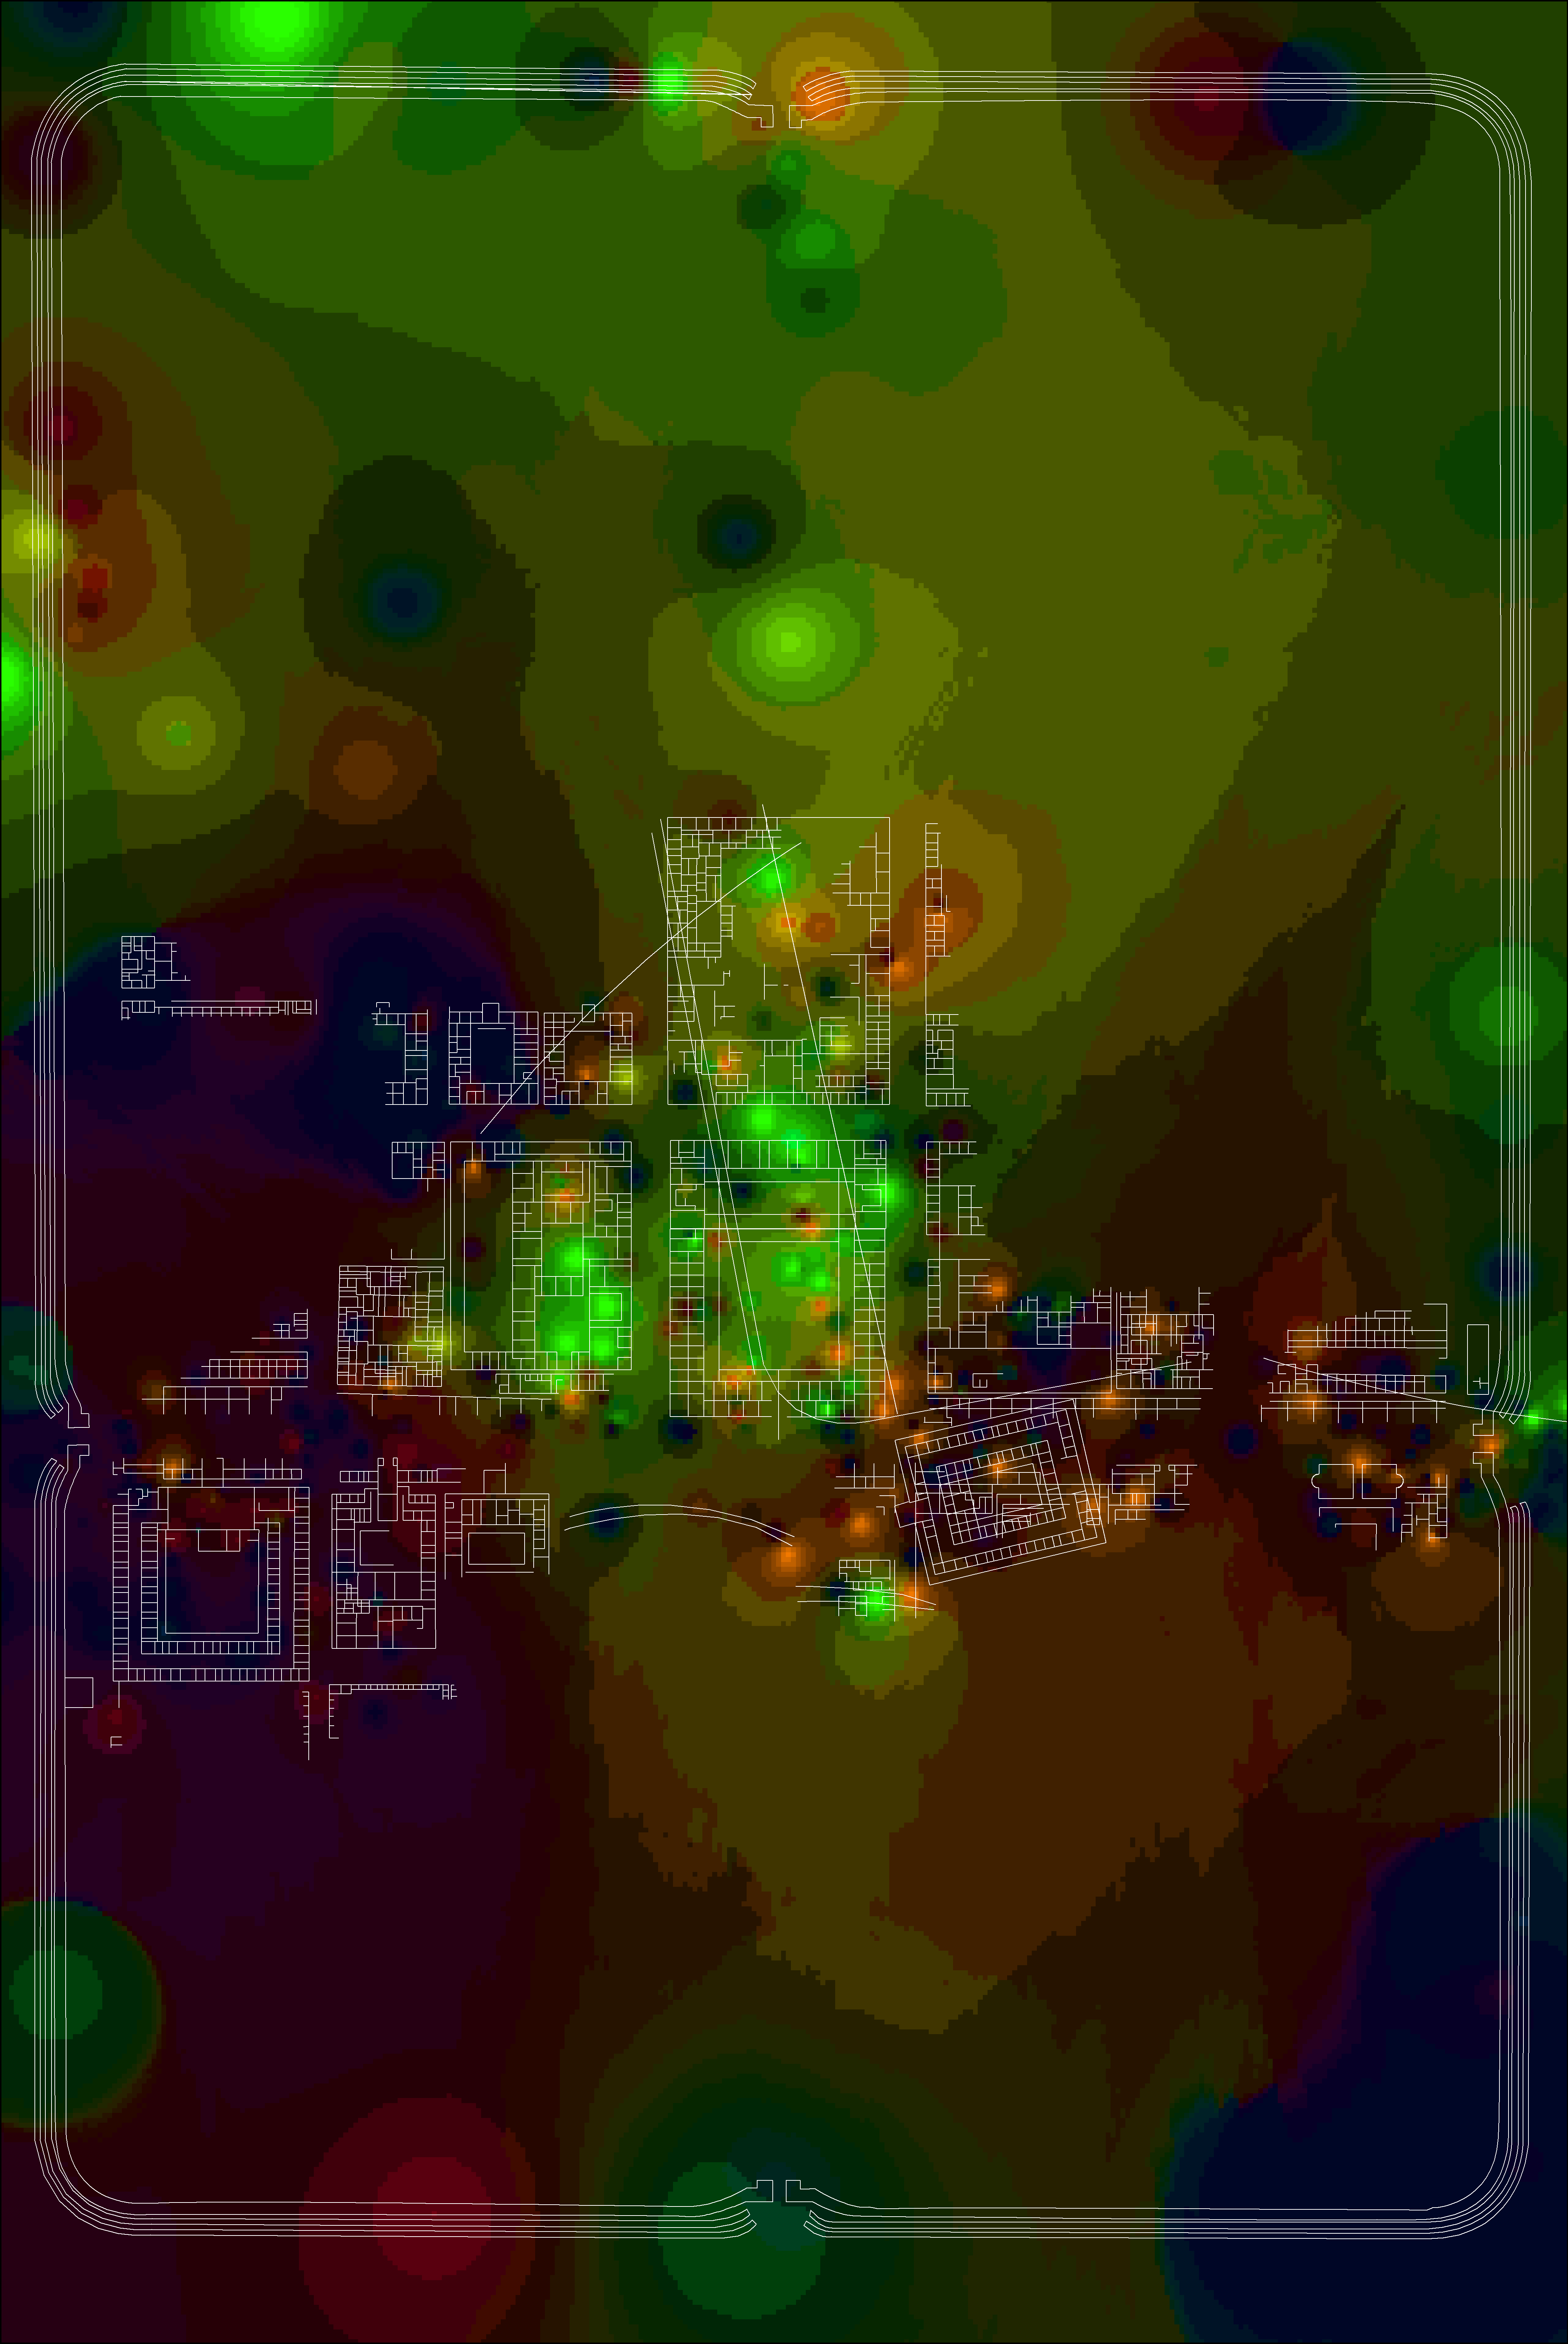
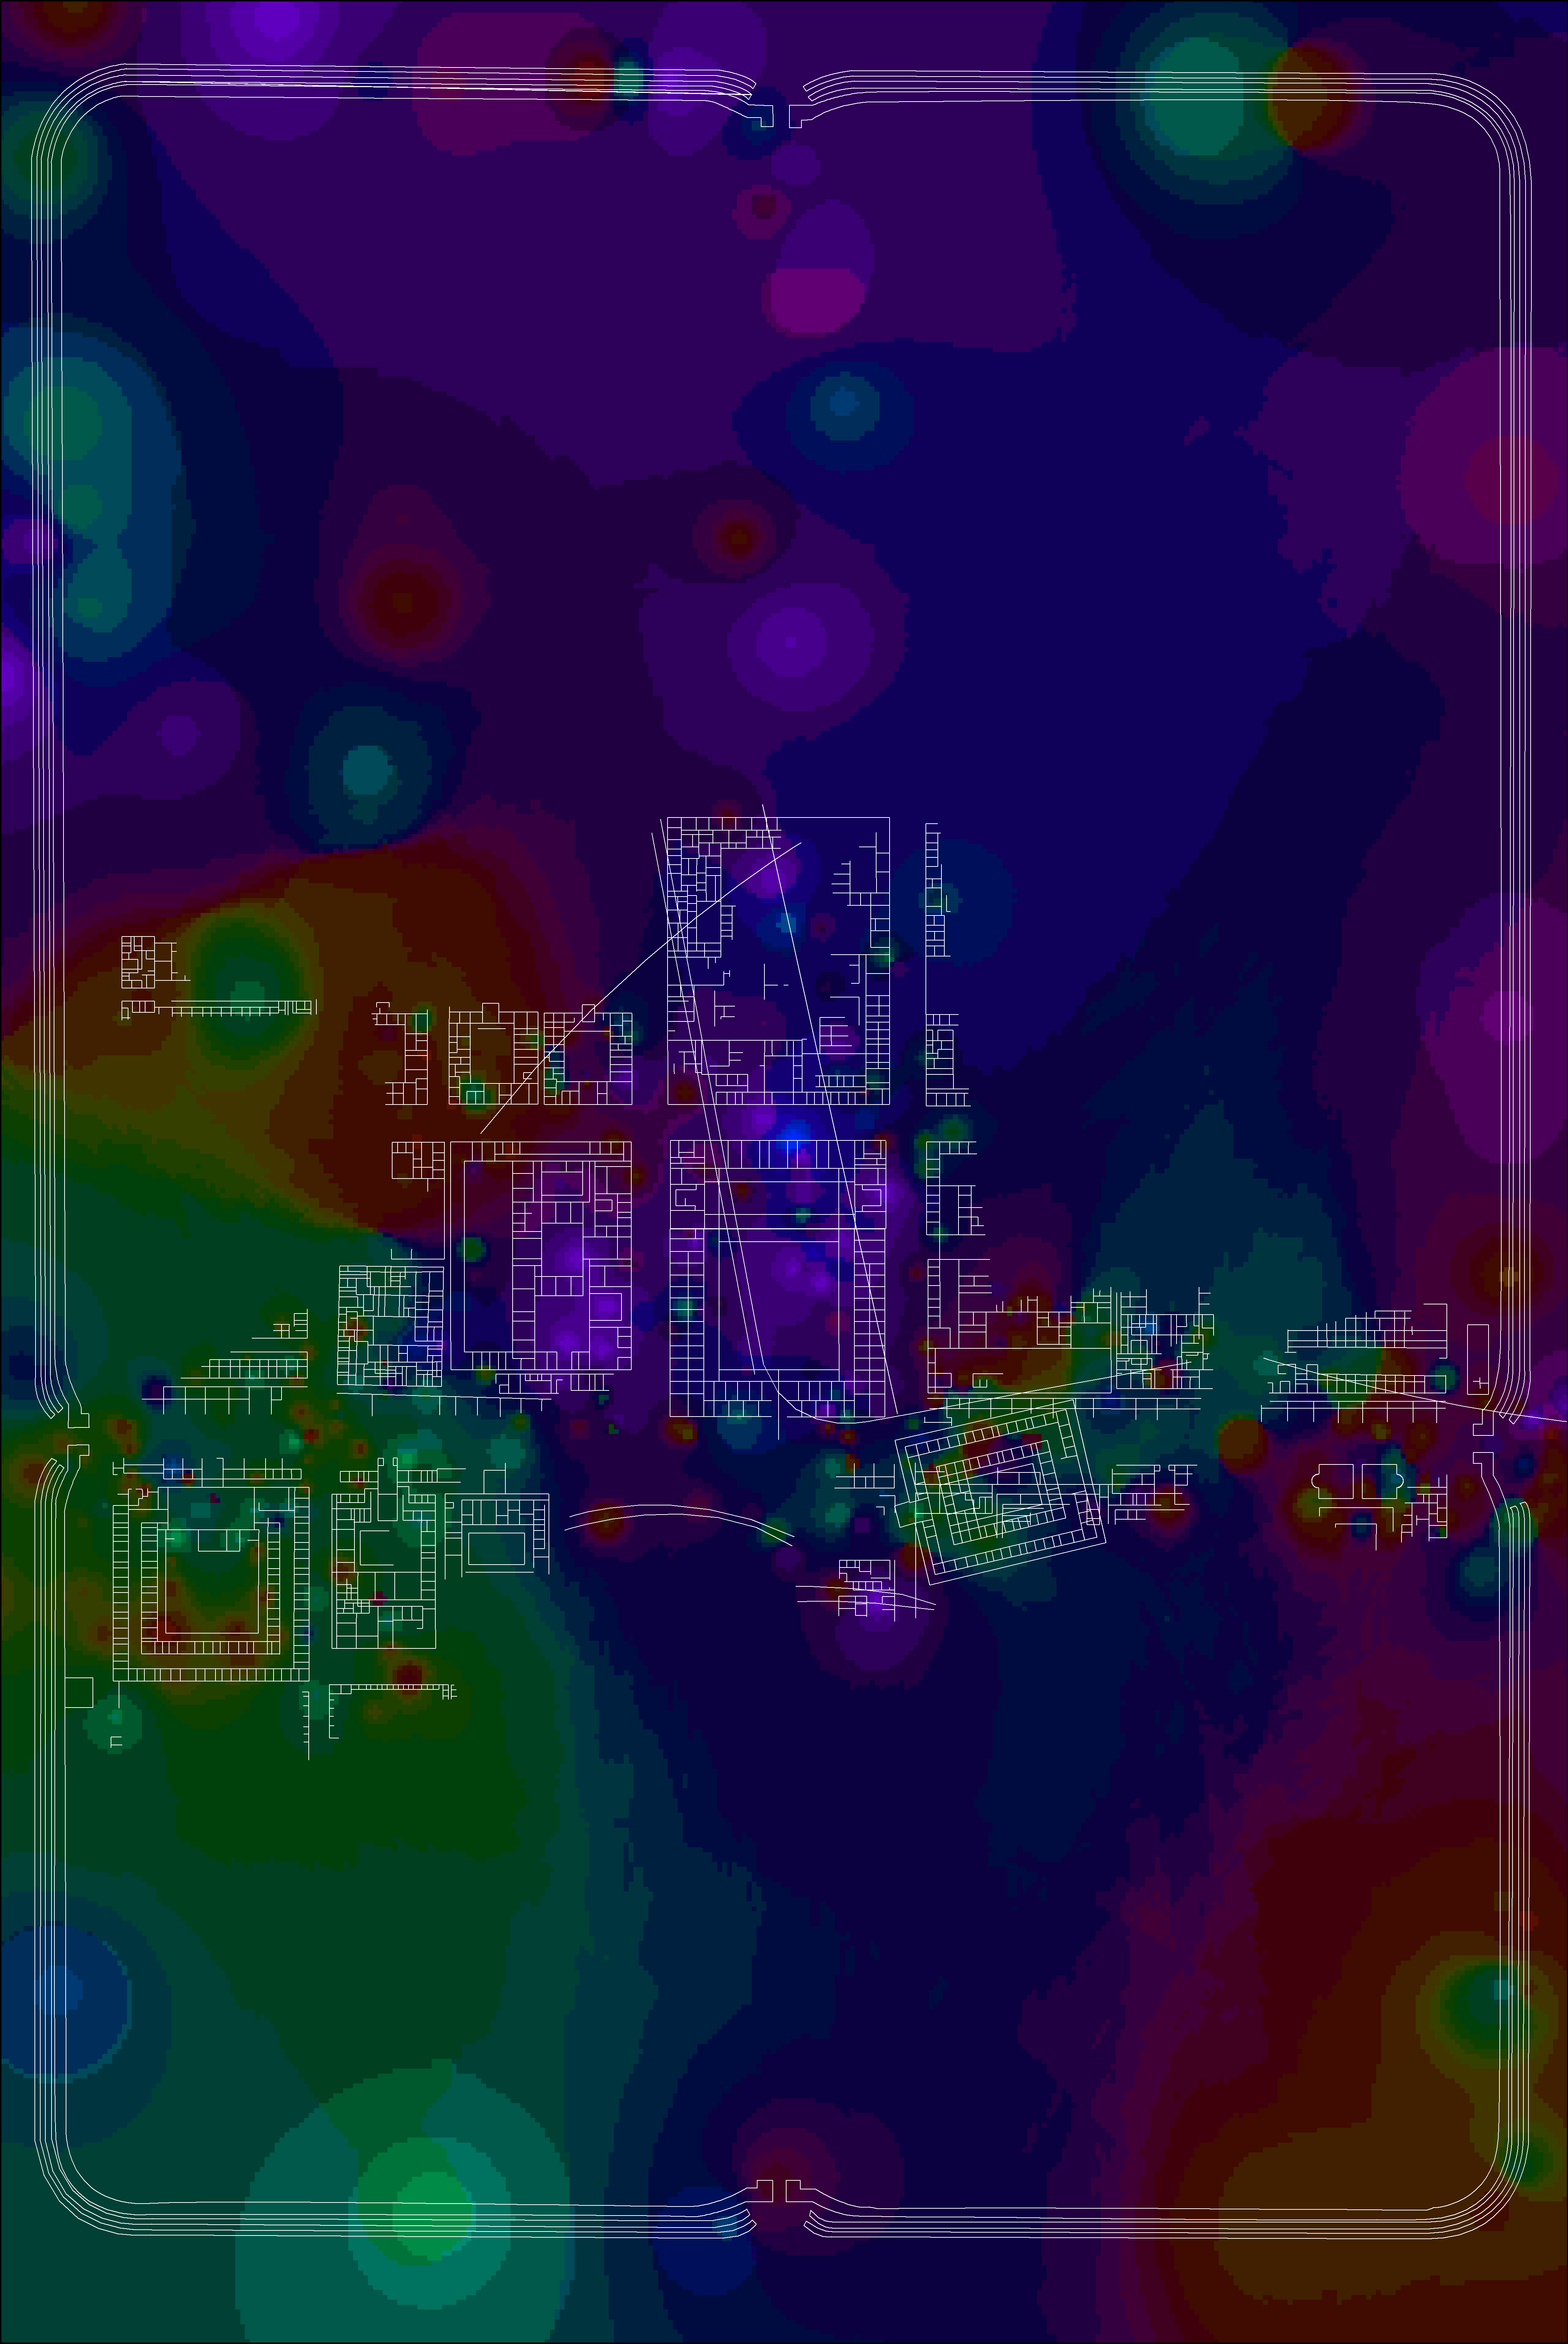
Figure 9: Combined interpolations of CA first and second axis scores with an HSV colour model.
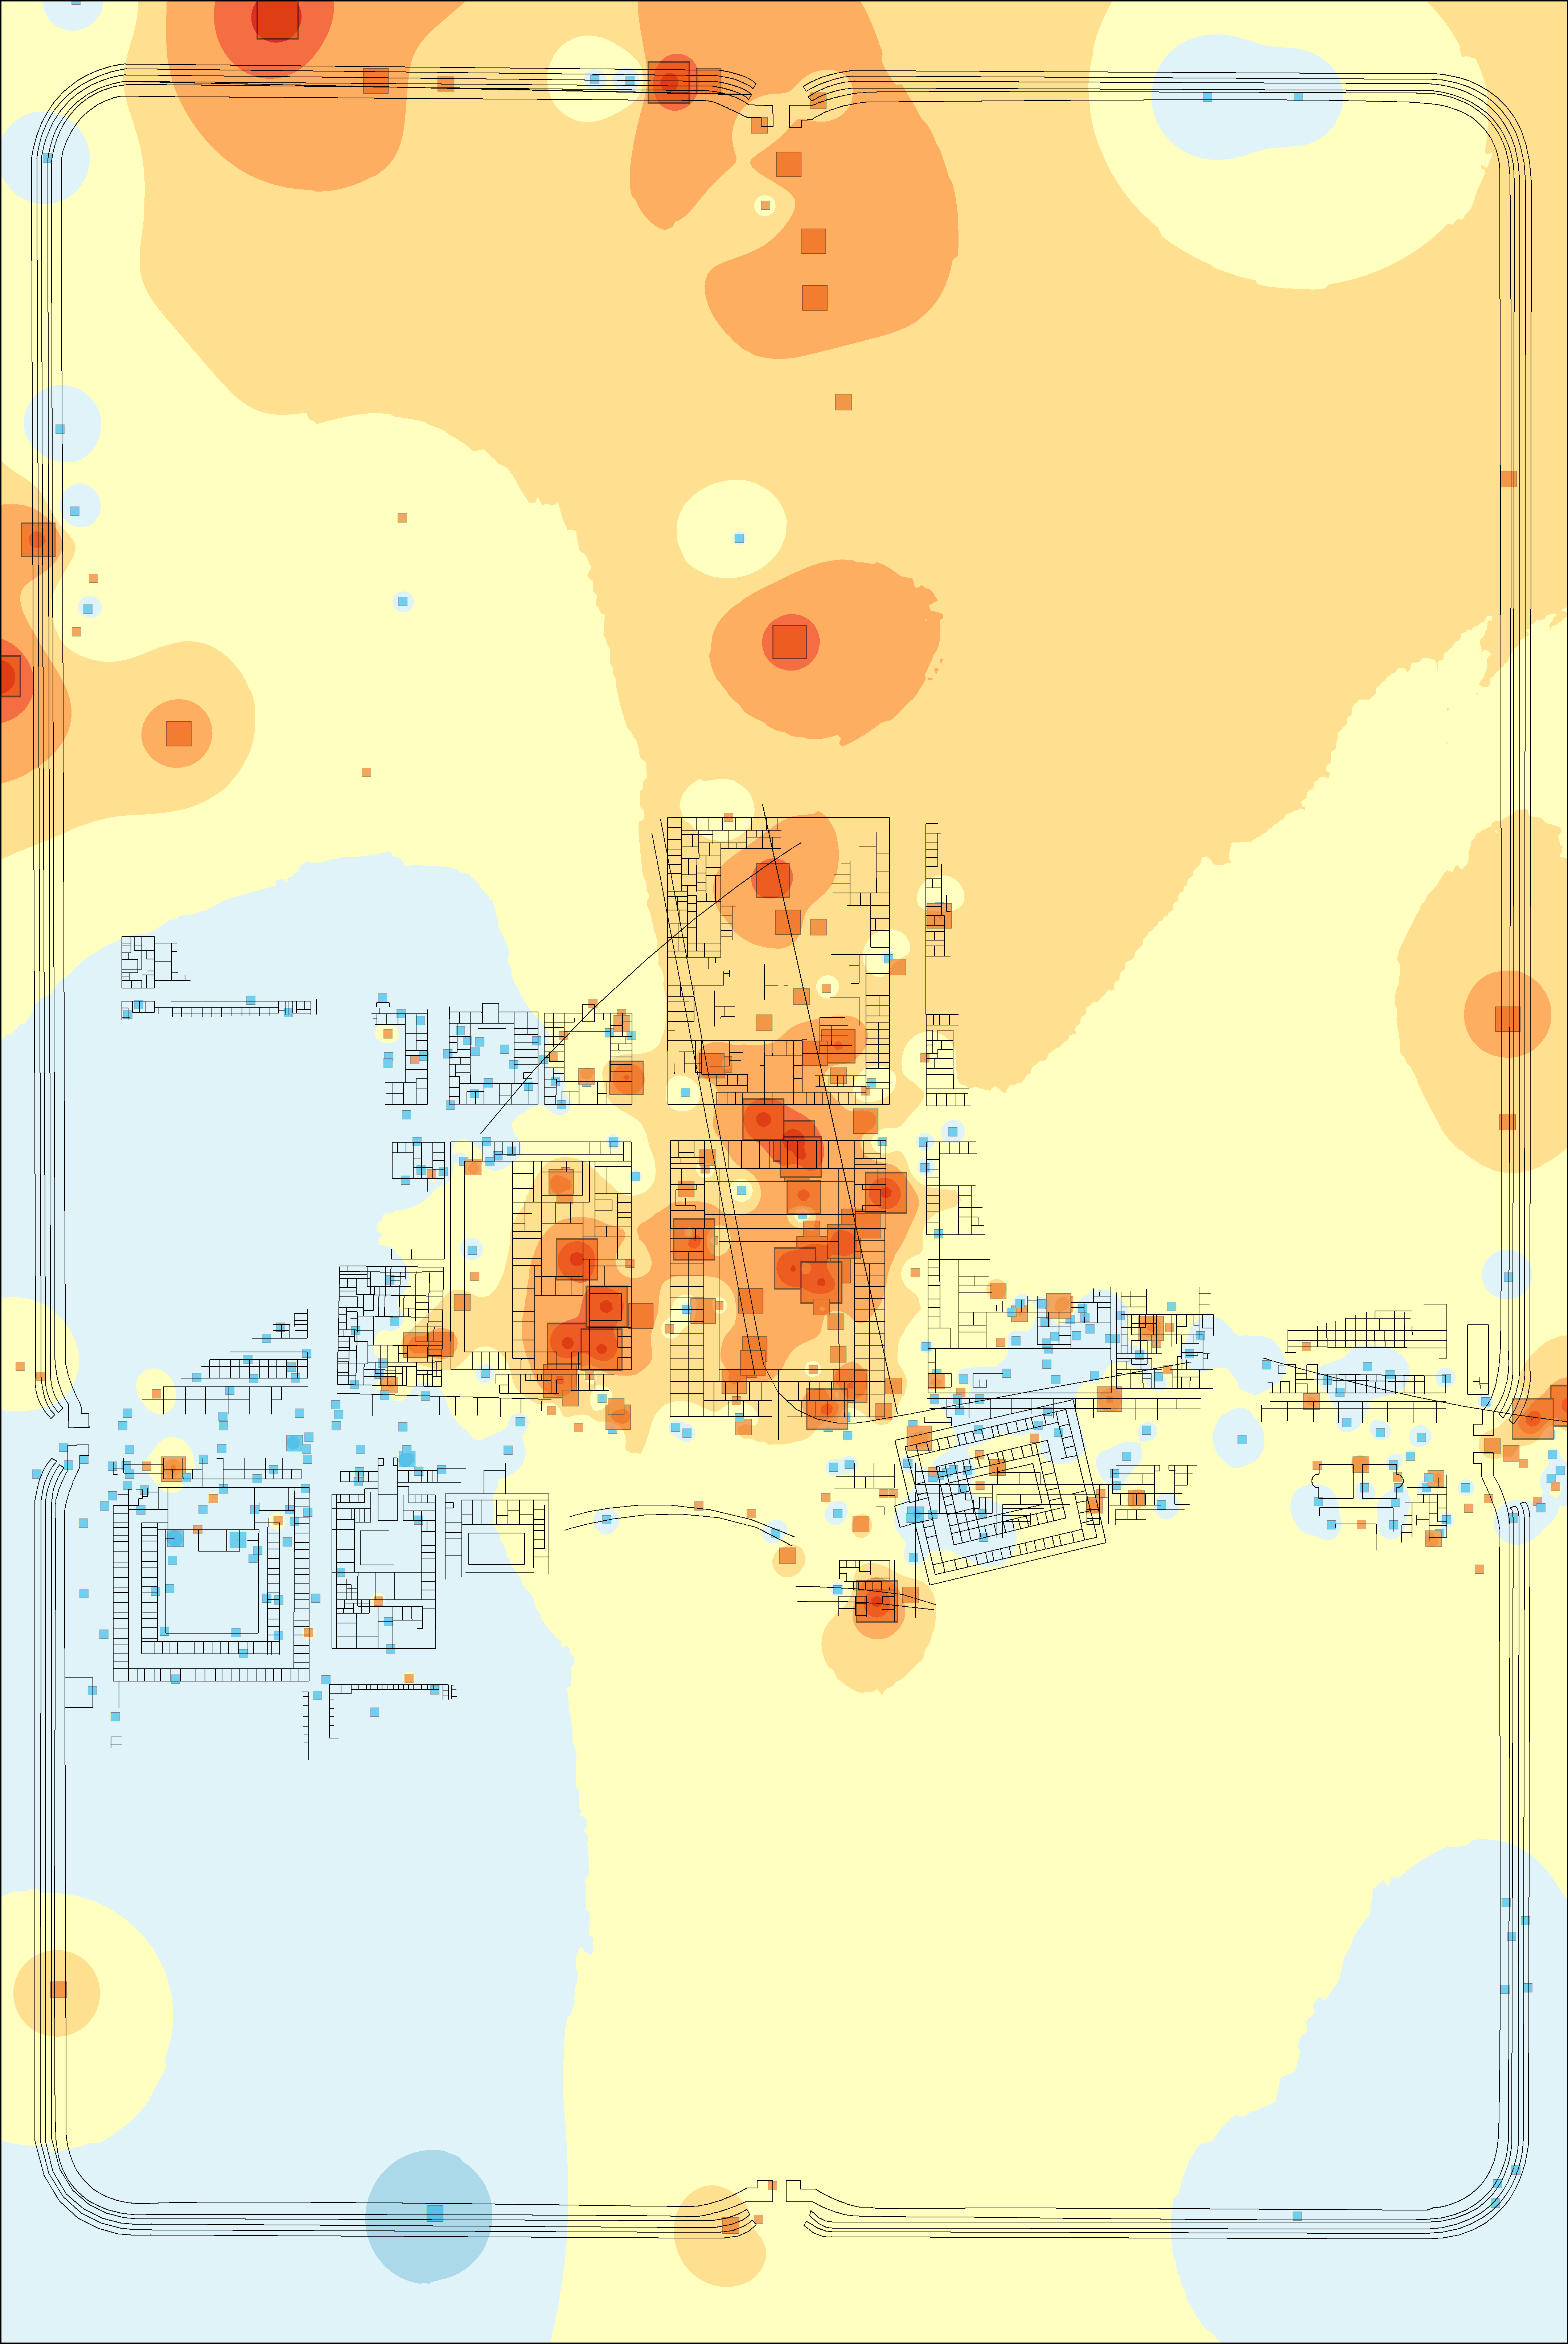
Figure 10: Interpolations of SCA first axis scores.
Figure 11: Interpolations of SCA second axis scores.
Figure 12: Combined interpolations of first and second SCA axis scores with an HSV colour model.
Figure 13: SCA bi-plot of diagnostic sherds fabrics from Vetera I with hues used in the HSV colour model. [SVG file]
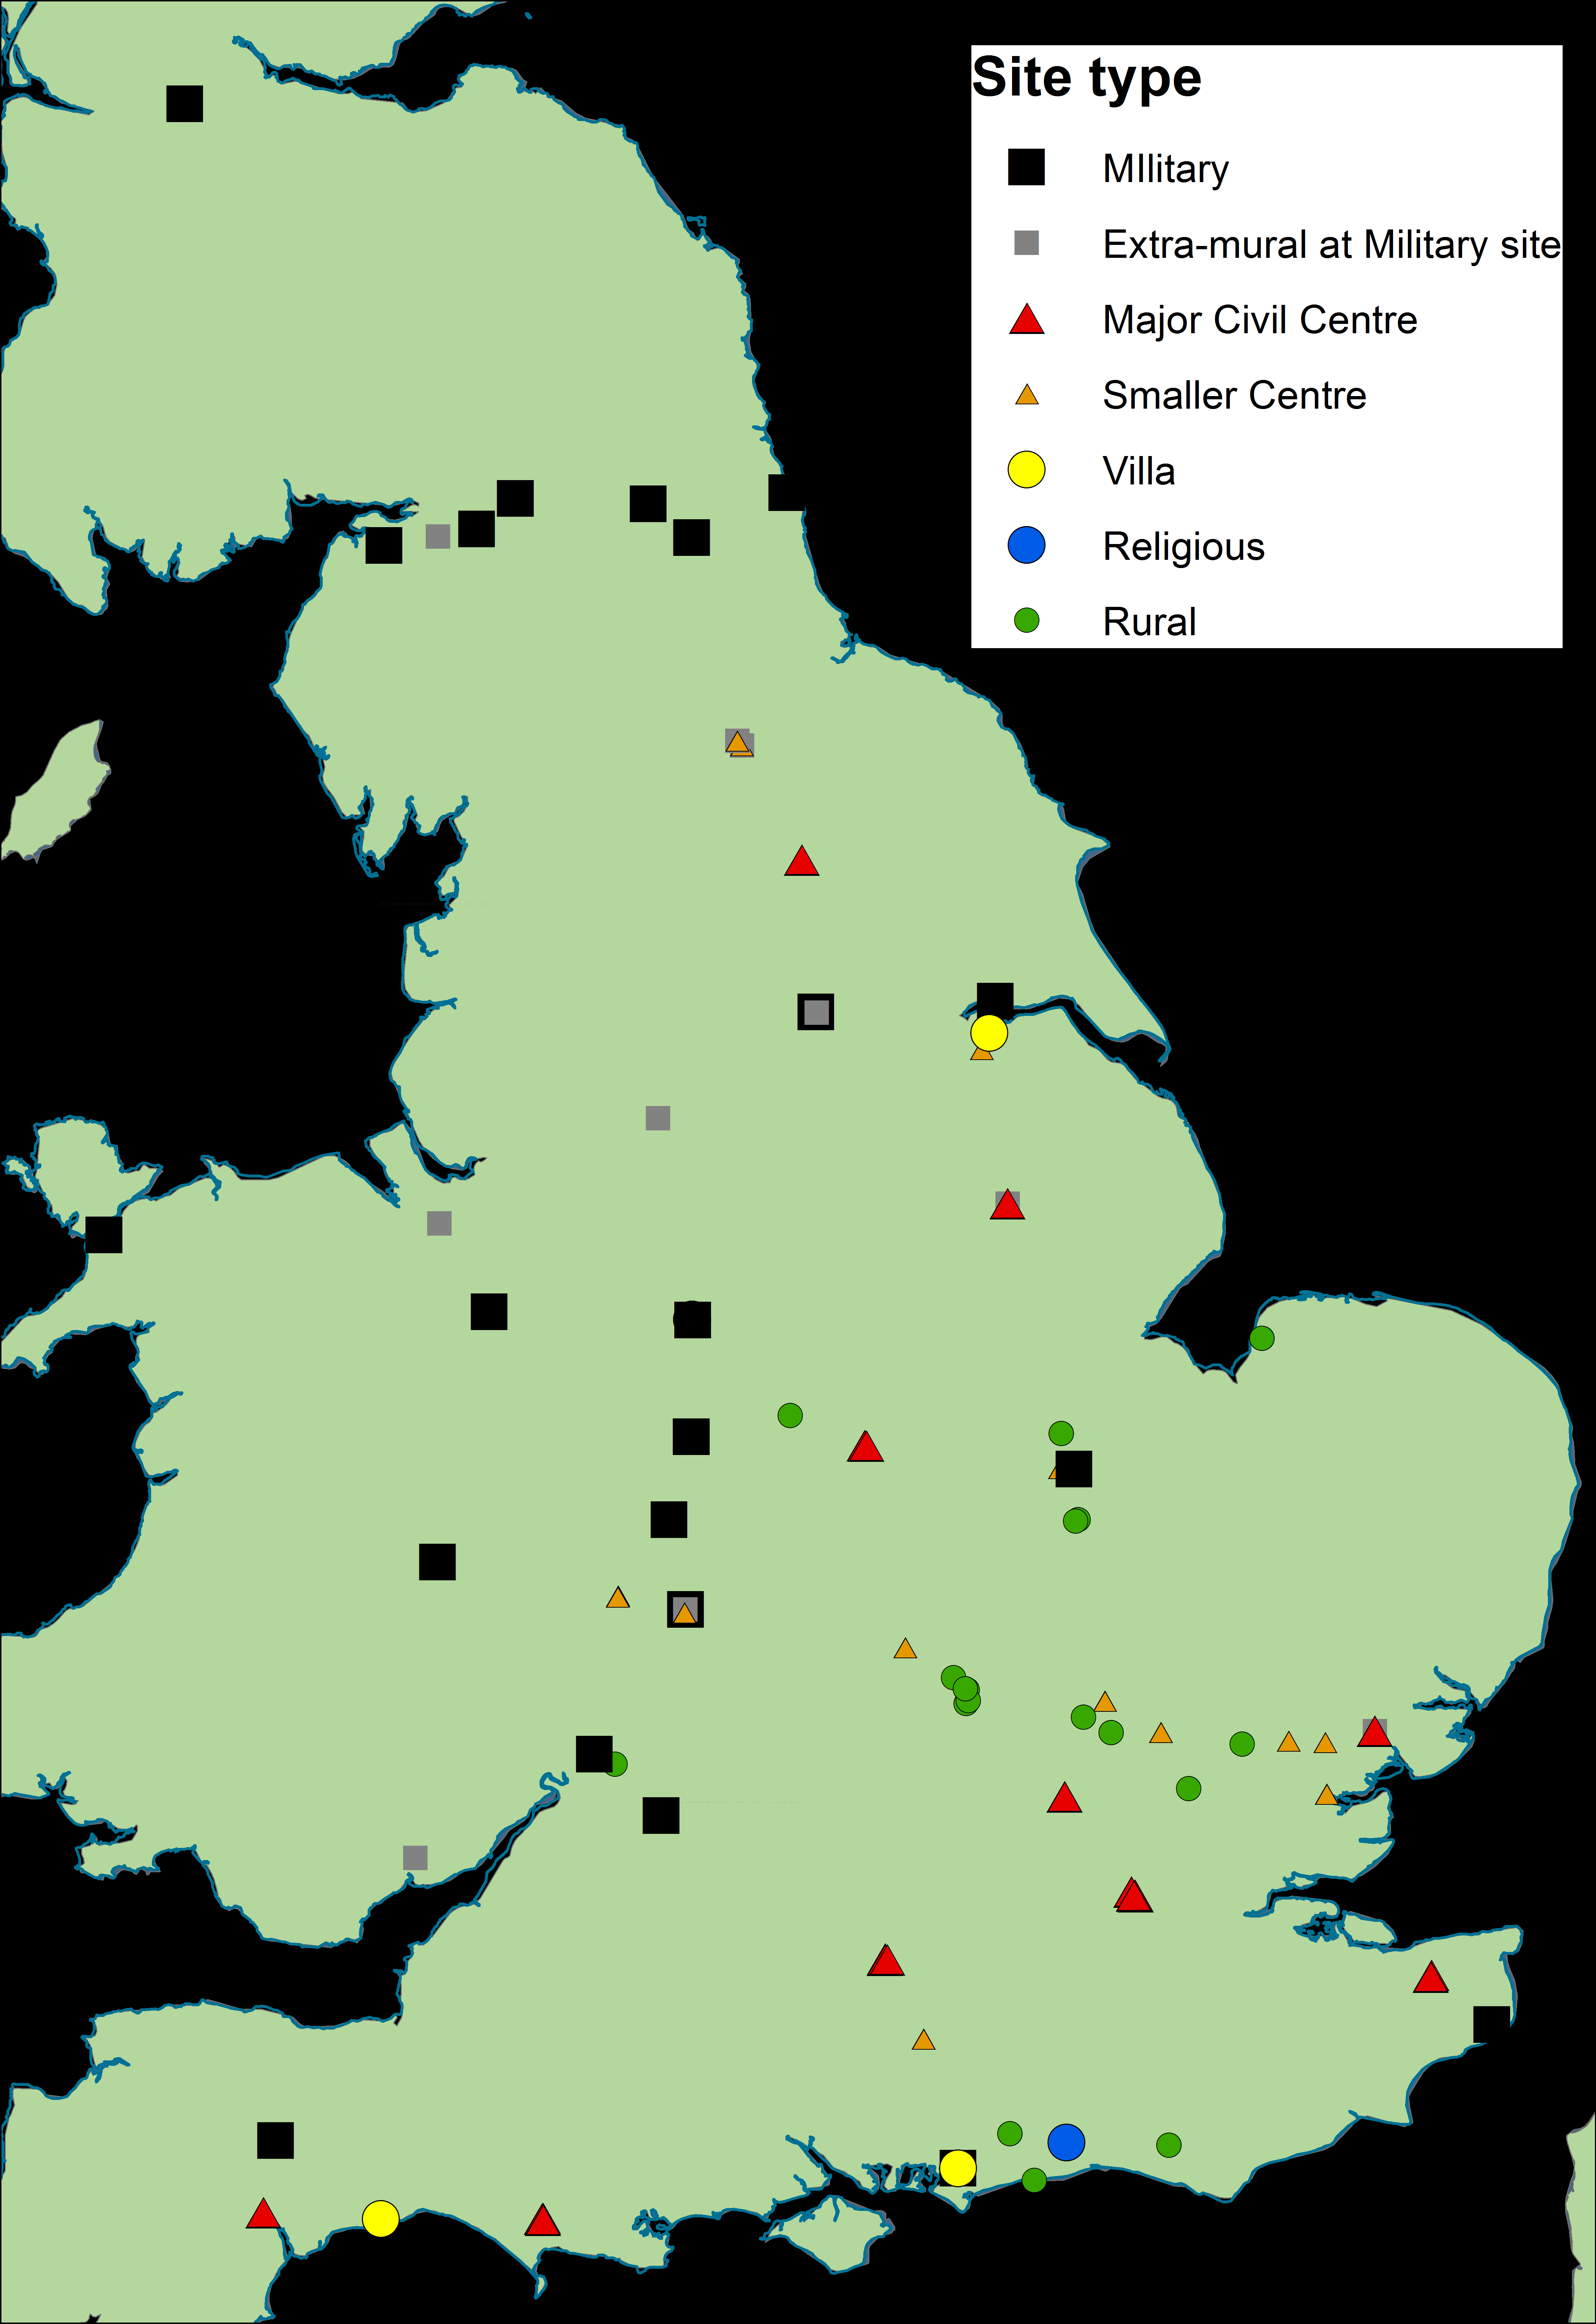
Figure 14: Distribution of different site types with terra sigillata assemblages, all phases.
Figure 15: Interpolation and point distribution of CA first axis scores of Samian dataset, all phases. [SVG file]
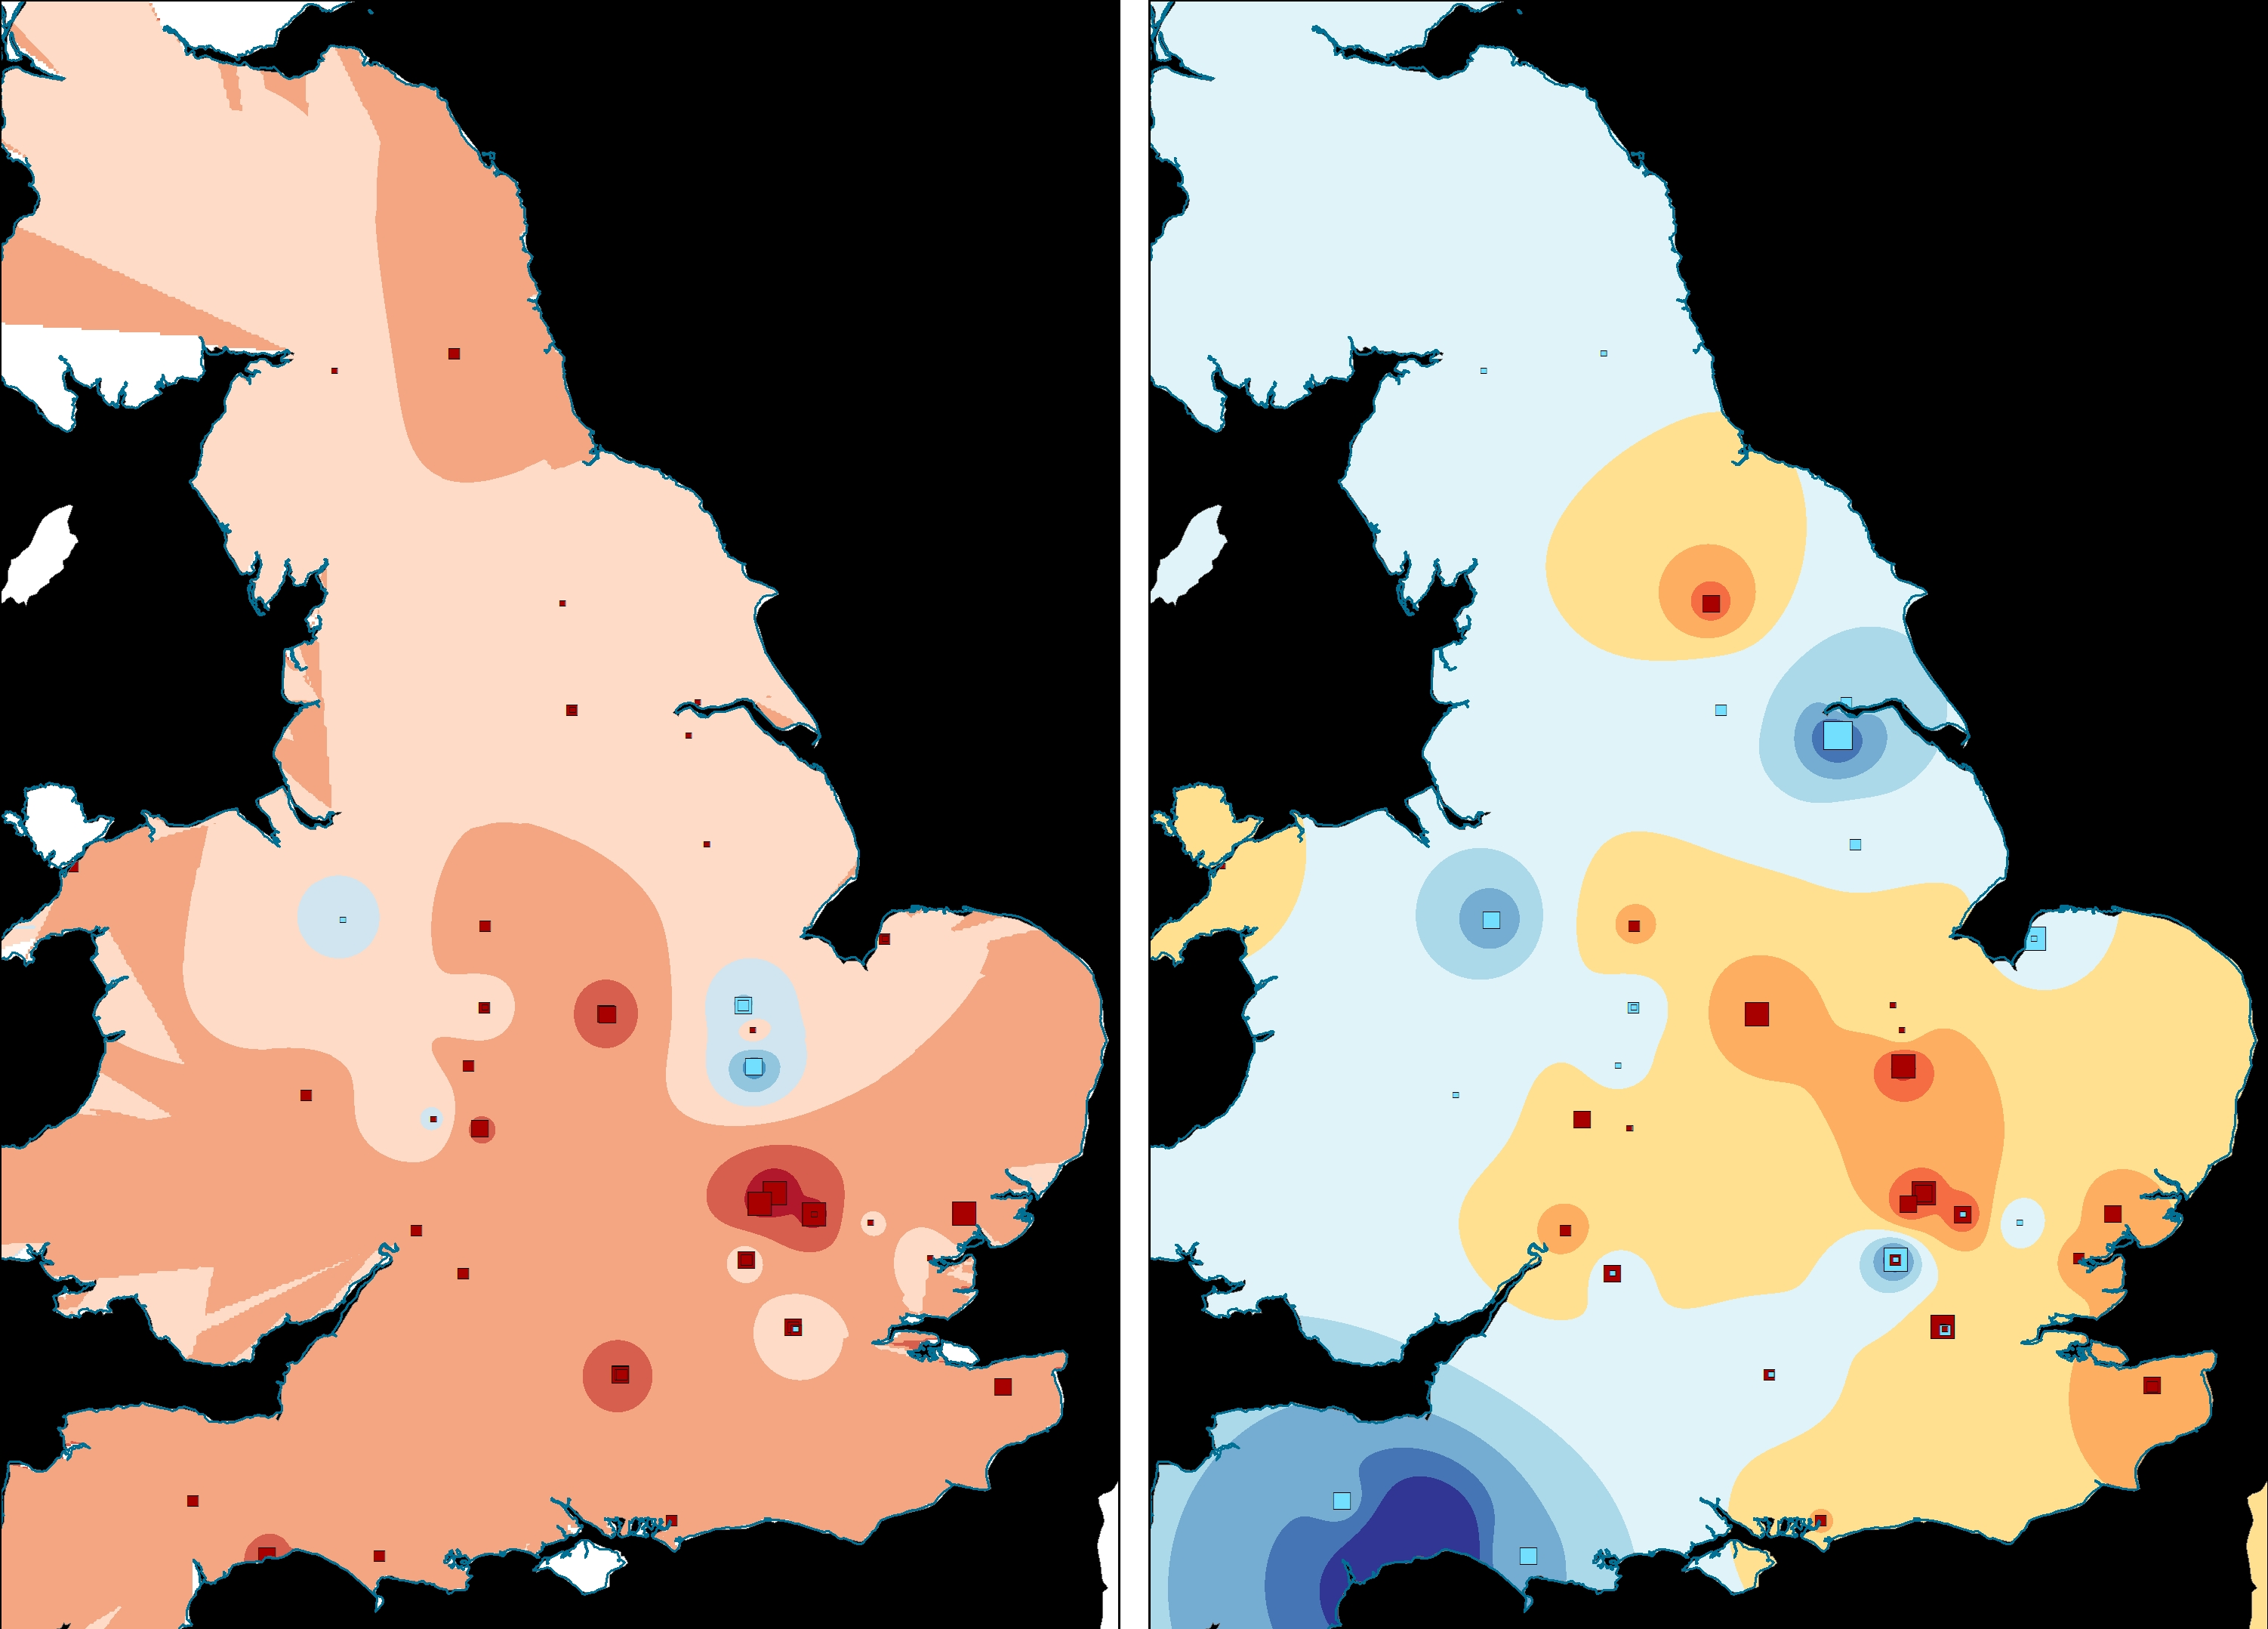
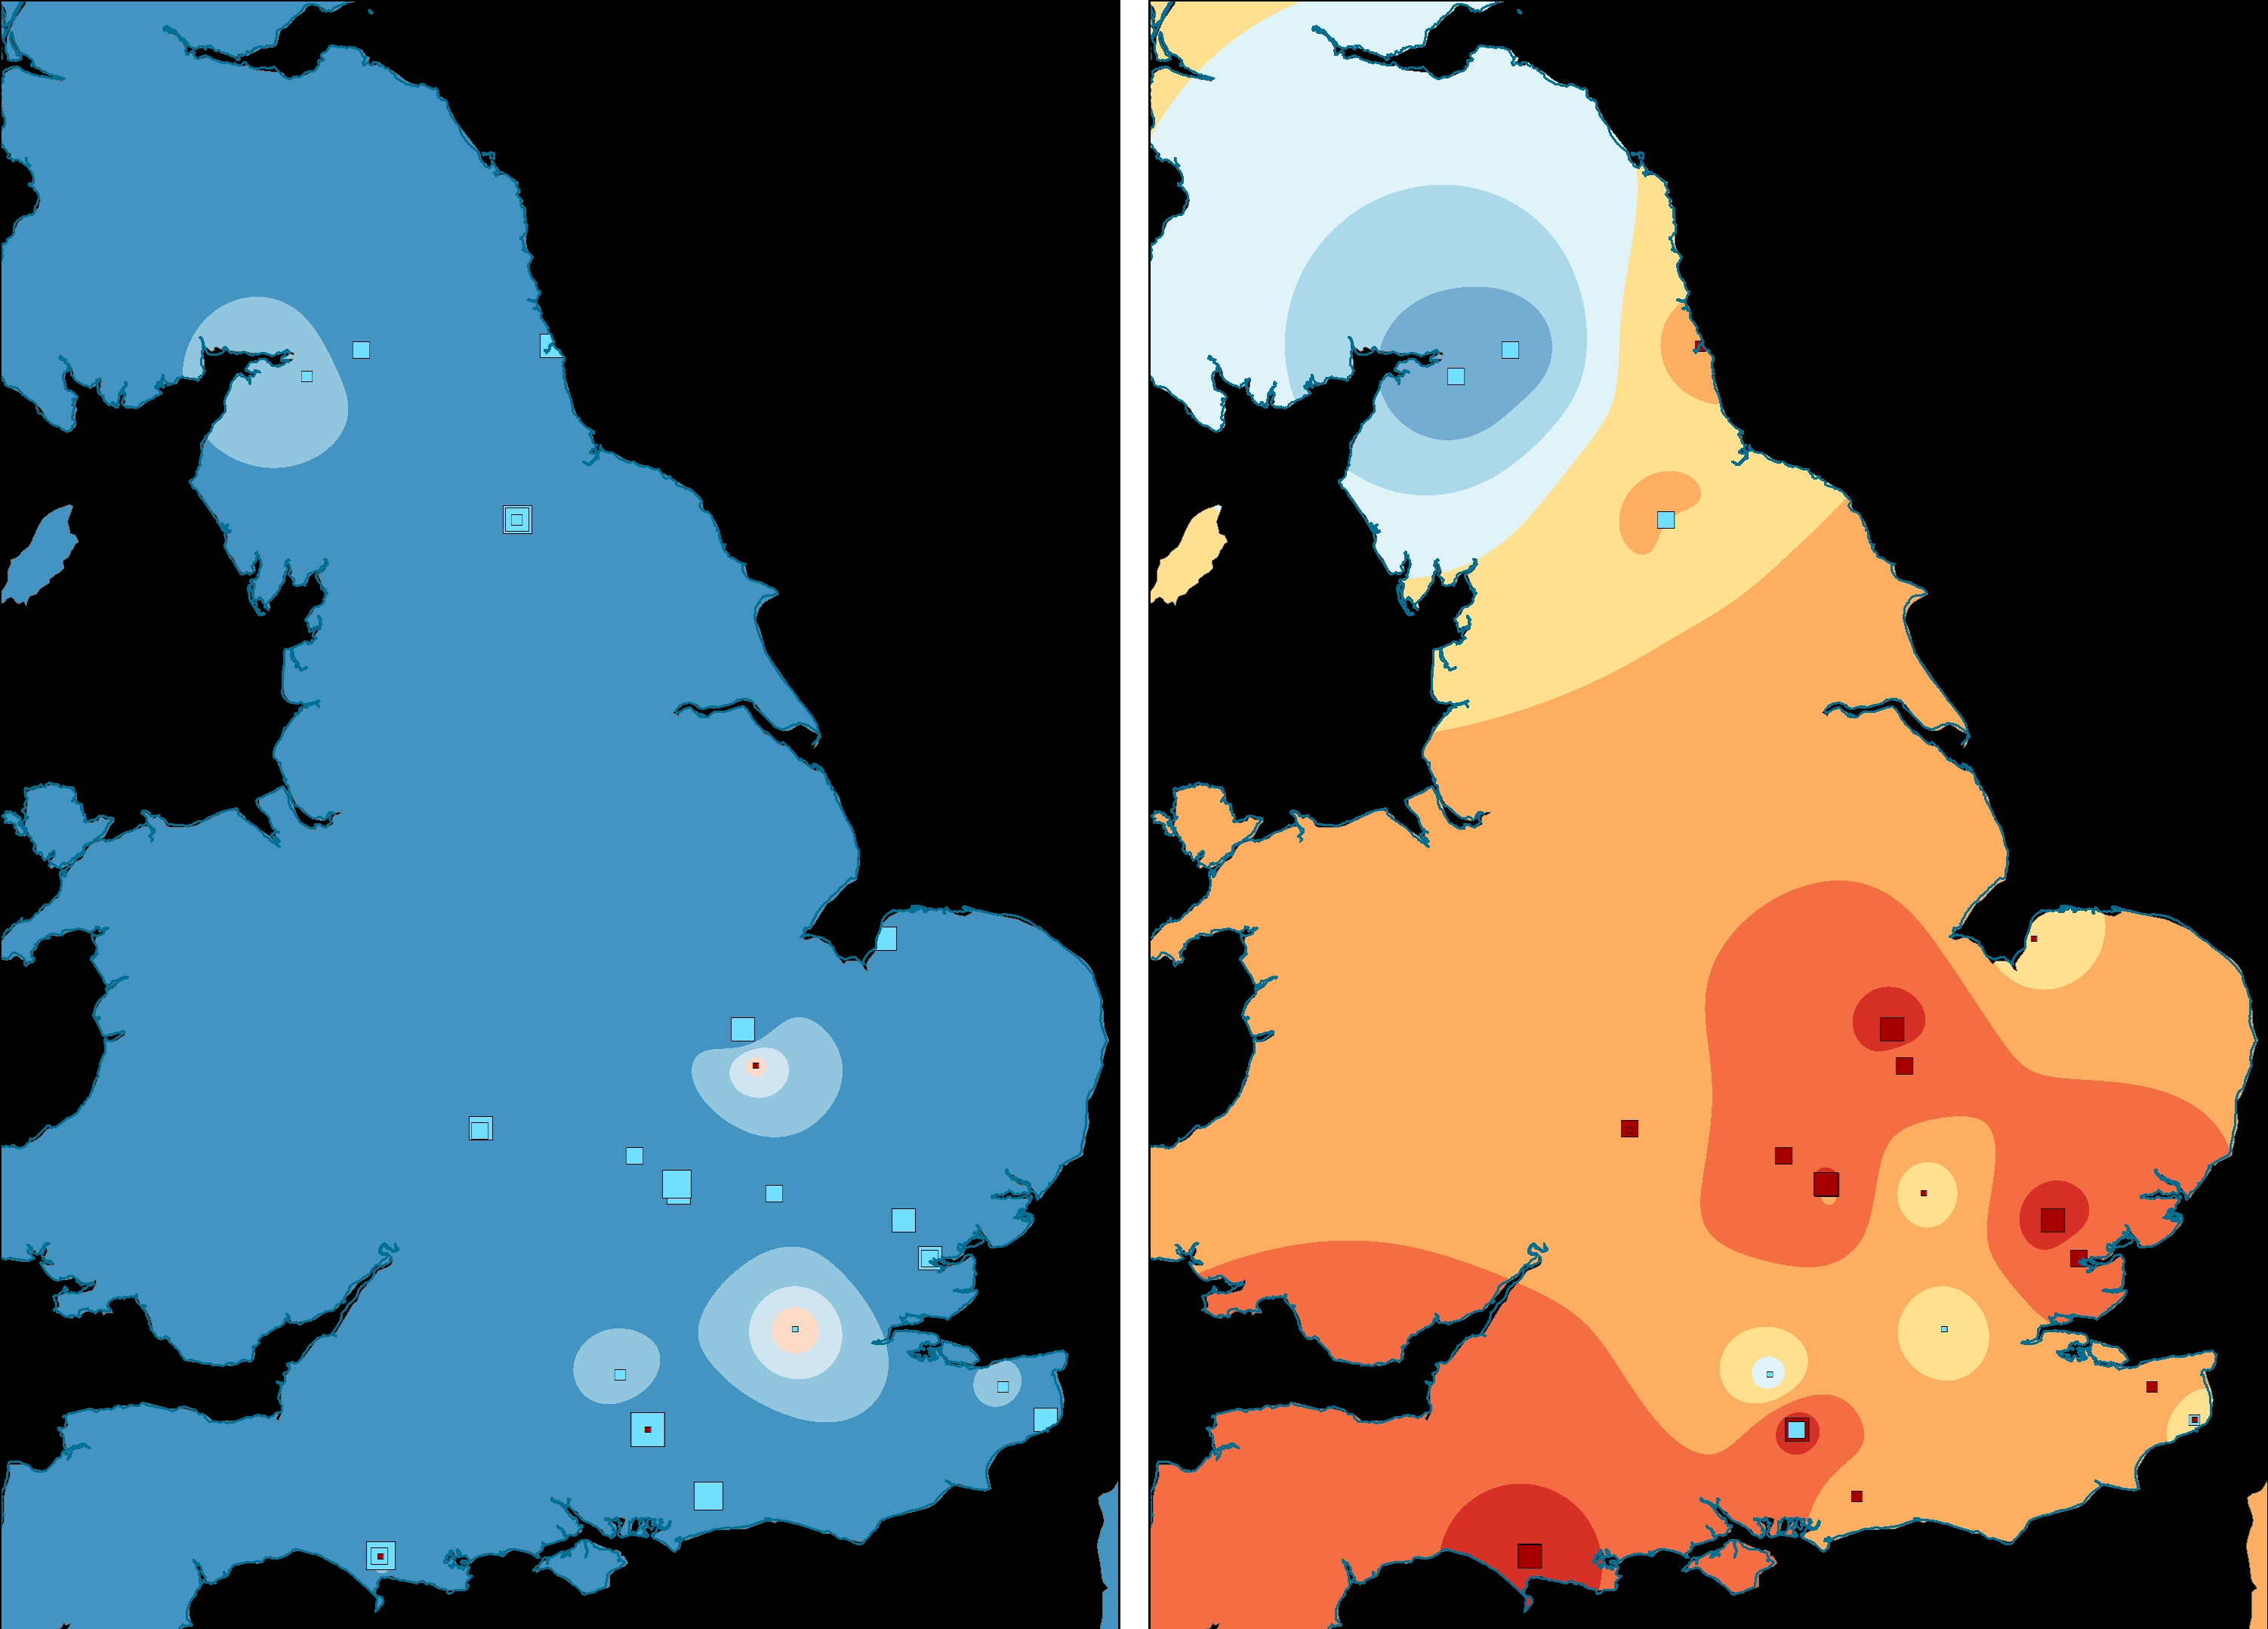
Figure 16 (left): Interpolation and point distribution of CA second axis scores of Samian dataset, all phases.
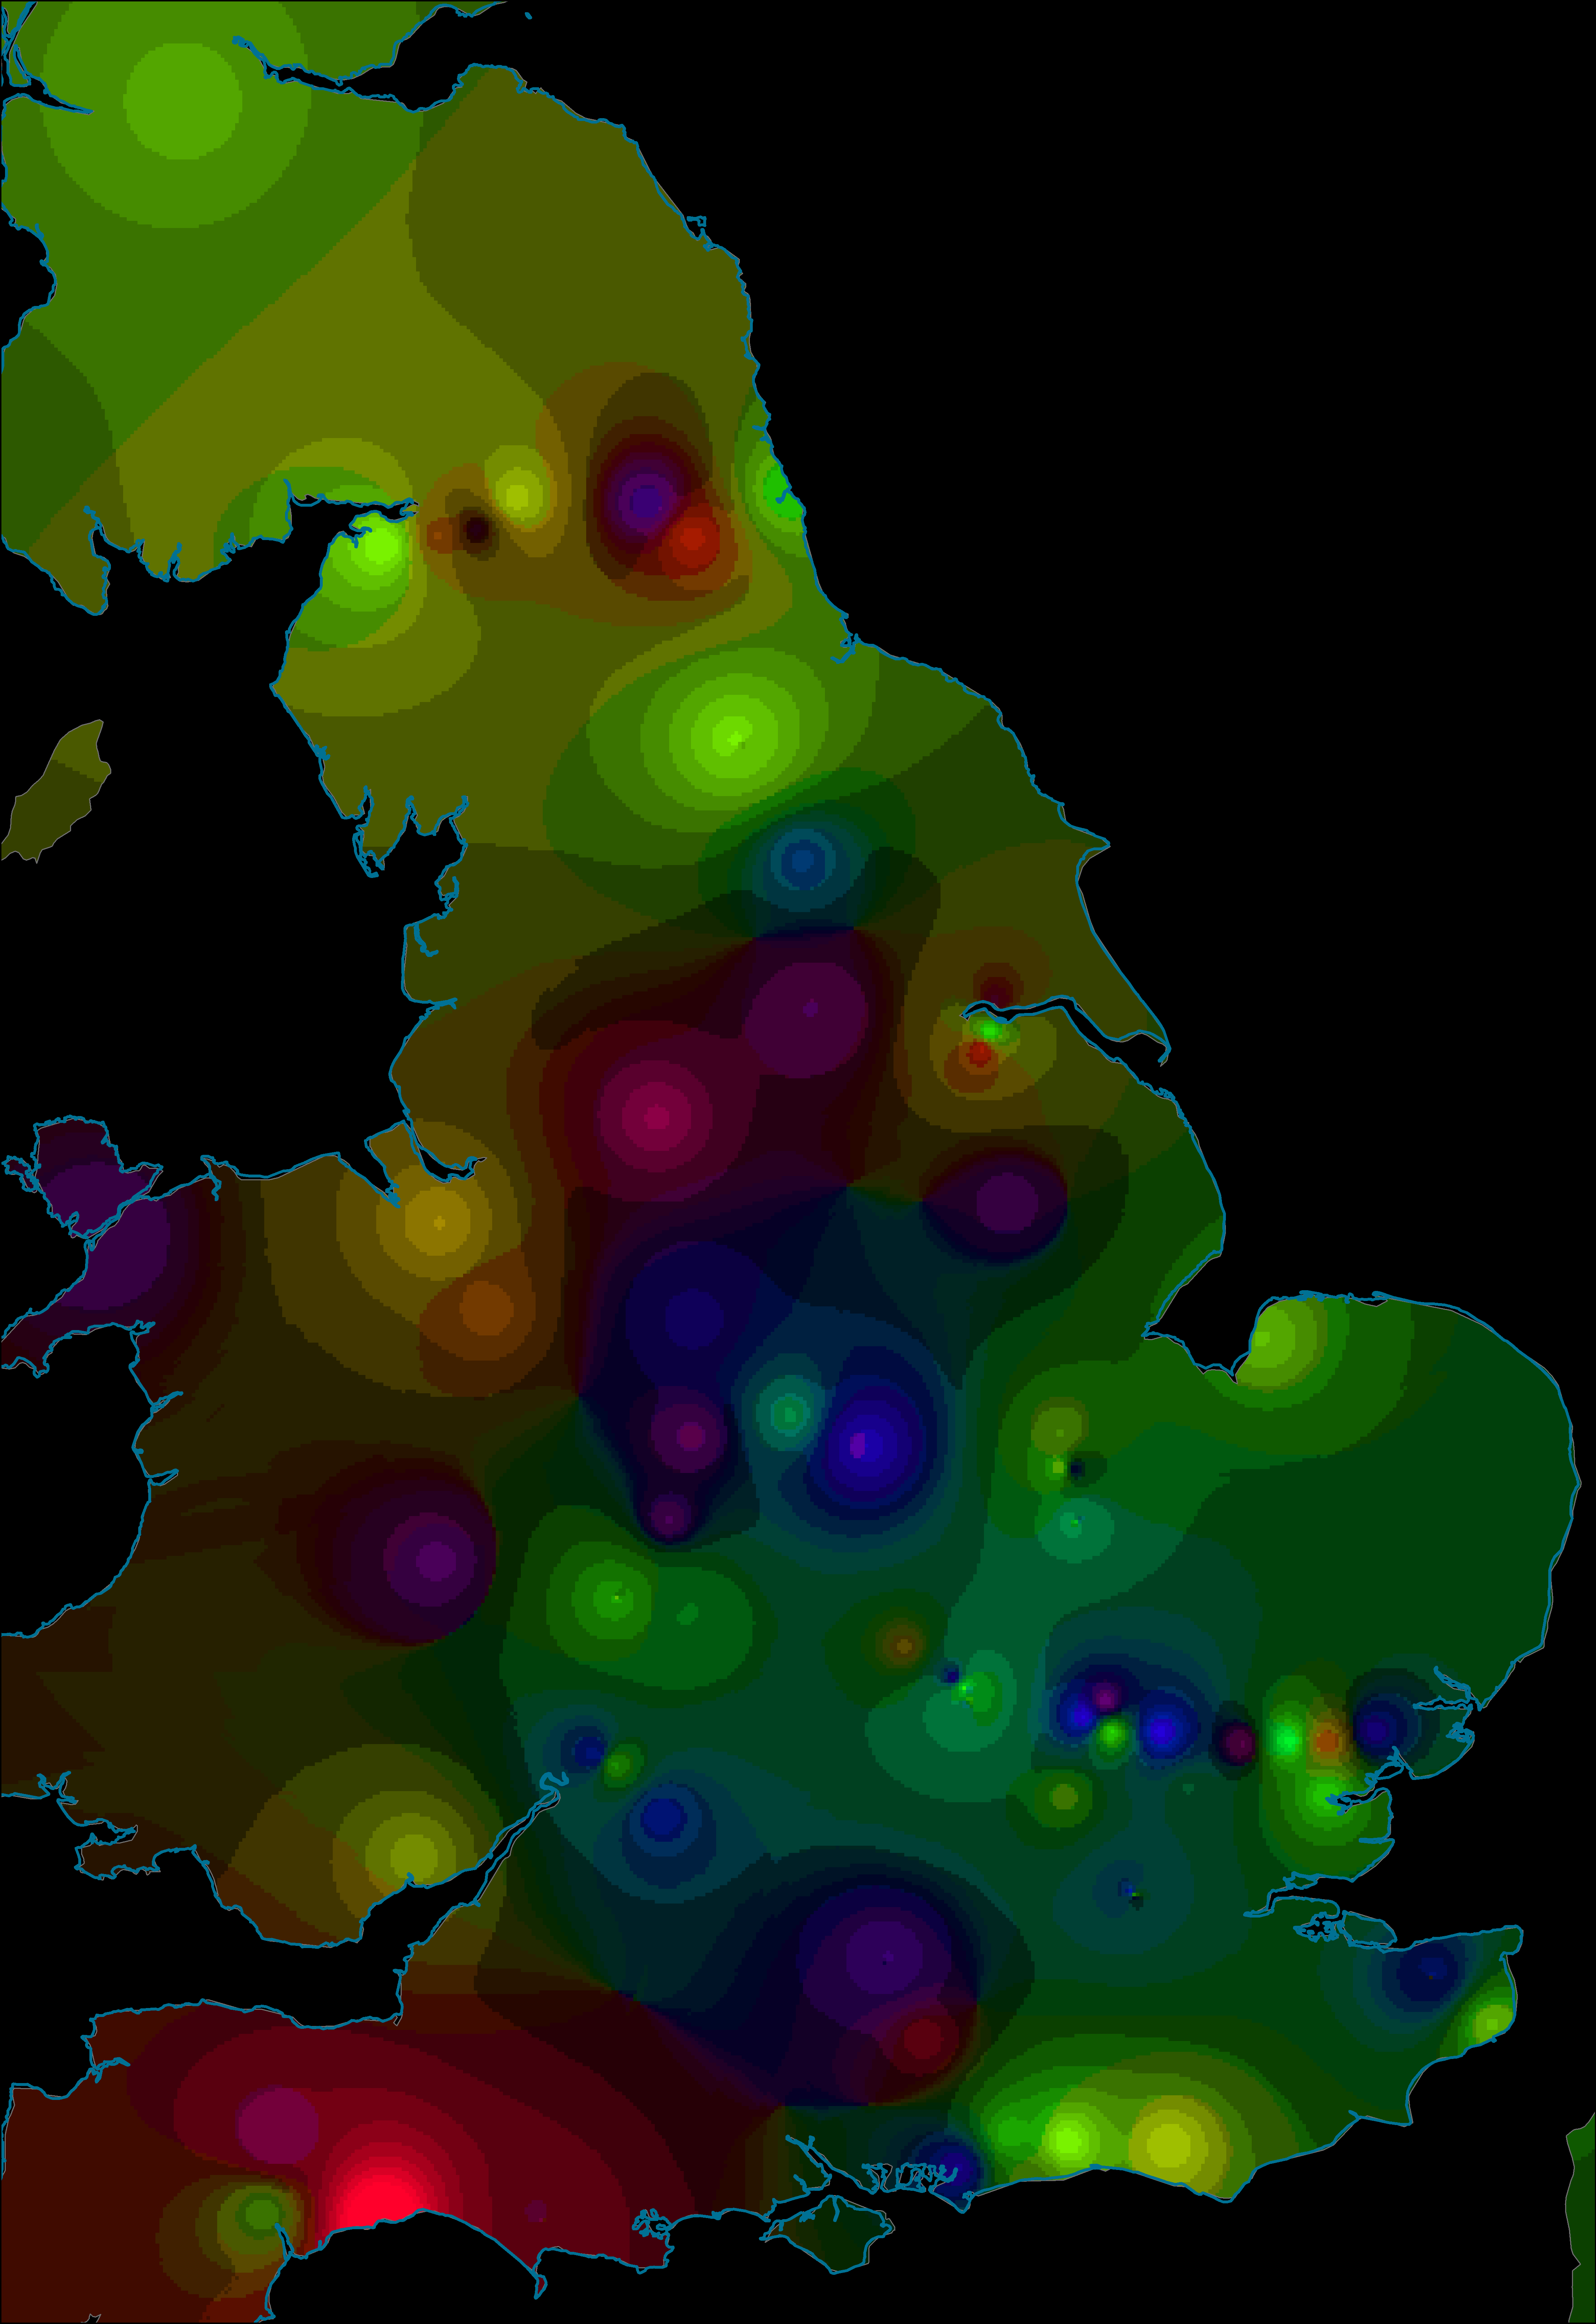
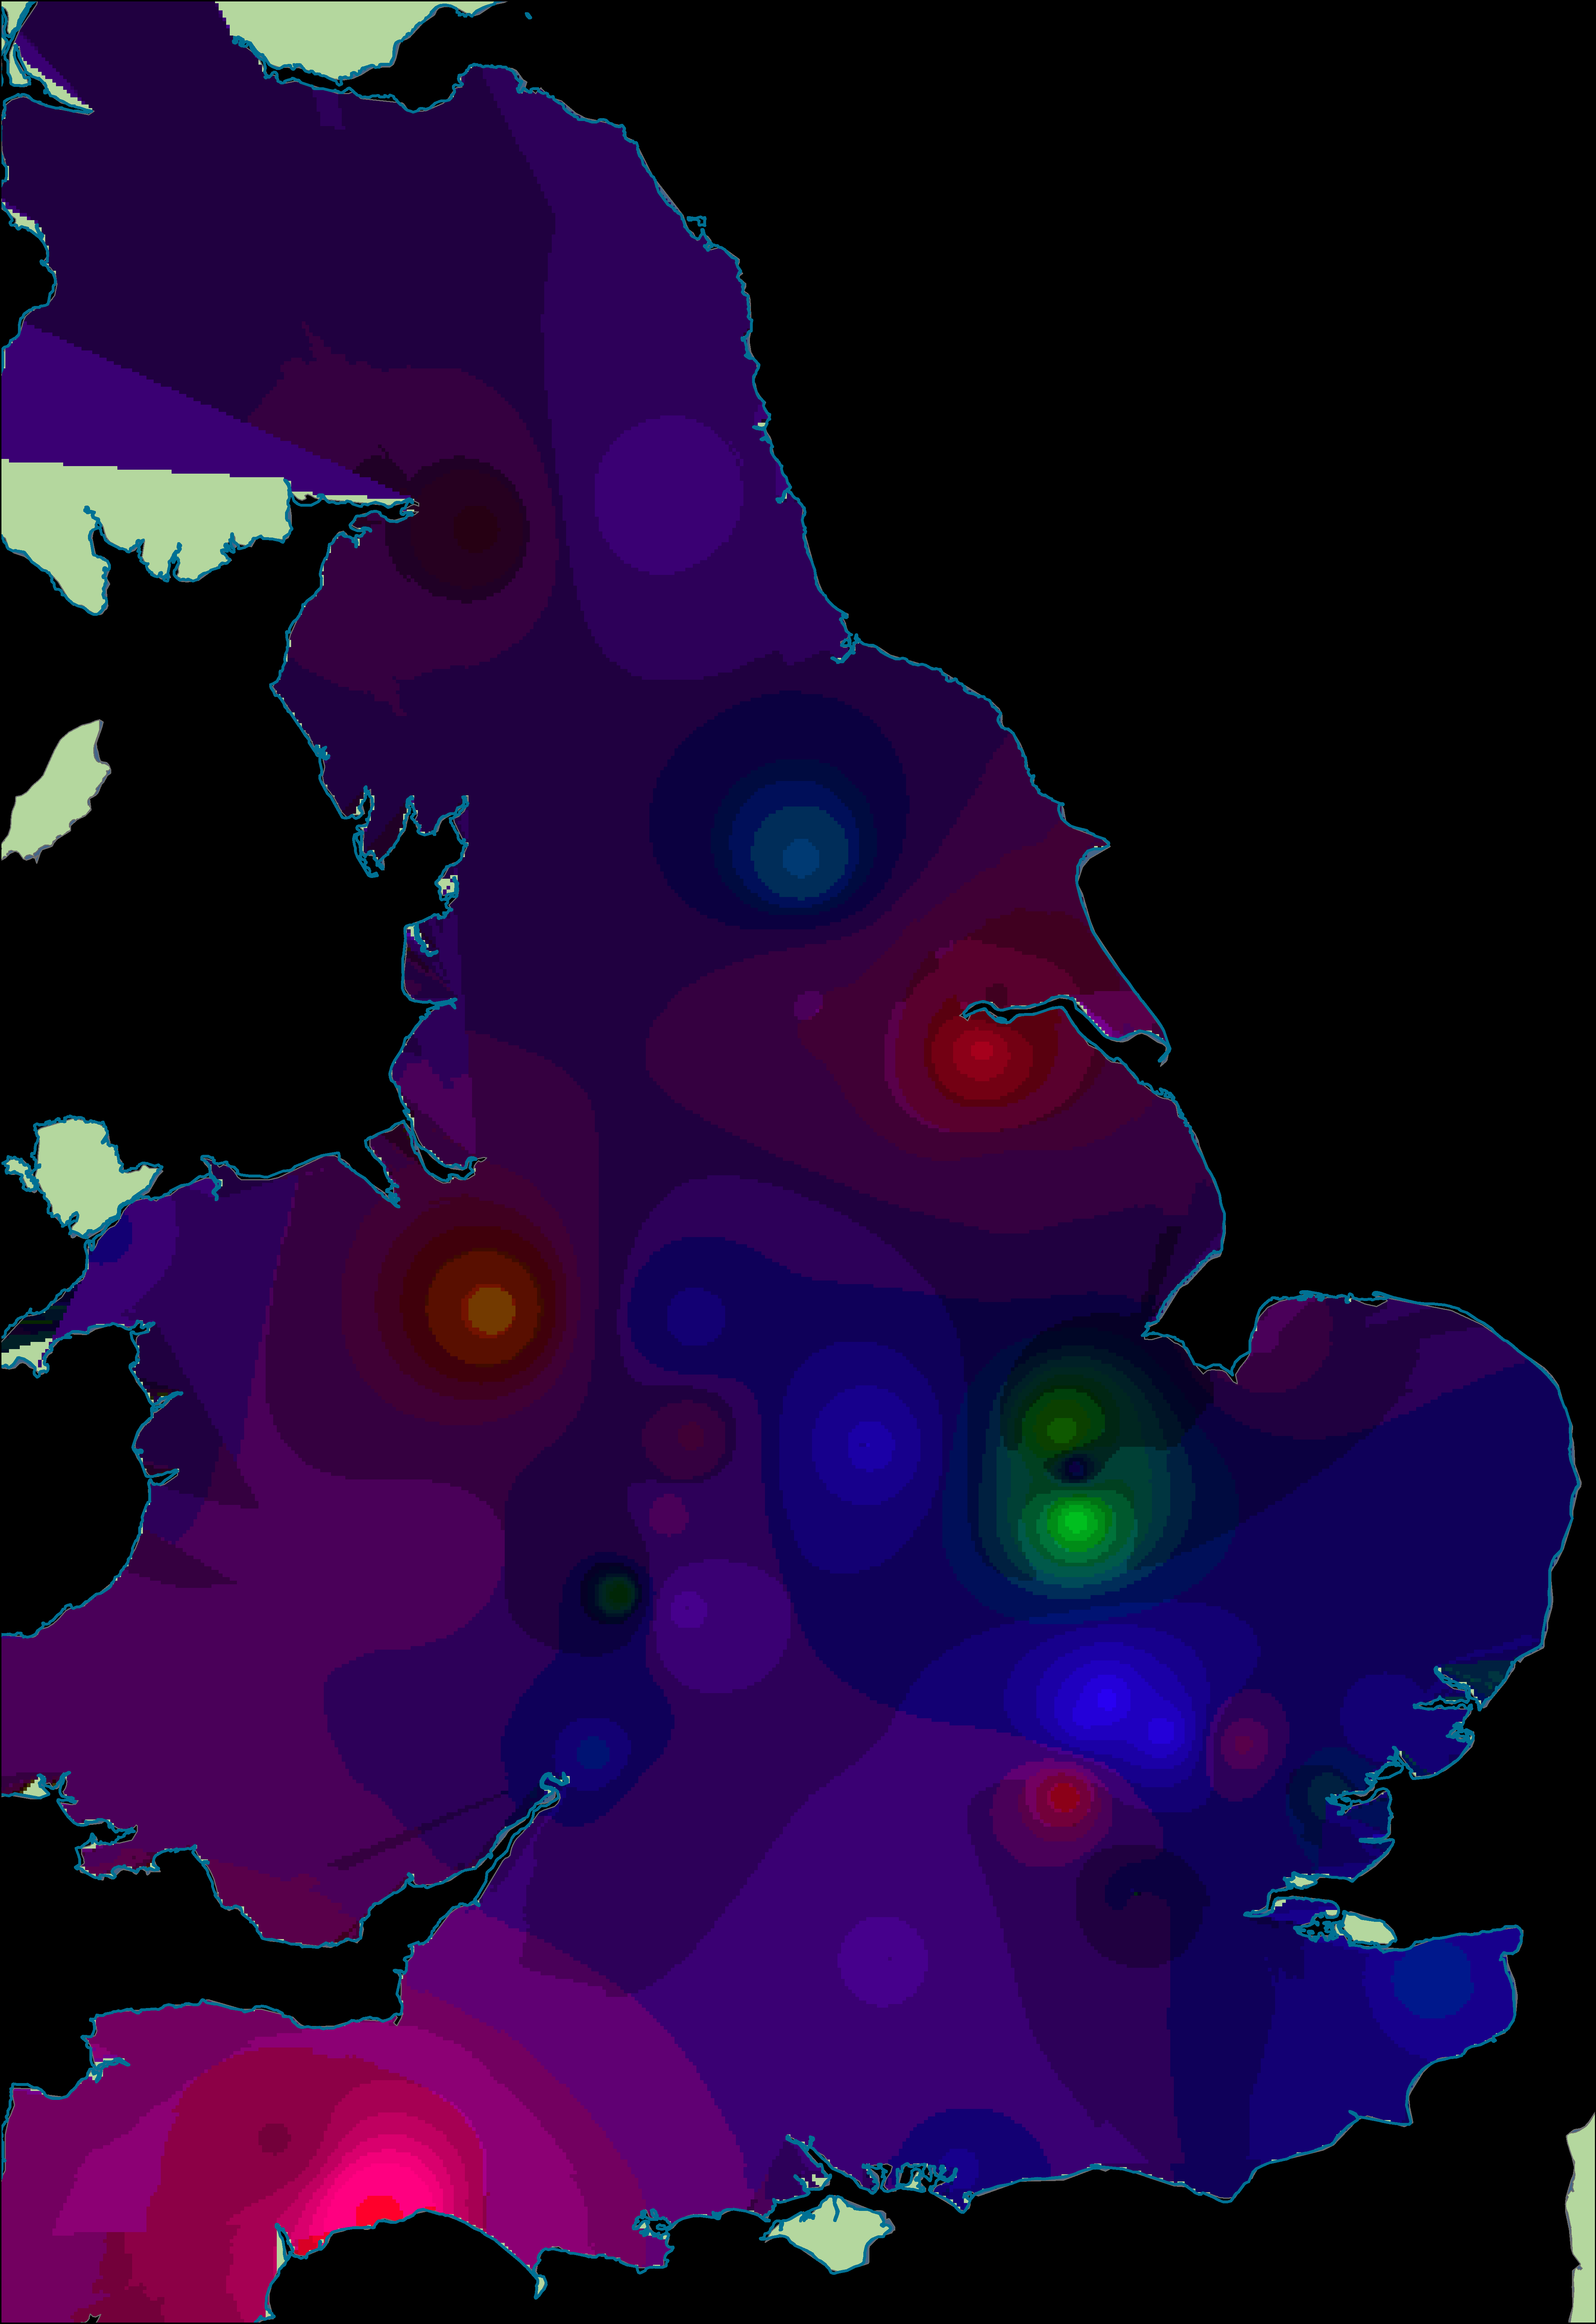
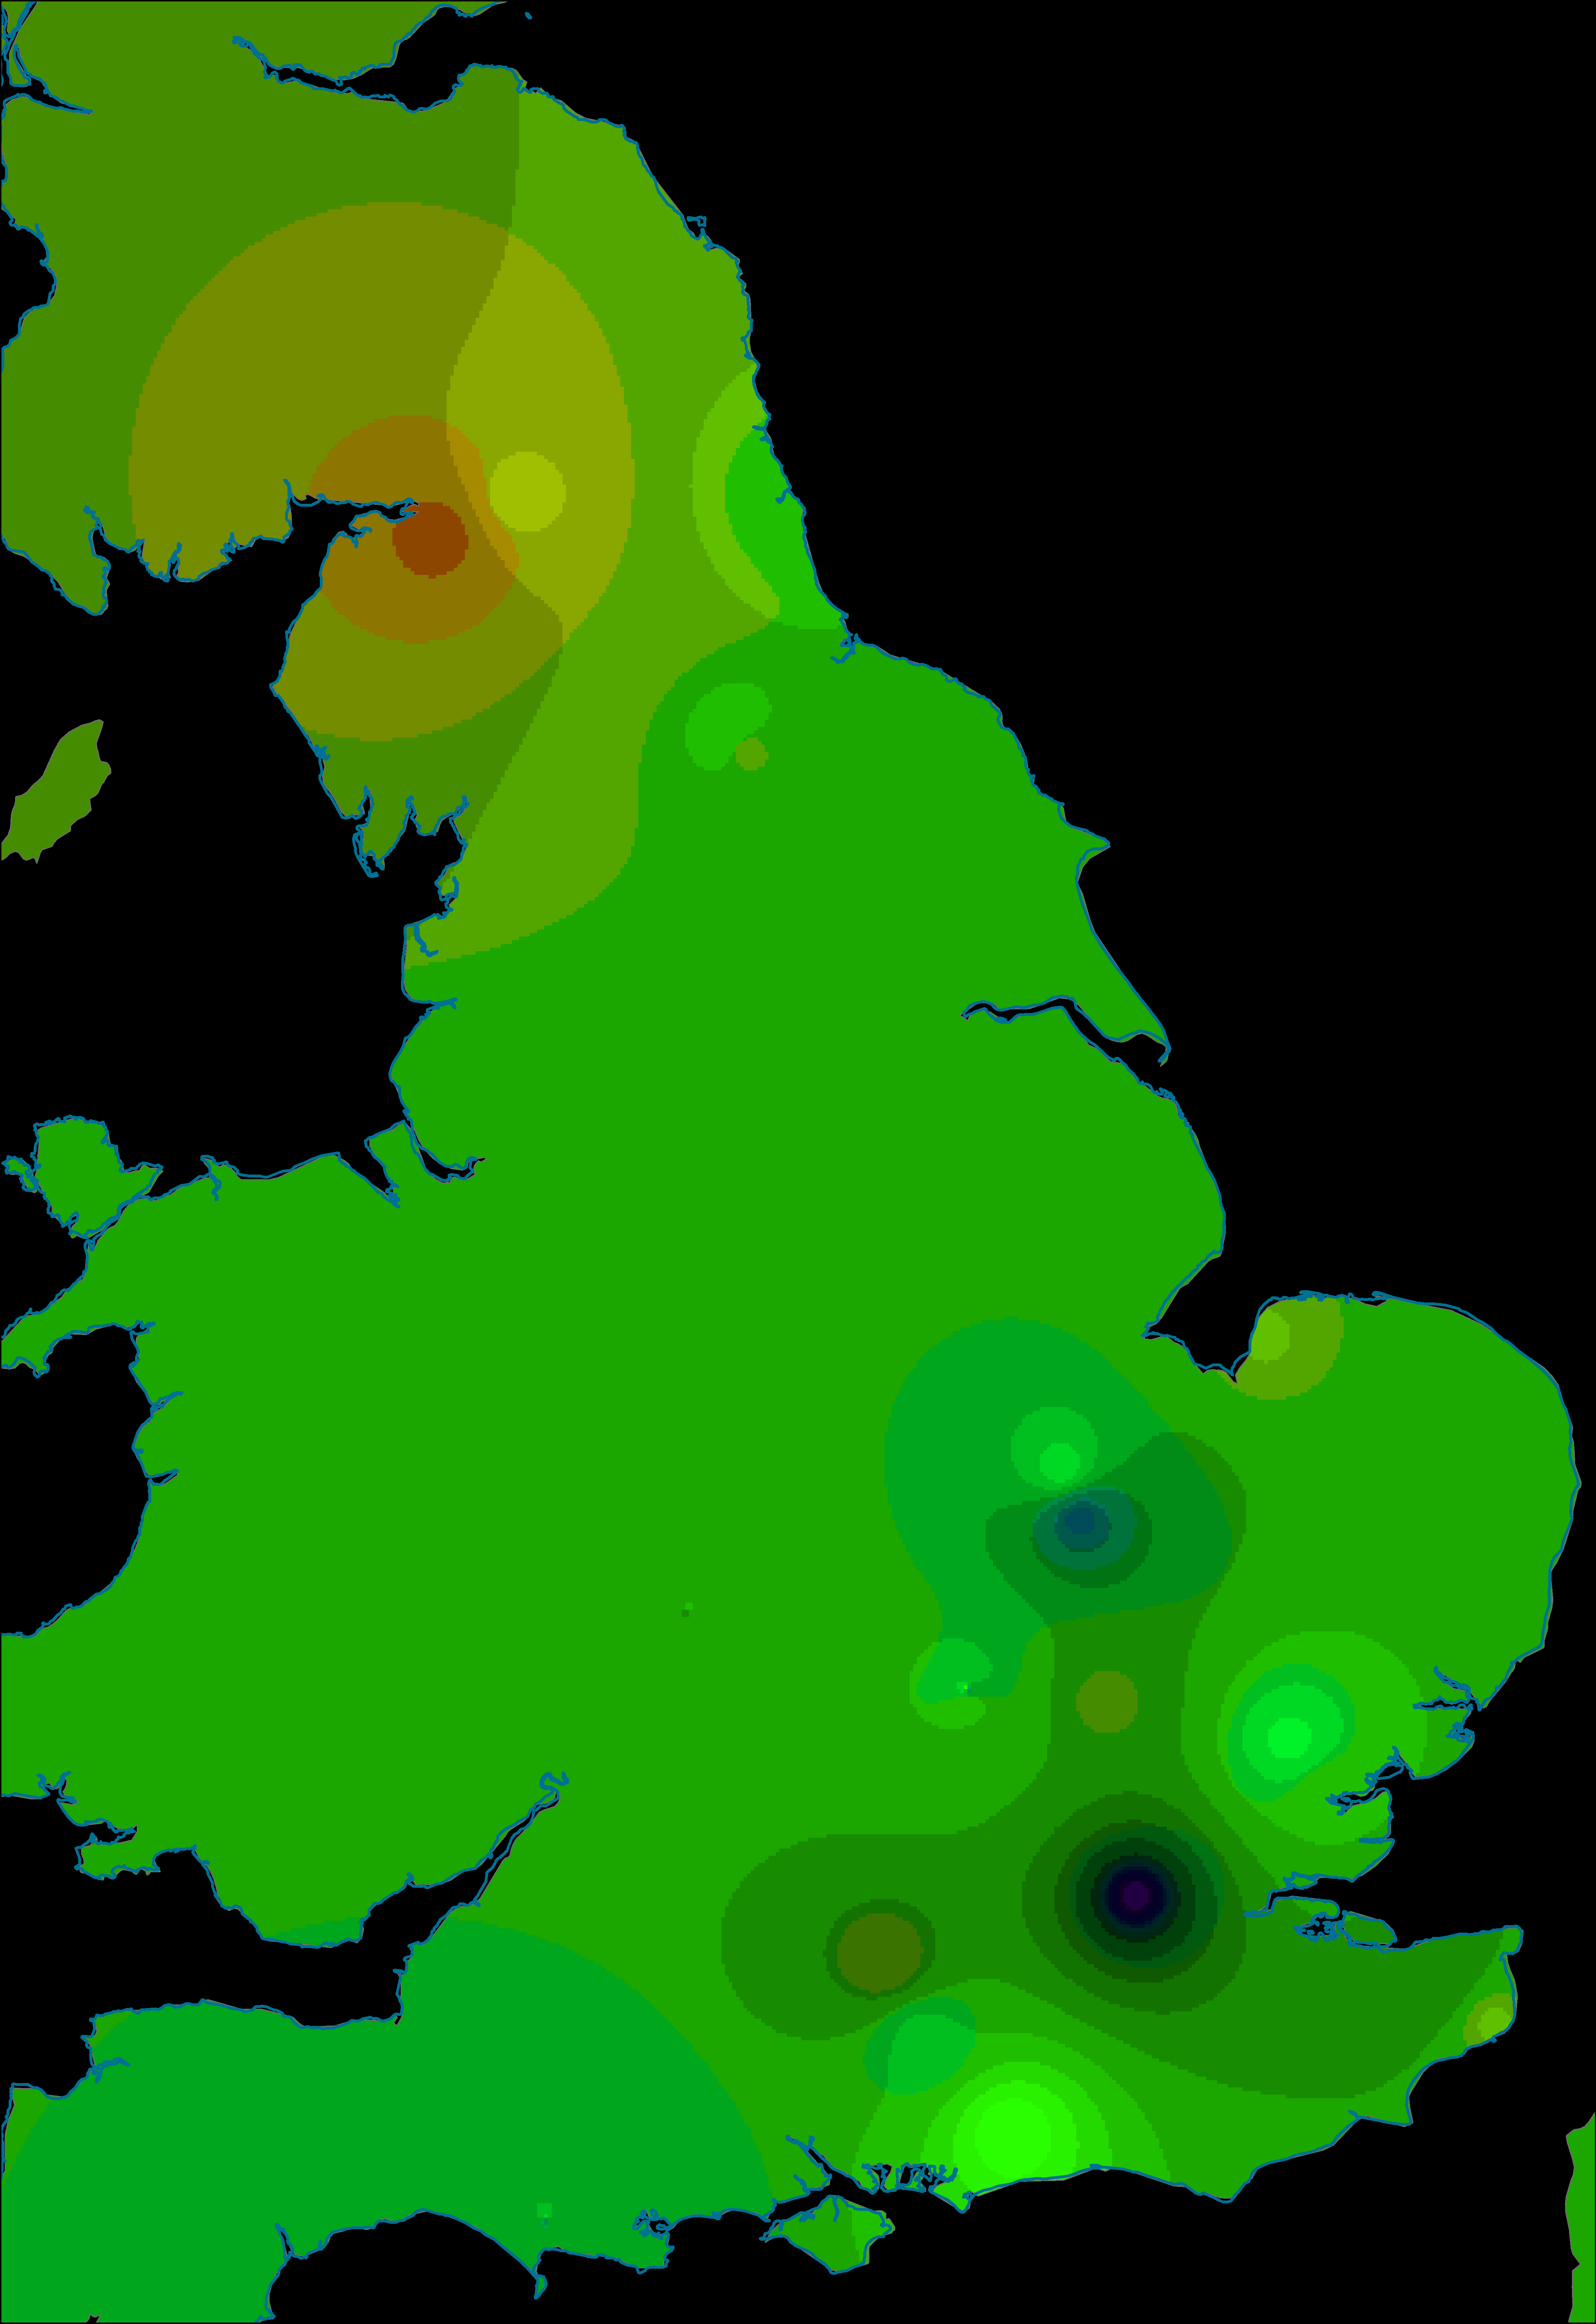
Figure 17 (right): Interpolation and point distribution of CA combined first and second axis scores of Samian dataset, all phases.
Figure 18: CA bi-plot of terra sigillata forms and sites (coloured by type), all phases.
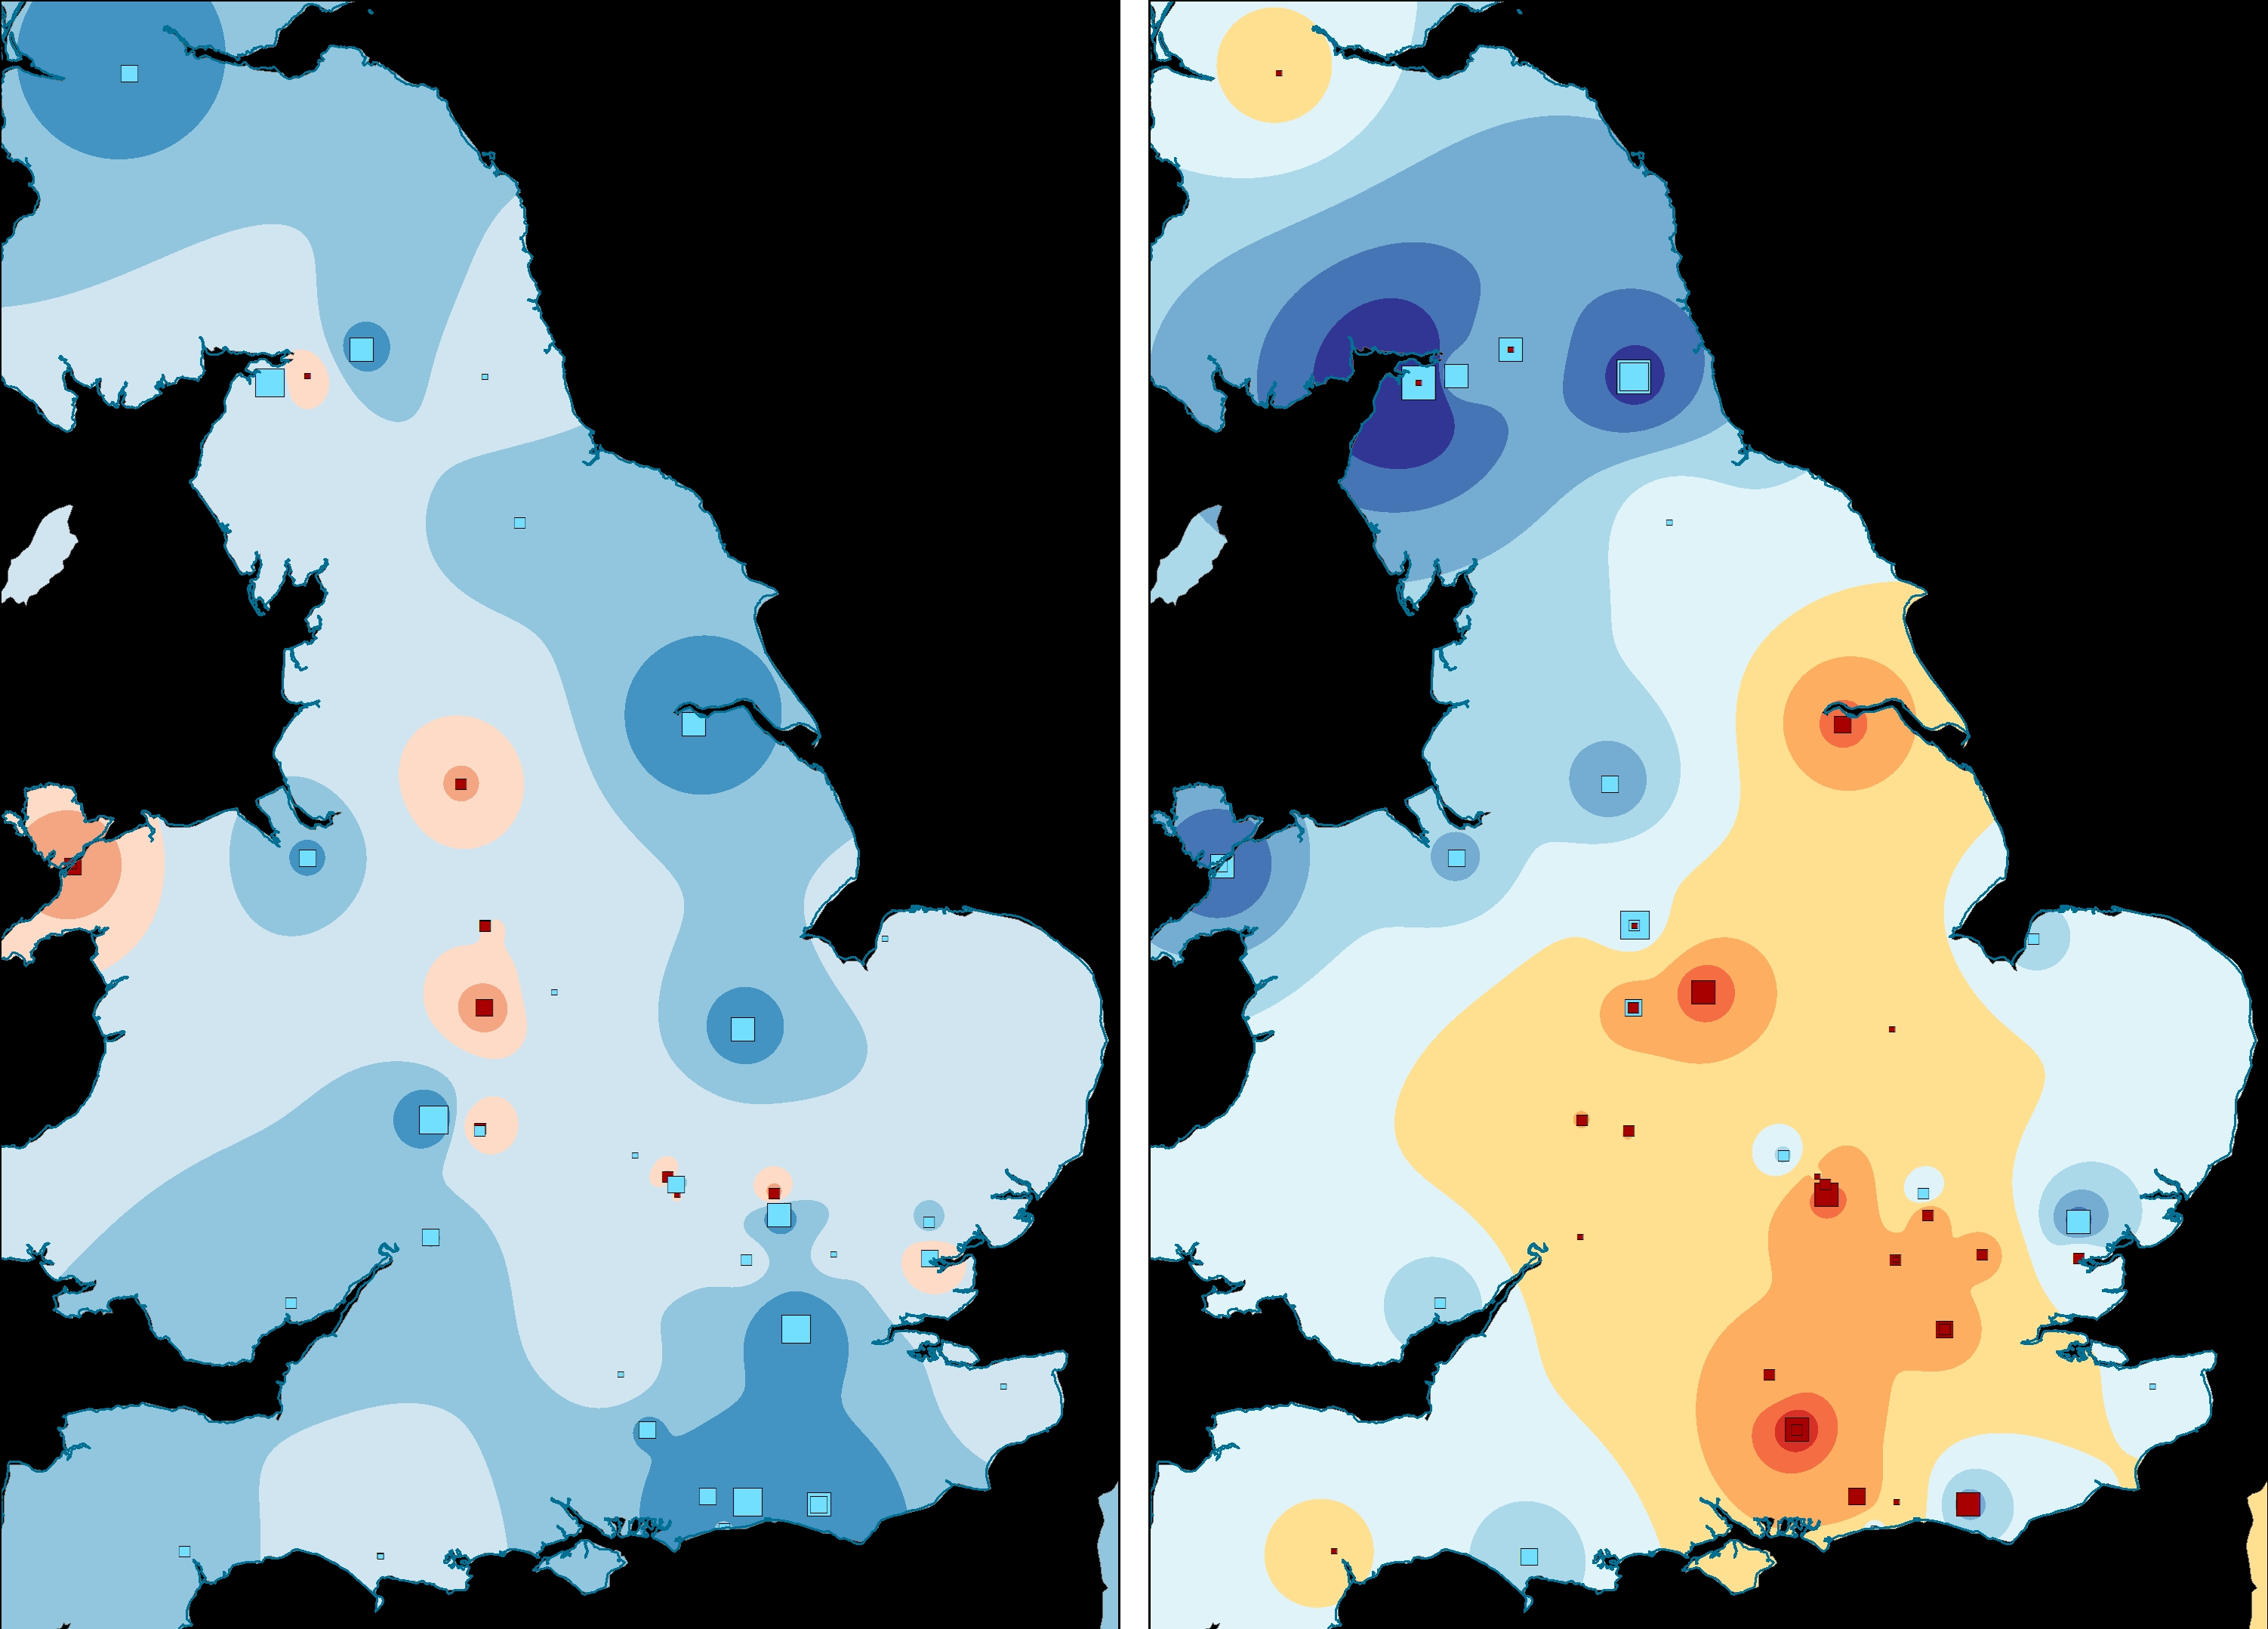
Figure 19 (left): Interpolation and point distribution of Phase 1 CA first axis scores of Samian dataset.
Figure 20 (right): Interpolation and point distribution of Phase 1 CA second axis scores of Samian dataset.
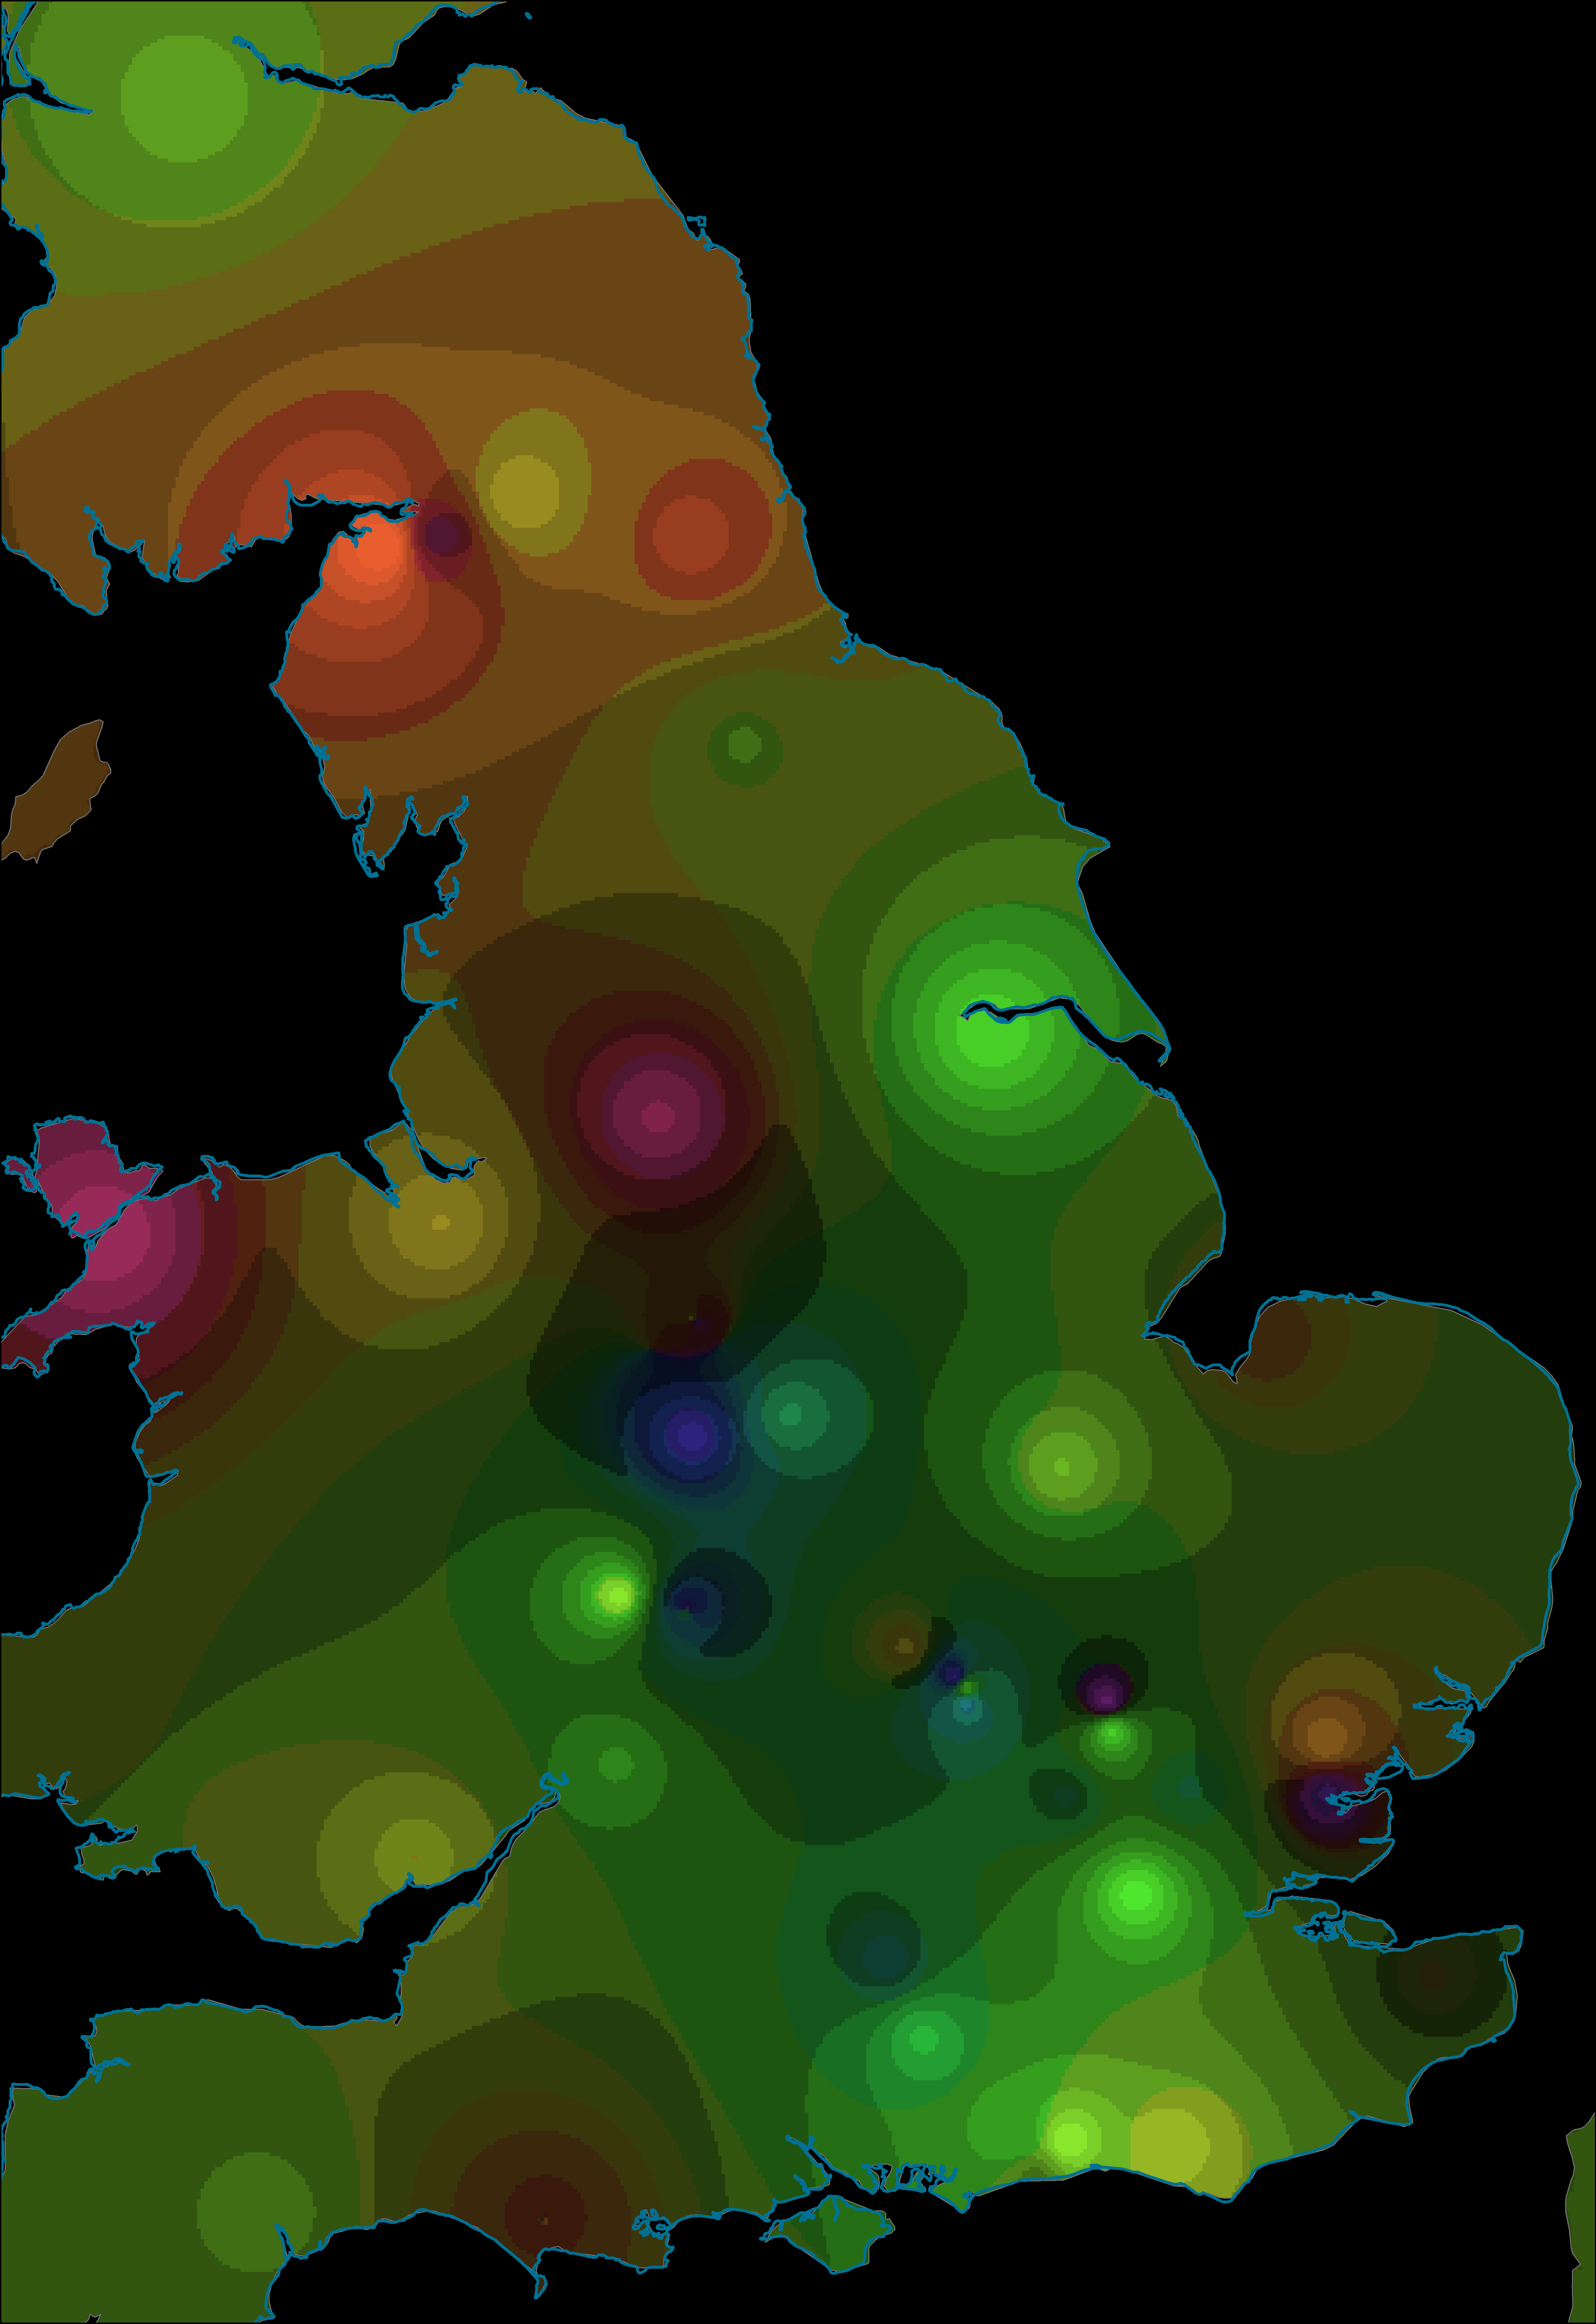
Figure 21: Interpolation and point distribution of Phase 1 CA combined first and second axis scores of Samian dataset.
Figure 22: CA bi-plot of terra sigillata forms with HSV colour wheel. [SVG file]
Figure 23 (left): Interpolation and point distribution of Phase 2 CA first axis scores of Samian dataset.
Figure 24 (right): Interpolation and point distribution of Phase 2 CA second axis scores of Samian dataset.
Figure 25: Interpolation and point distribution of Phase 2 CA combined first and second axis scores of Samian dataset.
Figure 26: CA bi-plot of terra sigillata forms with HSV colour wheel. [SVG file]
Figure 27 (left): Interpolation and point distribution of Phase 3 CA first axis scores of Samian dataset.
Figure 28 (right): Interpolation and point distribution of Phase 3 CA second axis scores of Samian dataset.
Figure 29: Interpolation and point distribution of Phase 3 CA combined first and second axis scores of Samian dataset.
Figure 30: CA bi-plot of terra sigillata forms with HSV colour wheel. [SVG file]
Internet Archaeology is an open access journal based in the Department of Archaeology, University of York. Except where otherwise noted, content from this work may be used under the terms of the Creative Commons Attribution 3.0 (CC BY) Unported licence, which permits unrestricted use, distribution, and reproduction in any medium, provided that attribution to the author(s), the title of the work, the Internet Archaeology journal and the relevant URL/DOI are given.
Terms and Conditions | Legal Statements | Privacy Policy | Cookies Policy | Citing Internet Archaeology
Internet Archaeology content is preserved for the long term with the Archaeology Data Service. Help sustain and support open access publication by donating to our Open Access Archaeology Fund.