It is established that the nature of samian supply did not hold constant but was continually changing over time. Samian specialists have often, and for a long while now, plotted the dates of individual decorated and stamped samian pieces among assemblages, item by item, in order to establish a graph (potentially in the form of a curve) giving a snapshot impression of levels of supply (as indicated by consumption) to a site over the period of samian importation. Decorated sherds and stamps are selected because these are most diagnostic of date; to include plain samian wares in such a graph sounds a correct procedure but since these are less chronologically defined the plotted graphs lose clarity (cf. Willis forthcoming f). Looking at this type of information, from a selection of sites, as Marsh did (Marsh 1981), can give an idea of overall trends in supply, independent of site-specific phenomena. It is now apparent, more than 20 years on from Marsh's study, that his results were reliable in some key respects but not in others. It is now clear that the supply of samian to London was not representative for Britain as a whole. Marsh identified a fairly strong supply of South Gaulish samian to London in the Claudio-Neronian period, and a rise in the frequency of samian in the Flavian period, and then a decline by the end of the 1st century (1981, fig. 11.5) . This is representative of the general frequency of South Gaulish ware in Britain, and reflects a dramatic peak in output at La Graufesenque in the late 1st century. The moderate levels of samian from Les Martres-de-Veyre in London in the early 2nd century, identified by Marsh, are probably inflated by an unusual presence of this ware within his sample. This probably relates to the fact that Roman London was experiencing a vibrant period in its history, and was also a point of entry into Britain of this ware, as attested by the huge amount of Les Martres ware recovered from a burnt-down warehouse at Regis House (Marsh 1981; Rhodes 1986; 1989; Symonds 2000). Other sites in Britain have lower proportions of Les Martres samian, which is explained by the comparatively low output of this source. Lezoux ware in London, by Marsh's data, registers as less frequent than South Gaulish ware, though it is clear that across Britain as a whole the opposite is the case (cf. Section 6.5.1), with a markedly strong flow of samian into Britain in the Antonine period. Using Marsh's sample, East Gaulish samian is present in London from the Hadrianic period but only achieves a low presence, continuing through until the mid 3rd century. This pattern is confirmed at other sites in Britain.
Following from this, it might be expected that strong absolute numbers of samian vessels appearing in Britain in the Flavian and Antonine periods would mean that proportions of samian present in groups of these dates would be noticeably higher than in other periods, of lower samian importation. This is not reflected in Tables 23, 24, 27 and 28, which document the proportions of samian among stratified site groups. This is explained by the fact that during these 'peak periods' of samian inflow the output/consumption of coarse wares was also particularly high. Going (1992a) has characterised this curious trend and has explained it in terms of 'economic long waves'; Greene, independently, discovered the same pattern of peaks in his study of fine wares (1982). Unless there are some hitherto unrecognised structural problems in our dating schemes, it would appear the 'peak-trough' pattern for pottery is indeed a reflection of the reality of the time.

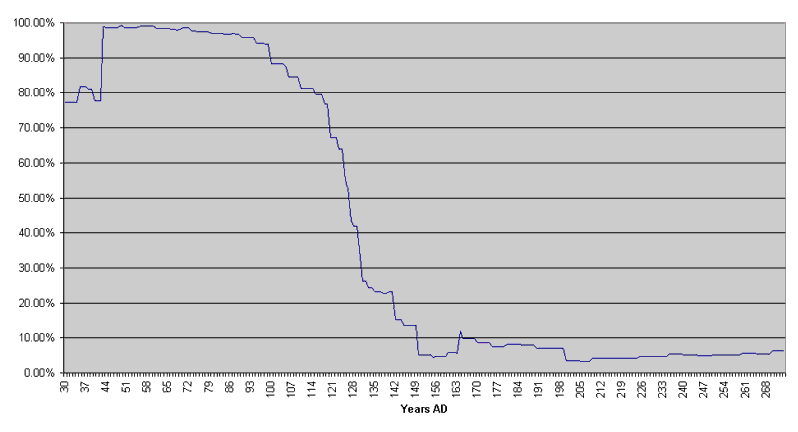
Chart 11: The Relative Frequency of La Graufesenque Samian (as opposed to other sources) amongst the Groups forming the project database.

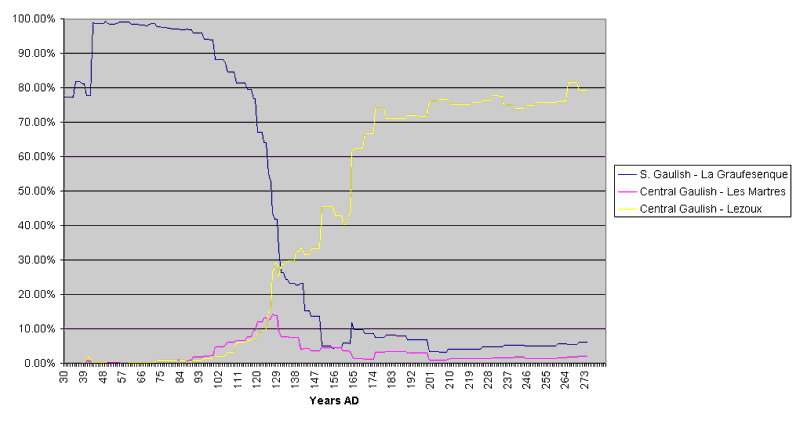
Chart 12: The Relative Frequency of La Graufesenque, Les Martres and Lezoux Samian amongst the Sample of Site Groups forming the Database over time (other sources not shown).
Table 10 shows the relative frequency of samian by source per year within the sample of site groups (Table 10 is available here as a .xl spreadsheet allowing data to be used by the reader). This is a robust guide to the relative importance of the various manufacturing sources of samian in Britain through time. These data are used to plot Charts 11 and 12, showing the relative frequency of La Graufesenque, Les Martres and Lezoux samian among the sample of site groups forming the database. In other words, the charts show the importance of these three centres to the supply of samian to Britain over time. Since the sample is large and drawn from a wide variety of sites, the picture should be a good approximation of the actual pattern. The dominance of La Graufesenque through the 1st century is shown, as is its rapid descent in the Trajanic period. The 'tail' of La Graufesenque samian in the 2nd century relates to the continuation in use of a proportion of vessels to the Antonine period, plus residual items in site groups. Chart 12 shows the presence of Les Martres samian, starting around AD 100 and peaking in groups around AD 125; this pattern thus accords with the established dating of the ware in Britain. Chart 12 also shows the rise in Lezoux samian in Britain from AD 120 (again in agreement with the conventional date). It is the most common ware by c. AD 130. During the Antonine period, Lezoux samian accounts for c. 75% of the samian in site groups. It continues at this level in the 3rd century, though by this time the presence of the ware among site groups will be a result of curated vessels and residual sherds, and a function of the low frequency of East Gaulish samian; by the early decades of the 3rd century the absolute number of samian vessels represented in groups begins to decline, reflecting the overall decline in samian imports.
The supply of Lezoux samian and of East Gaulish ware to Britain are considered below in Section 6.5 and Section 6.7.
© Internet Archaeology
URL: http://intarch.ac.uk/journal/issue17/1/6.2.html
Last updated: Mon Mar 7 2005