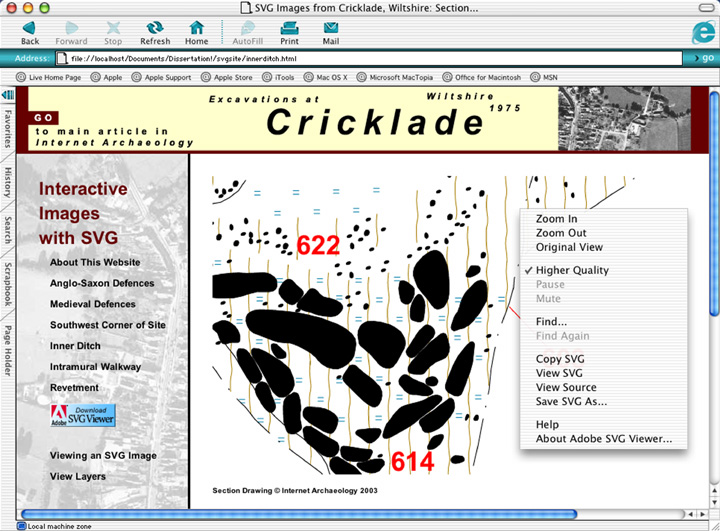
Figure 10: Example of SVG image interaction using Adobe SVG Viewer.
Once the images were placed in XHTML using the embed tag, it was possible to view them and adjust their size and placement. Adobe SVG Viewer has built-in controls for viewing an image using pan and zoom. These controls can either be activated with key commands, or through a pop-up menu brought up with a right-mouse click. For those unfamiliar with SVG, all of the control information is explained in the website under the heading 'Viewing an SVG Image' in the navigation bar. This is one area where Volo View Express excels over the functions of Adobe SVG Viewer. The former allows the user to control the level of zoom incrementally by panning the cursor up and down the image, whereas the latter only allows four preset levels of zoom. This is generally sufficient, but an improvement in this area for subsequent versions of Adobe SVG Viewer would be welcome.
Figure 10: Example of SVG image interaction using Adobe SVG Viewer.
Try panning and zooming with SVG
Further interaction has been introduced by giving control of the layers in the drawings to the user. JavaScript was added to the XHTML to turn the visibility of each layer on or off through an external control panel. While this group of CAD drawings each had a fairly small number of layers, some drawings may have hundreds, and finding a convenient place in the layout of the website for just a few checkboxes was difficult. An external control panel that floats, and can be positioned so that it does not take up valuable space in the browser window was found to be a better solution. This is accessed by clicking on 'View Layers' in the navigation bar of the website, and brings up a different set of layers specific to the relevant drawing.
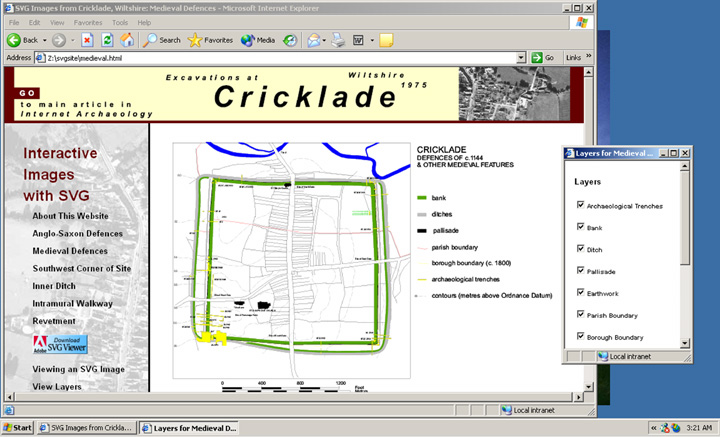
Figure 11: Example of an SVG drawing showing the floating layer control panel on the right.
Try controlling layers with SVG
Layers are controlled by clicking the checkboxes on or off in any order or combination, and can be used when looking at any part of the drawing or at any level of zoom. This method offers far greater flexibility of presentation than Volo View Express. While the layer names used in CAD files may make sense for the creator of the drawings, they may not be understandable to a non-expert viewer, especially if they rely upon a coded system like the CSA Layer Naming Convention (Eiteljorg 2002). In order to change the way layer names appear in Volo View Express it is necessary to return to the original CAD file and rename them. This requires additional time and effort, and changing the names of the corresponding layers in the original file may not be desirable.
With SVG, layer names can be left intact and changed when brought into Illustrator, or later in the code of the SVG file itself. This step is not strictly necessary either, as long as the designer understands what the layers are. The names can remain completely oblique, as long as the text that corresponds to the checkbox in the layer control window is understandable to outside users. The order of the checkboxes can also be changed at any point in the process, without reference to the order of the JavaScript. The order of checkboxes does not need to correspond with the group order (and therefore layer display order) in the SVG file either. The flexibility for organising and presenting layer information is only limited by the functions of XHTML and JavaScript, and allows far greater control than Volo View Express.
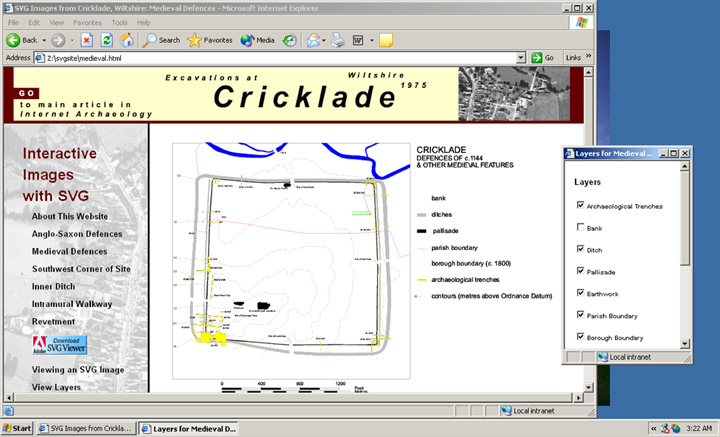
Figure 12: Image of the same drawing from Figure 11, showing the bank and field boundary layers turned off. The layer control functions anywhere on the drawing at any level of zoom.
While SVG opens up control of vector images to those using a much wider variety of web browsers and operating systems, one current drawback is the uneven support for the use of JavaScript with SVG images. Despite various claims, testing of layer control for both the Apple and Microsoft Windows operating systems using Internet Explorer, Netscape and Opera respectively, returned disappointing results. Only Internet Explorer for Windows reliably implemented the layer control, so it was important to make sure the drawings could be understood without this function, and that users were made aware of the problem. As such, this information is stated in the 'Viewing of SVG Images' section of the website to avoid user frustration, and all of the layers are set to load as 'visible'. While this is discouraging from a Web standards point of view, it is no worse than Volo View Express, which will probably never move beyond this proprietary limitation.
Because images created in Illustrator can come from a wide variety of programs and file formats, SVG allows greater aesthetic flexibility, which can help to promote more effective communication. For the Cricklade drawings, Guy Hopkinson created two versions of the detailed plan for the excavation carried out in the south-west area of the site. The original .dwg file from AutoCAD was used to produce the .dwf file for use with Volo View Express. The drawing was meant to convey the differences between the excavated and conjectural information about the site, but because AutoCAD can only render lines and solid fills, the result was not as clear as one might wish.
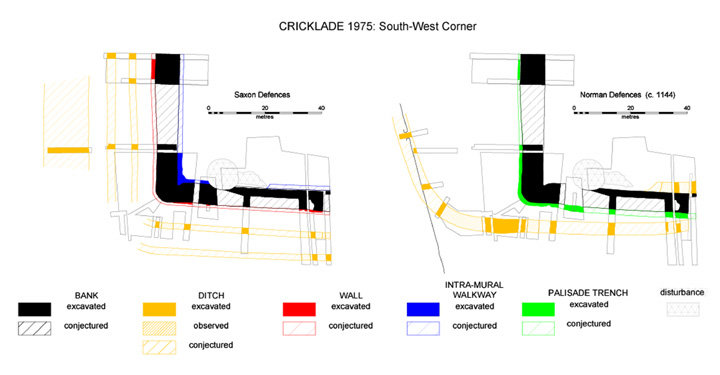
Figure 13: The original .dwg drawing of the south-west corner of the Cricklade site, where most of the excavation was carried out. This image shows the line and solid fills that must be used to differentiate information in AutoCAD.
To remedy this, Hopkinson took the .dwg file and brought it into Illustrator to enhance the drawing and make it easier to understand. The image uses transparency rather than hatching in various colours to show the differences between the excavated and conjectural parts of the drawing. The result is very effective, but because of the limitations of Volo View Express, the image could only be rasterised and used as a static .gif in the final publication of the article for Internet Archaeology.
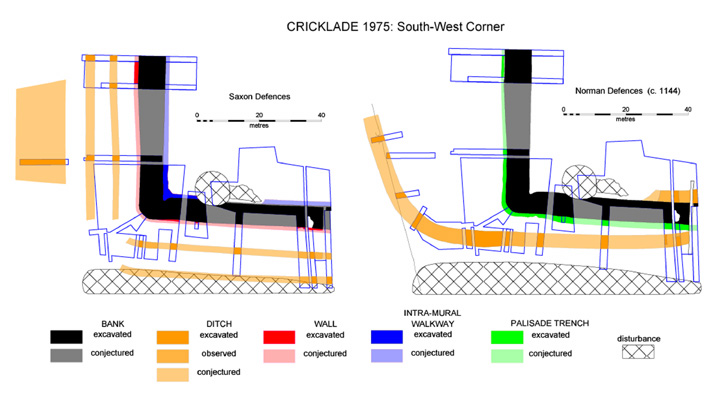
Figure 14: The same drawing from Figure 13, showing the effective use of transparent colour. The image shows the differences between the parts of the drawing that were excavated and the parts that are conjectural.
SVG does not have these limitations, and the Illustrator version of the drawing was used in the Cricklade website. It effectively conveys the usefulness of layer control for vector images in archaeology, and the Illustrator image shows the differences between the excavated, observed and conjectural areas far better than the AutoCAD version.
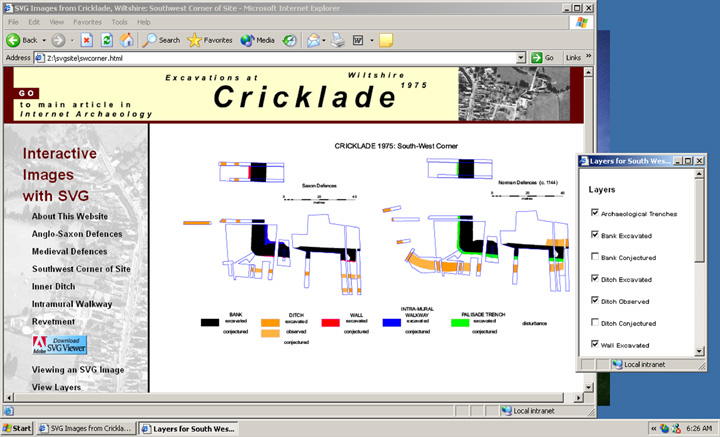
Figure 15: The south-west corner of the site rendered in SVG from the enhanced Illustrator drawing. The image shows only the excavated (and observed) layers, which communicates the actual archaeological evidence found.
Try controlling layers from an Illustrator image with SVG (Open control panel by selecting 'View Layers')
© Internet Archaeology
URL: http://intarch.ac.uk/journal/issue20/1/4.3.3.html
Last updated: Tue Jul 18 2006