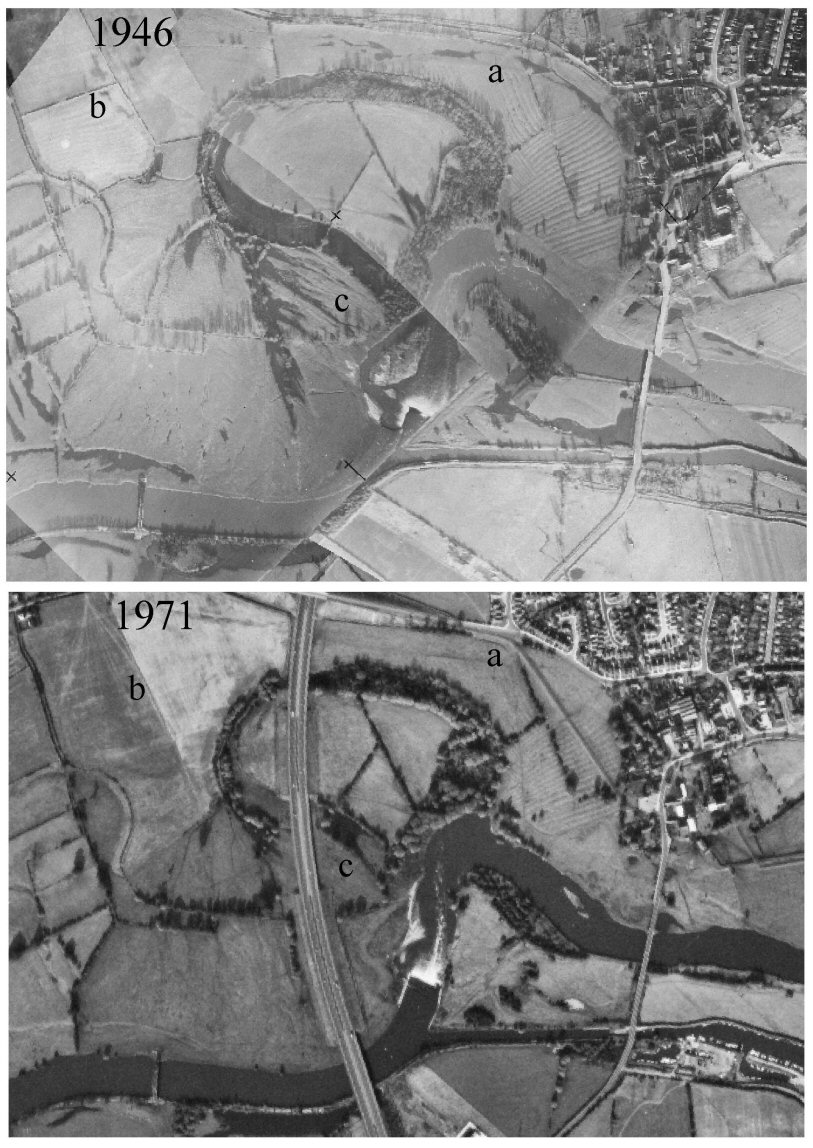
A sample section of the valley (between the Dove and Soar confluences) was chosen to assess the changing nature of the surface-visible record between the two epochs of aerial photographic coverage, and between the most recent photographs and the present. From a total of 406 recorded surface-visible features in this sample area, 54 were visible only on the 1940s photographs. Re-examination of the corresponding 1971 coverage suggested that visibility factors, in particular the unpredictability of cropmark formation, may account for 18 of these features. The remaining 36 features were wholly or partly destroyed between 1940 and 1971, 17 by the improvement or ploughing of floodplain grassland, 11 by gravel extraction and 8 by road building or other development (Figure 11).
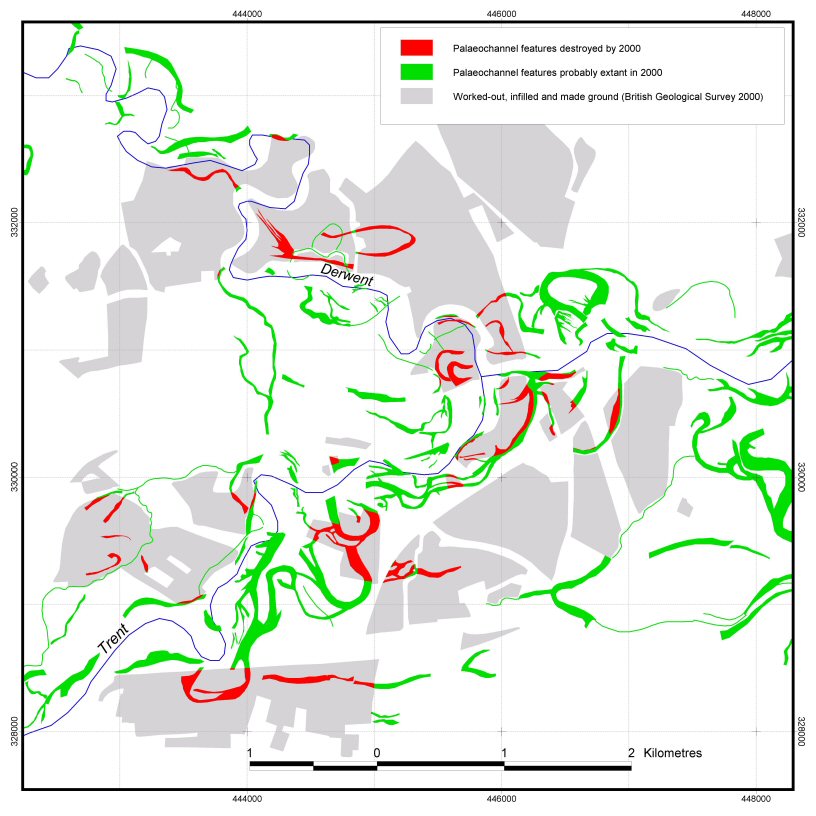
For the same sample area, a British Geological Survey dataset recording the extent of made, worked and infilled ground in 2000, was intersected with the surface-visible palaeochannels database to obtain an estimate of the level of destruction between 1971 and 2000. It should be noted that this dataset does not include agricultural information; hence it was not possible to identify palaeochannels destroyed by agricultural use of the floodplain during this period. Nevertheless, a further 114 palaeochannels were shown to have been completely or partially destroyed between 1971 and 2000. 75% of this loss was due to gravel extraction, with road-building, housing and other development accounting for the remainder.
This level of destruction has major implications for cultural resource management. In particular, the acceleration in destruction over the last thirty years gives significant cause for alarm. In the thirty-year period between 1940 and 1971, 5.8% (by area) of the mapped palaeochannels in the sample area were destroyed. Over the following thirty years (1971–2000) a further 13% (by area) were destroyed, more than doubling the rate of attrition of the resource (Figure 12). The absence of agricultural use from the 2000 dataset suggests that this figure is an underestimate.
Although the current framework allows for archaeological supervision of gravel extraction and other development under watching brief conditions, time and funding constraints often permit only the most basic recording of palaeochannel features. It is vital, therefore, that the palaeoenvironmental resource is handled on a more consistent basis within the archaeological framework of cultural resource management, allowing curators and planning professionals to reach informed decisions based on a realistic assessment of archaeological and environmental potential.