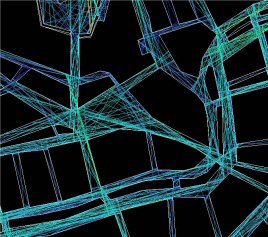
Figure 11: Axial all line map section
The vector drawings created in the previous stage provided the ideal format to proceed with the spatial analysis, since, as Bafna (2003, 18-19) states, 'it is essential in any analytical study of the configured space to re-describe it in an abstracted format focusing on its topology'. However, these vector-drawn maps still focus very much on the insulae and not on the spaces between them, which is why it was important to invert the maps to highlight all of the convex [2] spaces out of which the street grid is built. Since people experience space visually, by means of line-of-sight, space syntax bases its analysis upon the axial map. 'An axial map of the open space structure of the settlement will be the least set of straight lines which passes through each convex space and makes all axial links' (Hillier and Hanson 1984, 91-92).
The creation of convex maps seems a very difficult task for the historic maps since, in most cases, street width cannot be determined with any degree of certainty, due to the lack of sufficient evidence. However, it has become clear that provided there is not too large a discrepancy (e.g. from a single track to a dual carriageway) between the plans and the actual historic street width, the axial line analysis is hardly affected. This is due to the reduction of the all-line map to a fewest-line map, the later one being used in the analysis.
Figure 11: Axial all line map section
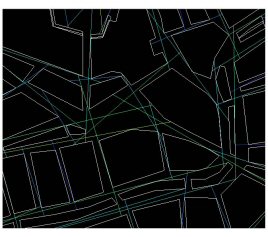
Figure 12: Axial fewest line map section
It is possible to draw an axial map by hand, by 'laying down the longest straight line that passes through at least one permeable threshold between two adjacent convex spaces and repeating this until all the permeable thresholds between all adjacent convex spaces have been crossed' (Bafna 2003, 23). However, this is a time-consuming and rather subjective exercise. In order to make the process of creating axial maps much more objective and faster, it is preferable to use a purposely created computer program. Alisdair Turner from the Space Syntax Laboratory at University College London has included a feature to draw and analyse axial maps in a programme entitled Depthmap, which was originally created to perform Visibility Graph Analysis, the analysis of large buildings, but has quickly been adapted to perform a large variety of other analyses.
The vector maps were imported into Depthmap, which then was able to draw the axial map through the plans' convex spaces. Consecutively, Depthmap analysed this axial map by performing mathematical calculations, in order to calculate which line is the closest to all others. There were two main values used in the analysis of Utrecht. Firstly, one which calculates the accessibility for to-movement, referred to as the integration value. Secondly, a value is calculated for how many cases a line lies on a route between other lines, i.e. the potential for through-movement, referred to as the choice value [3]. Depthmap shades the lines from the highest to the lowest accessibility/potential from red via orange, yellow, green and blue to indigo.
The integration (to-movement) and choice (through-movement) values both reflect a part of the decision-making process of humans before moving anywhere in a system. Firstly a person decides on an origin and a destination for his or her movement. This destination is the to-movement, and destinations which are more accessible are more likely to feature as a destination and as a result are the most integrated, whereas very inaccessible destinations are less likely to feature as such and are therefore the least integrated. Secondly, before a person can start moving, he/she needs to select the streets (lines) that must be passed through to go from origin to destination, the route or in other words the through-movement. The line which is on the largest number of shortest routes between origin and destination has the highest choice value, whereas the line which is on the least or none of the shortest routes between origin and destination has the lowest choice value. Like the choice of destination, the choice of route to that destination is highly dependable upon the network. The ratio of through-movement lines to origin/destination lines will become higher when the length of trip increases and therefore in those cases the choice value will be more accurately reflected (Hillier and Iida 2005). This feature can be seen in the choice maps of Utrecht since it shows the main routes through the city i.e. the longer trips rather than local movement patterns.
It was essential to calculate both the global and the local integration and choice patterns. Global values correlate strongly with primary routes through an urban system, whereas local values correlate strongly with secondary streets. Therefore, the latter value is very useful in calculating the way in which local people use the space (to go to the local shops, school, or friends), whereas the former value calculates the way in which non-locals use the urban space (to travel through a town, or take the most logical straight route to their destination). In order to differentiate between local and global values, for the global value the ratio needs to be set to 'n' or infinite and therefore allows the Depthmap program to calculate the integration and choice values from one line to all others in the system. For the local value the ratio needs to be set to 3 and therefore only calculates the integration and choice values from one line to all others in the system, which are less than or equal to three steps away (Penn 2003, 39).
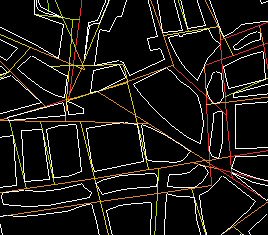
Figure 13: ASA map section
Since spatial analysis is constantly evolving, within the last couple of years it has been discovered that the analysis of segments corresponds more precisely to movement patterns than the analysis of whole lines. Therefore, between the creation of the axial map and its analysis, Depthmap can create a segment map of the axial map, which can then be analysed in a similar manner, but the calculations will then find the segment with the highest accessibility for to-movement and the segment with the highest potential for through-movement [4]. By way of explanation of the integration and choice values, the word 'line' can be substituted for 'segment' in the previous paragraph to achieve an explanation of what these terms mean in segment analysis. The colour shading has the same values for the axial as for the segment maps.
Connections between segments can be weighed for metric distance, complexity distance and angle of change. The latter especially is a useful value, since it will still take into account long streets, which are straight or nearly straight, and will still receive the high integration value which most of the longest axial lines receive. Therefore, the least angle value correlates best with real movement (segment analysis is therefore also referred to as ASA - angular segment analysis). This is because people move across town in the most logical way possible, which might not necessarily be the shortest, a way which might have a large number of turns. People read the urban network in geometrical and topological rather than metric terms. Even though people always try to take the shortest routes to their destination, their concept of distance is shaped more by the geometric and topological properties of the network than by the ability to calculate metric distances (Hillier and Iida 2005, 15). This discovery has profound implications since it proves, as space syntax has always argued, that:
'the geometric and topological architecture of the large scale urban grid is the most powerful shaper in urban movement. Secondly that axial graphs are in most circumstances a good approximation of the impact of spatial configuration on movement and thirdly that the architecture of the street network in geometrical and topological sense through its effect on movement flows influences the evolution of land use patterns and consequently the whole pattern of life in the city' (Hillier and Iida 2005, 15)'
It should also be noted that Space Syntax analyses the way in which pedestrians use urban spaces. The analysis can therefore take into account small alleys, which are too narrow for a horse and cart, as well as very wide streets, steps and other obstructions. Since the segment analysis is very much in its infancy, both the axial line analysis and the segment analysis was performed and used in the analysis of Utrecht, and the results interpreted accordingly. For all of the maps the local and global integration and choice values were calculated.
© Internet Archaeology / Author
URL: http://intarch.ac.uk/journal/issue21/5/2_2.html
Last updated: Wed Aug 8 2007