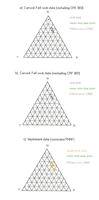
Figure 6: Sr-Y-Zr ternary plots of corrected implement data and Carrock Fell rock data (TERNPLOT - Marshall 1996)
The following method was used to investigate statistically (at the 95% confidence level) if any of the collection of 17 stone implements (sampled by PXRF analysis) was geochemically similar to the Carrock Fell Gabbro signature (established by ICP analysis). The two datasets (implement and Carrock Fell Gabbro) were investigated, using the 'NSCORE' function, to establish if they were normally distributed. The statistical 'NSCORE' value was computed for each element analysed and plotted against the true concentration, in ppm. All datasets were approximately normally distributed, exhibiting a near linear profile. The plots showed evidence of complex distributions which were marked by 'steps' in the graph profiles (Davis 1999). This indicates that although the whole sample is approximately normally distributed, it was made up of two or more separate 'sub' distributions that show slightly different statistical parameters.
Complex distributions mark primary variations in the composition of the specimens (implement or rock). This variation should be reflected in the mineralogy of the specimen. For example, if Ca is considered as an indicator of the amount of plagioclase, then the specimen in one 'sub' distribution should show a different amount of plagioclase to specimens in a different 'sub' distribution. Ti can also be used as an indicator of the amount of Fe oxide grains present (titanomagnetite and ilmenite).
Bivariant and ternary plots of implement data and Carrock Fell rock data graphically illustrate clustering of individual implements with Carrock Fell rock data. Fe was selected as the constant x variable discriminant against which all other elements were plotted, because it was considered to be experimentally accurate (with no known significant margin of error) and shows a large range. The plots included published geochemical data (O'Brien et al. 1985) for comparison to show the range and to highlight any significant errors in the experimental datasets. The plots showed that generally the majority of the implements plot within the range exhibited by the Carrock Fell rock dataset (Davis 1999, 50-57). Using Fe as the discriminant, there were ten implements that formed outliers in one or more plots. Sr-Y-Zr ternary diagrams (TERNPLOT) (Marshall 1996) were used to investigate clustering further (Fig. 6). These elements were selected because they are reliable discriminators for PXRF data (Williams-Thorpe et al. 1999a). The ternary plots show good clustering of the Carrock Fell rock and implement data.
Figure 6: Sr-Y-Zr ternary plots of corrected implement data and Carrock Fell rock data (TERNPLOT - Marshall 1996)
The mean, variance and standard deviation (SD) of the Carrock Fell rock data sample were calculated. The sample variance and SD were calculated using the VAR and STDEV functions in Microsoft Excel 97. The sample parameters, mean and SD were used as a statistical estimate of the true population parameters, mean and SD of the Carrock Fell Gabbro (Till 1974).
By definition and selection criteria, all of the implements analysed were gabbroic and were therefore likely to show a similar geochemical signature (for majors) because the classification was based on mineral assemblage, which was a direct indicator of chemical composition. Therefore, a very sensitive test was required to discriminate more rigorously between implements that consistently showed the same geochemical signature as the Carrock Fell Gabbro. This was achieved by testing each implement separately for the proportion of elements that plot within a specified range determined by the statistical parameters of the Carrock Fell Gabbro sample. The implement data was tested at two levels: at the range of the mean (Carrock Fell Gabbro) value ± 1 SD (Carrock Fell Gabbro data); and at the range of the mean (Carrock Fell Gabbro) value ± 2 SD (Carrock Fell Gabbro data). The arbitrary scoring system awards a score of 2 to implements that plot within the range of the mean ± 1 SD, and a score of 1 to implements that plot within a range of Carrock Fell rock specimen data. No scoring system was required at the 2 SD level as the mean ± 2 SD is greater than the range of the data. The arbitrary scores established from the tests were grouped into four divisions to illustrate which implements were most likely to be geochemically similar to the Carrock Fell Gabbro, and of primary interest to the investigation. Nine implements showed an arbitrary score of >50%, and were therefore likely to show Carrock Fell Gabbro provenance. The data for these nine implements were grouped and statistically tested to identify if the distribution of the sample was statistically similar to the distribution of the Carrock Fell Gabbro sample.
The new implement dataset was investigated using the 'NSCORE' function, and found to be approximately normally distributed with further evidence of some complex distributions. Statistical comparisons of the implement data set with the Carrock Fell Gabbro signature were done using three parametric hypothesis tests. Parametric tests were selected because both datasets investigated showed approximate normal distributions.
Overall, the hypothesis testing illustrates an important methodological point: Ti, Zr, Sr and Y were found to be statistically unequal to the Carrock Fell data (in either the mean or variance). From the analysis of graphical plots, Mn, Ti and Y were identified as showing inconsistency in the implement data. Therefore, this may further suggest that there is sampling bias or experimental error in these element datasets. However, it was not possible to conclude whether or not the null hypotheses for these elements should be rejected as a result of true elemental differences in the rocks sampled, experimental error and/or sampling bias, or statistical type I error – where a true result is wrongly statistically rejected (Till 1974). In conclusion, hypothesis testing at the 95% confidence level indicated that the sample of nine implements was overall statistically similar to the Carrock Fell Gabbro.
© Internet Archaeology/Author(s) URL: http://intarch.ac.uk/journal/issue26/9/7.html
Last updated: Wed Jun 10 2009