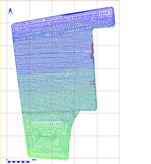
Figure 6: TIN model showing the results of the Delauney Tessellation with the trenches marked in red. The triangles are coloured to reflect the elevation change from the lowest in blue in the north to the highest in green at the south.
Like so many fields in the sandy areas on the southern margins of the Vale of Pickering, the featureless flat surface of Site 28 gives no indication of the extensive archaeological deposits that lie beneath. Three topographic surveys were undertaken using the GPS; the main field with its crop of turf was surveyed on foot, collecting points at roughly five metre intervals, the extension to the north, and the field to the south (Site HPP034) were surveyed using the GPS mounted on a vehicle. The combined three surveys generated a 3-D point data set of over 7,200 points, which were then triangulated using a Delauney Tessellation algorithm using G-Sys (the on-site Geographic Data Management System developed by Dominic Powlesland to integrate and manage the Heslerton data). This generated a set of triangular planes, or TIN model, linking all the points and from which contours can be calculated at any interval and a digital elevation model or DEM can be generated (Fig. 6).
We are grateful to Tom Cromwell of the English Heritage Centre for Field Archaeology who provided and operated both a high-precision Trimble GPS and a Leica robotic/reflectorless Total Station for experimentation during the project.
Figure 6: TIN model showing the results of the Delauney Tessellation with the trenches marked in red. The triangles are coloured to reflect the elevation change from the lowest in blue in the north to the highest in green at the south.
The two areas surveyed by vehicle, at the top and bottom of the area showing in Figure 6, are obvious on account of the less regular distribution of the collected data. The northern area was covered in less than 20 minutes and the southern in less than an hour. The turf field had to be surveyed on foot, as we were not permitted access to this area by vehicle; this produced a large and regular dataset that took several days to collect but is probably more precise. The resulting contour survey is shown in Figure 7.
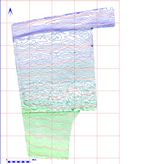
Figure 7: Contour survey covering Sites HPP028 and HPP034. Contours at 10cm intervals with metre contours in red from 27m in the north to 40m in the south.
The combined contour surveys reflect the differences in the method of data collection. The areas where points were gathered by vehicle generate a smoother contour model, possibly because the larger collecting platform ironed out minor surface variations, but these areas are also less susceptible to variation associated with the changing attitude of the GPS antennae in response to changes in position while walking. Along the western boundary of the survey, the presence of an enhanced field bank resulting from the build up of blown sands trapped in the hedge boundary, is demonstrated by the way the contours kink to the north between 10 and 20 metres from the boundary. This effect is less clear in Site HPP034 to the south and in the northern extension to HPP028. A clear ridge can be seen where an old field boundary, following the major Roman flood defences, has been removed at the northern edge of activity (Fig. 8).
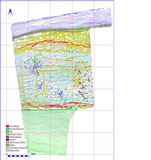
Figure 8. Contour survey overlain by a classified geophysical survey plot.
The gradient is at its lowest between the 27 and 28 metre contours where much of the activity that makes up the ladder settlement is located. Two very slight valleys can be seen in the contour survey, one parallel to the western boundary about fifty metres wide and about twenty centimetres deep, and a second broader depression running down the centre of the field. These could be much larger features that are filled with blown sand; the slight ridge between the two depressions appears to have been selected for the placement of the identified round barrow and possible associated cemetery. The group of Grubenhäuser near the eastern boundary are distributed across a broad flat area that extends to the south as a very slight depression. The moderating effect of the blown sands that are characteristic of the landscape in this part of Heslerton are such that the very shallow topographic features visible in surveys of this type can indicate much larger buried features. Extensive sub-surface modelling of the blown sands elsewhere in Heslerton have admirably demonstrated the benefit of auger surveys in this environment (Powlesland et al. 2006) and it is recommended that an auger survey be undertaken on Site 28 to establish a sub-surface model in the future.
© Internet Archaeology/Author(s)
URL: http://intarch.ac.uk/journal/issue27/2/3.2.html
Last updated: Wed Nov 11 2009