It is often useful to display different datasets — or different aspects of the same dataset — alongside each other for comparison. The following steps show you how to do this.
Switch to layout view using the view menu.
Go to the insert menu and click 'data frame'.
A new data frame will appear on top of the existing template. Drag this to the top of the page.
Right-click the new data frame in the list pane and choose 'add data'.
Find the shapefile 'cattle elements.shp' and click OK.
The elements layer will now be duplicated in the new pane. If you wish, you can add the details, outline, and background layers too.
Repeat the process from Step 1 to link the sample dataset to the new version of the elements layer. Note that it is quite possible for a single external file to be linked to multiple layers simultaneously.
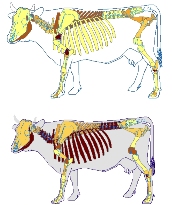
Figure 2: Comparing results using two data frames.
There were two main feature types at Gomolava: pits and the 'cultural layer'. The linked table also contains butchery data for each of these context types, and the following instructions will show you how to compare the two.
Double-click the elements layer in the original data frame, and choose the symbology tab.
Change the 'value' field to 'layer_pc', and change the category boundaries as appropriate. Click OK, and you should now see the cut-mark frequencies for bones from the cultural layer only.
Bring up the symbology options for the new elements layer, and select 'pit_pc'. Change the category boundaries to match those in the first original elements layer. Click OK.
You should now be able to compare the anatomical butchery patterns between the two context types (Fig. 2).