Were these whelks all harvested from the same type of sea-bed, and (if so), what type? It is sometimes possible to use shapes of shells to assign them approximately to the place in the sea where they lived. An organism's shape varies with size (Gould 1966, 588). The stresses and strains on its body from physical forces in the environment vary with size because its weight, volume and surface area all alter with growth; therefore its body and its parts must alter in shape as the organism grows, to compensate for these changes in physical forces (McMahon 1975). Variation of shape with size in living things is termed allometry (Huxley 1932, 2), and its study has a considerable history (Gayon 2000). Marine molluscs, living an aquatic life, are inevitably subjected to fluid dynamics effects, which vary with size in complex ways (Vogel 1994, 87). Therefore marine molluscs usually grew allometrically, changing shape with size (Seed 1980), both in the present (Gaspar et al. 2002) and the past (Reitz et al. 1987). Since the typical pattern of environmental forces varies between habitats, the manner in which shape varies with size also tends to vary between habitats, even within a particular species of shell (e.g. Baxter 1983). If the manner in which shape varies with size is consistent within a sample of shells, they are likely to have all come from the same habitat.
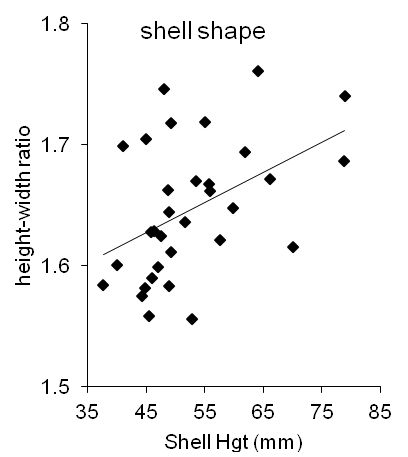
The whelks from midden 7325 clearly exhibited allometric growth. The proportion of shell height to width (H/W) is sometimes employed to compare shapes between whelk populations (e.g. Thomas and Himmelman 1988, 227), but this ratio was not constant among the Carisbrooke whelks: it increased with size (Figure 6). When the relationship of the ratio H/W with shell height is fitted by the standard regression technique (ordinary-least-squares regression: Sokal and Rohlf 1995, 451), that relationship (the 'slope' of the line in Figure 6) was statistically very significantly greater than zero (slope: 0.0025 ± 0.0009; one-sample t-test: t [30]: 2.78; P(no relationship): 0.0093).
Usually, the relationship between any two dimensions (x, y) of an organism is exponential (y = A x b), the 'simple allometry' of Huxley (1932, 4-6). Relationships between dimensions are said to show 'isometry' if the exponent (b) is exactly one, and the ratio of two dimensions remains constant; the relationship is 'positively allometric' if (b) is more than one (y is growing faster than x), and 'negatively allometric' if (b) is less than one (Gould 1966, 594). If the relationship is not isometric, and proportions vary with size, graphs of the two dimensions are curved. Fitting linear relationships using linear regression techniques to allometric relationships can appear to produce good results (they can have values of Pearson's correlation statistic, R, quite near to one) but tend to over- or under-estimate in a systematic but complex way, and to produce results that are biologically nonsensical. For these whelks, using the standard linear regression technique (ordinary least-squares linear regression) on the relationship of width with height produced a formula that initially appeared to be a good model (R: 0.986):
W (mm) = (2.92 ± 0.93) + (0.551 ± 0.017) × (H)
However, this linear model demands these whelks have a width before they exist: for a shell height of zero, the formula calculates shell width is typically 2.92mm, and insists, for a shell height of zero, a shell width of zero is extremely improbable (one-sample t-test: t[30]: 3.14; P(W=0): 0.0038). Applying linear regression to whelk dimensions has produced similar bizarre results previously, indicating the relationships between dimensions were allometric (Thomas and Himmelman 1988, 227).
The exponential relationship between dimensions in 'simple' allometry becomes linear if the dimensions are transformed to their logarithms (log y = log A + b log x) (Huxley 1932, 4-6). Linear regression techniques (e.g. Sokal and Rohlf 1995, 451-83) can then be used to 'fit' a straight line to the data. The slope of the fitted straight line is the allometric exponent (b). The deviations of the points from the fitted line are used to estimate the standard deviation of the slope (b), its standard error (Sokal and Rohlf 1995, 468). Whether the relationship is isometric can then be determined by using a one-sample t-test (Sokal and Rohlf 1995, 227) to find the probability that (b) is exactly one, using its standard error.
The most common linear regression technique, ordinary least-squares (o.l.s.), is designed for prediction; it does not fit a line as closely as possible to the data (Sokal and Rohlf 1995, 453), which requires techniques called Model II regressions in biometry (Sokal and Rohlf 1995, 457; see Warton et al. 2006 for a review). The most commonly used Model II technique is reduced major-axis (r.m.a.) (Hammer and Harper 2006, 54), because it has few built-in assumptions about distributions and uncertainties (Sokal and Rohlf 1995, 544). Therefore linear regression with r.m.a. fitting was used to determine whelk shell allometry (by fitting a straight line to the relationship between the base-10 logarithms of the shell dimensions, log10(H) and log10(W)), and aperture allometry (using log10(Hap) and log10(Wap)).
The allometric relationship of shell width with height was estimated as
log10(W) = (-0.093 ± 0.051) + (0.928 ± 0.031) × log10(H)
This can be converted to give the estimate of the relationship in the original dimensions (mm):
W = (0.807 ± 0.095) × H (0.928 ± 0.031)
The relationship was negatively allometric: the exponent (0.928 ± 0.031) was significantly less than one (one-sample t-test: t[30]: 2.32; P(b=1): 0.027). Shell width tended to increase more slowly than height; the whelks tended to become relatively narrower as they grew.
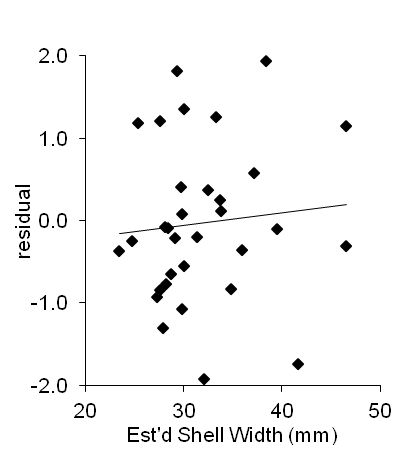
All the whelks were well represented by this one allometric relationship. The impression given by the value for R (0.984) being very near one can be tested further by examining the residuals (the regression-estimated value of a dimension minus its true value) for each individual in a sample (Draper and Smith 1981, 145-50). The residuals for width-height relationship in the original dimensions had a mean (-0.03 ± 0.97) that was clearly not significantly different from zero (one-sample t-test: t[31]: 0.031; P(mean=0): 0.97). Their distribution was not significantly different from normal (χ²[31]: 1.75; P(normal): 0.19), and their relationship with predicted width showed no clusters or trend with size (Figure 7).
The allometric relationship of aperture width and height was found to be
log10(Wap) = (-0.308 ± 0.073) + (1.001 ± 0.050) × log10(Hap)
or
Wap (in mm.) = (0.492 ± 0.083) × Hap (1.001 ± 0.050)
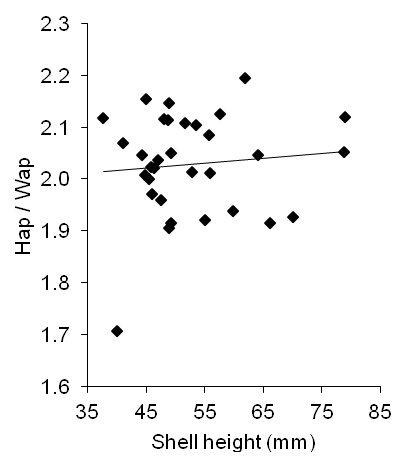
The aperture height-width allometry was isometric (the exponent was indistinguishable from one). The consistent aperture shape was confirmed by the ratio Hap/Wap, which averaged 2.03 ± 0.10. Unlike the shell height-width ratio (Figure 6), Hap/Wap was similar regardless of shell size (Figure 8): when the relationship of Hap/Wap with shell height was fitted using o.l.s. linear regression, that relationship (the 'slope' of the line in Figure 8) was clearly not significantly different from zero (slope: 0.00095 ± 0.0018; one-sample t-test: t[30]: 0.53; P(no relationship): 0.60). The Hap/Wap ratio seemed somewhat high compared with other whelks (e.g. Magnúsdóttir 2010, 18), indicating narrow apertures, perhaps to thwart being eaten by crabs (Thomas and Himmelman 1988).
The shell morphology of the whelks demonstrated they are likely to have all been harvested from the same type of sea-bed. A single allometric relationship for both shell shape with size, and aperture shape with size, was a good characterisation of the shape and size of the individual whelks. Both allometric relationships were well characterised by the straight line, both values of R were close to one, and there were no scatters or clusters in the residuals. Whelk shape is very variable, even within a single large bay (e.g. Magnúsdóttir 2010, 25-26), so the consistent relationships show all these whelks were harvested from a very similar habitat. Since these whelks likely came from the same sea-bed, they were probably all harvested at the same time. It remains safest to assume they were harvested and discarded during the reworking of the midden as an early modern garden soil, rather than when it accumulated during the medieval period.
The allometric relationships showed the shells tended to become narrower with increasing size, but the aperture (through which the foot that attaches the whelk to the surface protrudes) kept a constant shape and grew in direct proportion with shell size. Keeping a foot in proportion with size as it increased suggests a need to remain attached, while making the shell narrower with size suggests a need for streamlining, so these whelks probably lived in fast or turbulent tidal flows, such as those known in the deeper parts of the channel north of Wight (Velegrakis 2000, 33).