Out of 12,693 bones from mammals, birds and amphibians, 3847 bones have been identified. Altogether these bones are derived from 26 species of wild mammals (Table 1) and three species of domestic animals. A total of 1432 bones have been recovered from marine mammals, comprising 37% (NISP) and 26% (MNI) of all identified mammal bones. Marine mammals are represented by cetaceans: harbour porpoise (Phocoena phocoena) and dolphin (Delphinus delphis), and three species of pinnipeds: harp seal (Pagophilus groenlandicus), grey seal (Halichoerus grypus) and ringed seal (Pusa hispida).
Marine fish dominate the assemblage, with species like cod (Cadidae sp.), flatfish (Pleuronectidae sp.), garfish (Belone belone), herring (Clupea harengus) and mackerel (Scomber scombrus) (Schmölcke et al. 2007). Some migratory fish were also present, including eel (Anguilla anguilla) and salmon species (Schmölcke et al. 2007). Freshwater fish are represented by perch (Perca fluviatilis), zander (Sander lucioperca) and cyprinids (Cyprinidae). From all species recovered, marine species predominate, with cod at 69%, while freshwater fish contribute approximately 4% (Schmölcke et al. 2007).
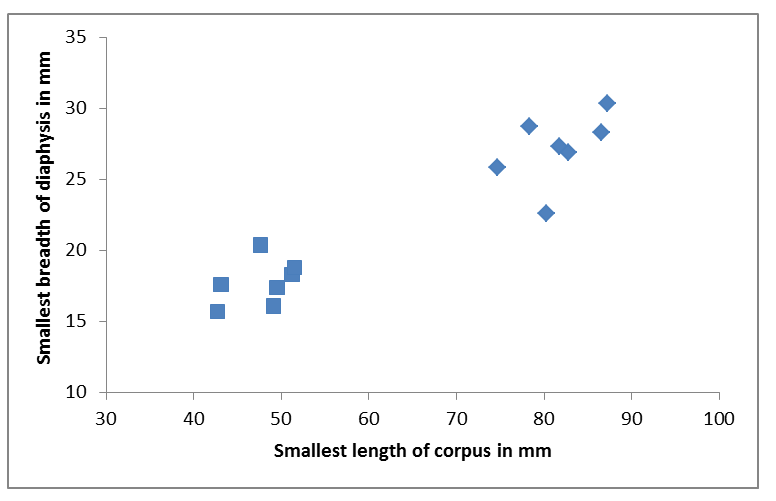
Table 2 describes the age estimations of epiphyseal fusion. Bones with still open epiphyses can belong to animals younger than the estimated age of fusion, while bones with fused epiphyses can belong to animals older than the estimated age of fusion. Hence, the actual age of seals found in this archaeological context can differ from the age clustering derived by ageing based on epiphyseal fusion, which reflects all age groups, yearlings, juveniles, young adults and adults (Table 2). Since ageing of seals based on epiphyseal fusion gives only a rough age estimation, an osteometric analysis has been applied on humeri and femora (Storå and Ericson 2004; Storå 2001a). The distribution of the osteometric data shows clearly that the harp seal assemblage is dominated by two groups in Neustadt (Figure 1). A comparison with modern data obtained from harp seals trapped in fishing equipment in Tromsø, Norway, in 1987 and published by Storå (2001a) allows us to identify an age group of yearlings up to 10-11 months old and an age group of adults. Furthermore, according to these modern data, the smallest bones within the age group of yearlings (blue squares), which have a smallest length of corpus under 45mm correspond to seal pups up to 3 months old, while the largest ones correspond to juveniles up to 10-11 months old (Figure 1). The age group of young adults is not represented among the harp seals of Neustadt. Osteometric analysis of grey seal bones showed the presence of yearlings as well as adults. The analysis could not be performed for ringed seals.
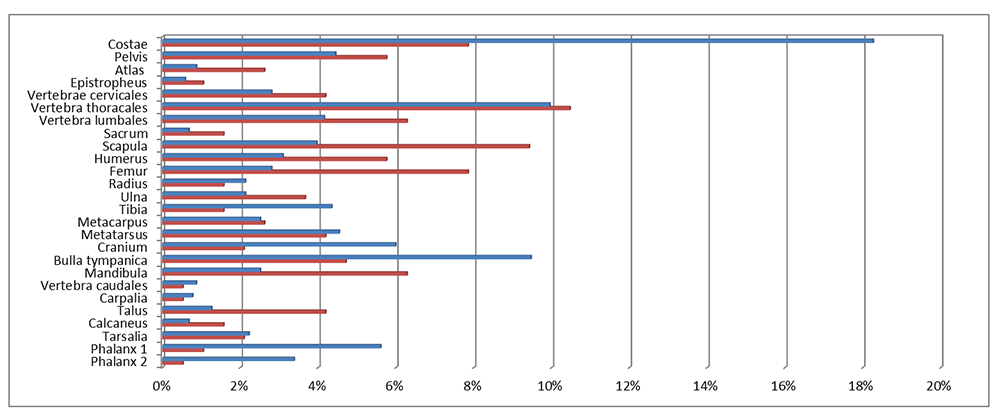
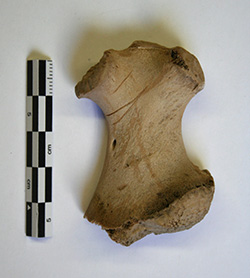
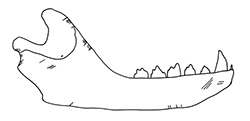
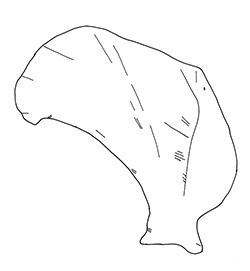
Cut marks were recorded on 14.8% of the seal bones (Figure 2 and Figure 3), which is a very high percentage, if one considers that this includes only the visible butchery marks in an archaeological context (Lyman 1992, 248). All three species, harp, grey and ringed seals, disclosed no differences in the position and kind of cut marks on the skeleton, showing that hunters followed a common method for all marine mammals. Cut marks were observed on bones from all ages including the younger age group of 0-3 month old seals (Figure 4, Figure 5 and Figure 6). Frequencies and the type/position of cut marks on the bones reveal their origin during skinning, disarticulation and filleting, showing that hunters took full advantage of the seal carcasses (Binford 1981; Trolle-Lassen 1992). Cut marks referable to skinning (Figure 3, Figure 5) were observed on the skull (calvaria, maxilla and frontal), the mandible, the phalanges and metapodials. After removing the skin from the prey, hunters proceeded with the butchering which included disarticulation, filleting and eventually portioning. Cut marks referable to disarticulation occur while cutting through the articulations and appear regularly on the occiput, the majority of vertebrae, scapula, humerus, radius, ulna, acetabulum of the pelvis, femur, talus, calcaneus and lower epiphyses of metapiodials (Figure 3). They appear as short cuts around the articulations and are therefore easily distinguishable from filleting and/or scraping marks, which are commonly evident on skeletal elements rich in flesh. Such cuts appear on the scapula (Figure 6), humerus, femur, ulna, pelvis, on vertebra and the medial side of the costae. In these cases the cuts are more longitudinal and shallower than the ones originating during disarticulation, and often appear as a group of extended cuts. According to the meat utility index for phocid seals (Lyman et al. 1992) the absolute and relative frequencies of the different parts of the skeleton as well as the frequencies of skeletal elements with cut marks illustrate that in Neustadt bones with high meat utility value, such as ribs, and the upper limb bones, are well represented while the pelvis, second in the rank of meat rich body parts, seems to be under-represented. Interestingly, bones with lower (vertebrae) or low meat utility values (lower limb bones (flippers)) are frequently represented as well (Figure 2). The significance of these observations for the butchering methods used by prehistoric hunters will be discussed below.
| Element | Unfused | Fusing/fused | Age group | ||
|---|---|---|---|---|---|
| NISP | MNI | NISP | MNI | ||
| Harp seal | |||||
| Scapula distal | 4 | 3 | 10 | 5 | yearlings |
| Pelvis acetabulum | 4 | 3 | 16 | 9 | yearlings |
| Radius proximal | 6 | 4 | juveniles | ||
| Femur proximal | 8 | 5 | 7 | 4 | juveniles |
| Humerus distal | 5 | 3 | 8 | 4 | juveniles |
| Humerus proximal | 4 | 2 | 8 | 5 | young adult |
| Femur distal | 8 | 5 | 7 | 4 | young adult |
| Ulna proximal | 2 | 2 | 4 | 2 | young adult |
| Tibia/Fibula proximal | 4 | 2 | 4 | 4 | young adult |
| Ulna distal | 1 | 1 | 5 | 3 | adult |
| Tibia/Fibula distal | 1 | 1 | 2 | 2 | adult |
| Grey seal | |||||
| Scapula distal | 5 | 3 | 6 | 3 | yearlings |
| Pelvis acetabulum | 4 | 2 | 6 | 4 | yearlings |
| Radius proximal | 3 | 3 | juveniles | ||
| Femur proximal | 2 | 1 | juveniles | ||
| Humerus distal | 2 | juveniles | |||
| Humerus proximal | 3 | 2 | young adult | ||
| Femur distal | 2 | 1 | young adult | ||
| Ulna proximal | 2 | 2 | young adult | ||
| Tibia/Fibula proximal | 6 | 3 | 2 | 2 | young adult |
| Radius distal | 1 | 1 | adult | ||
| Ulna distal | 2 | 2 | adult | ||
| Tibia/Fibula distal | 4 | 3 | 3 | 2 | adult |
| Ringed seal | |||||
| Scapula distal | 2 | 2 | yearlings | ||
| Pelvis acetabulum | 1 | 1 | yearlings | ||
| Radius proximal | 1 | 1 | juveniles | ||
| Femur proximal | 1 | 1 | juveniles | ||
| Humerus distal | 2 | 2 | 1 | 1 | juveniles |
| Humerus proximal | 1 | 1 | 1 | 1 | young adult |
| Ulna proximal | 1 | 1 | young adult | ||
| Tibia/Fibula proximal | 2 | 1 | young adult | ||
| Tibia/Fibula distal | 1 | 1 | adult | ||