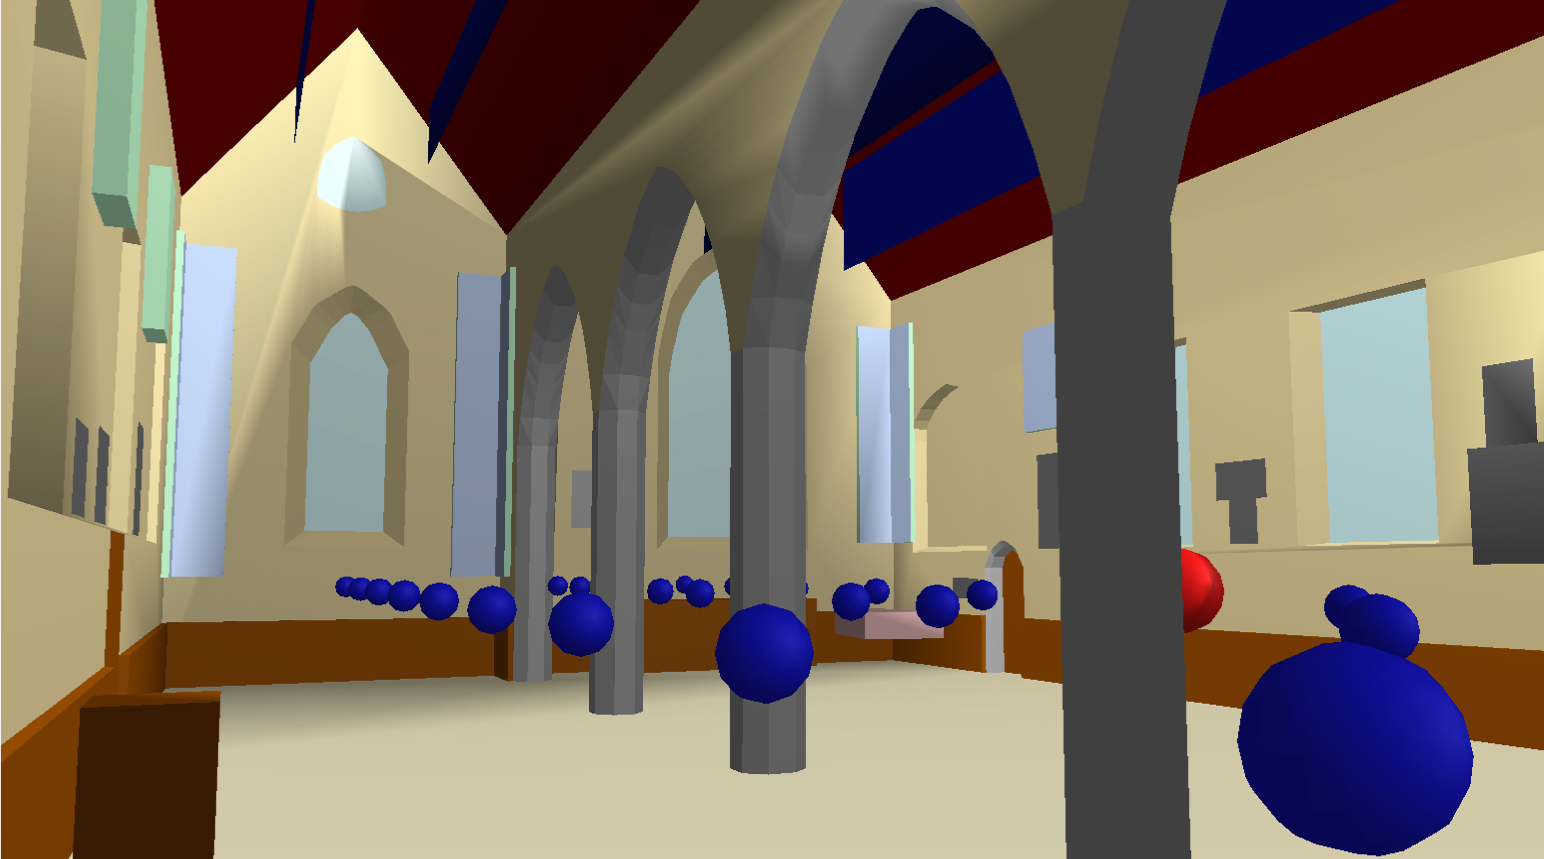
A computer model of St Margaret's Church was also developed, using two leading commercial applications, CATT Acoustic and ODEON, initially based on the architectural plans created during the most recent refurbishment of the space (Foteinou and Murphy 2011). These were adapted further based on physical measurements taken during the acoustic surveying process, and taking account of additional objects and furniture that had not been included in the original architectural plans. There are no standards providing recommendations about the level of the geometric detail that should be considered in such an acoustic model. However, apart from being impossible to simulate every object and structure within a space, an extremely detailed model causes a significant increase in the number of the reflections that have to be considered by the geometric acoustic algorithm used in these applications, leading to a potential loss of accuracy in the results, especially for low frequencies. Hence an appropriate 3D acoustic model was defined for both applications to the same level of detail, as shown in Figures 17–18.
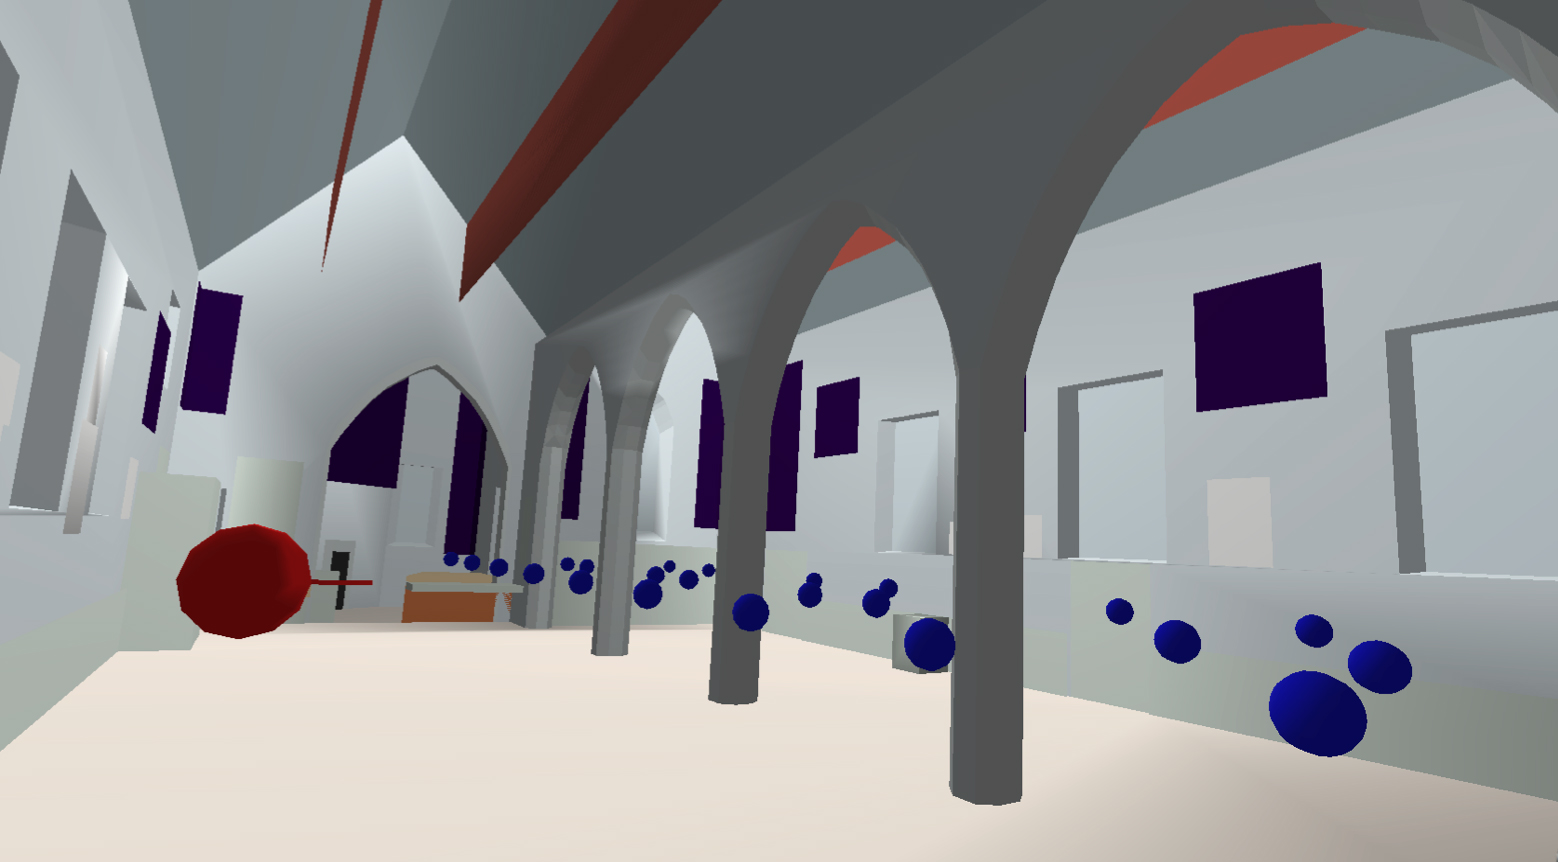
Once the 3D model was completed the acoustic characteristics of the surfaces within the model were defined, as these play a crucial role in the accuracy of the acoustic results obtained from the simulated space. Defining these characteristics is often a challenge for acousticians, with the main limitation being that the user has to rely on the material data provided in existing libraries that list frequency-dependent absorption and scattering coefficients that determine how sound interacts with a given surface. It is not likely that an exact match will be found for the specific materials required for a given project, and even then, as construction techniques differ, there may be some variance.
In this case study an extensive calibration process was performed with a view to arriving at an accurate, optimal set of surface definitions. Although other methodologies have been proposed in the literature (Postma et al. 2015) the approach taken here can be summarised as follows:
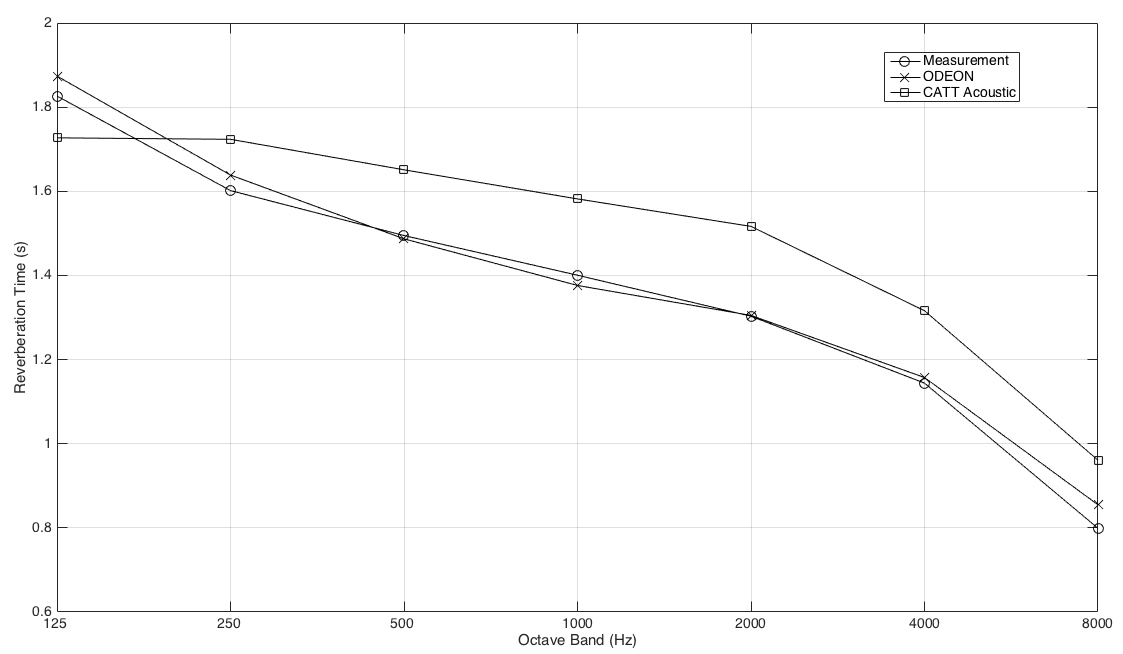
Figure 19 presents RT60 measurements across octave bands for the 17th microphone receiver position, based on the first configuration of panels/drapes, as derived from impulse responses obtained from acoustic measurements and the corresponding ODEON and CATT Acoustic models, post-calibration. The ODEON model gives an excellent match to the measurement case, with the CATT Acoustic example being sufficiently close. A set of auralisations generated from these examples follows, using a solo female soprano, recorded in anechoic conditions, as the sound source.
| Sound Example 1: Female soprano, recorded in University of York, anechoic chamber | |
| Sound Example 2: Impulse response obtained from acoustic measurements of St Margaret's Church, York, UK (17th receiver position, first configuration of panels/drapes) | |
| Sound Example 3: Post calibration impulse response obtained from the ODEON acoustic model of St Margaret's Church, York, UK (17th receiver position, first configuration of panels/drapes) | |
| Sound Example 4: Post calibration impulse response obtained from the CATT Acoustic model of St Margaret's Church, York, UK (17th receiver position, first configuration of panels/drapes) | |
| Sound Example 5: Auralisation obtained from the convolution of Sound Example 1 (Anechoic soprano) and Sound Example 2 (acoustic measurements of St Margaret's Church, York, UK, 17th receiver position, first configuration of panels/drapes) | |
| Sound Example 6: Auralisation obtained from the convolution of Sound Example 1 (Anechoic soprano) and Sound Example 3 (ODEON acoustic model of St Margaret's Church, York, UK, 17th receiver position, first configuration of panels/drapes) | |
| Sound Example 7: Auralisation obtained from the convolution of Sound Example 1 (Anechoic soprano) and Sound Example 4 (CATT Acoustic model of St Margaret's Church, York, UK, 17th receiver position, first configuration of panels/drapes) |
Internet Archaeology is an open access journal based in the Department of Archaeology, University of York. Except where otherwise noted, content from this work may be used under the terms of the Creative Commons Attribution 3.0 (CC BY) Unported licence, which permits unrestricted use, distribution, and reproduction in any medium, provided that attribution to the author(s), the title of the work, the Internet Archaeology journal and the relevant URL/DOI are given.
Terms and Conditions | Legal Statements | Privacy Policy | Cookies Policy | Citing Internet Archaeology
Internet Archaeology content is preserved for the long term with the Archaeology Data Service (ROR). Help sustain and support open access publication by donating to our Open Access Archaeology Fund.