Cite this as: Badreshany, K. SEM-EDS analysis of residues from pottery from Wade Street, Bristol in N. Corcos et al. Excavations in 2014 at Wade Street, Bristol - a documentary and archaeological analysis, Internet Archaeology 45. https://doi.org/10.11141/ia.45.3.3
The analysis of five samples of residues was undertaken by SEM-EDS at the Durham Archaeomaterials Research Centre. The aim of the analysis was to gain a better understanding of the function of these pots by determining the composition of these residues. The five samples were collected from two different contexts in Area A, 1145 and 1181.
Analysis was undertaken on the following samples: AG100, AG101, AG102, AG103 (context 1145), and AG104 (context 1181) as follows:
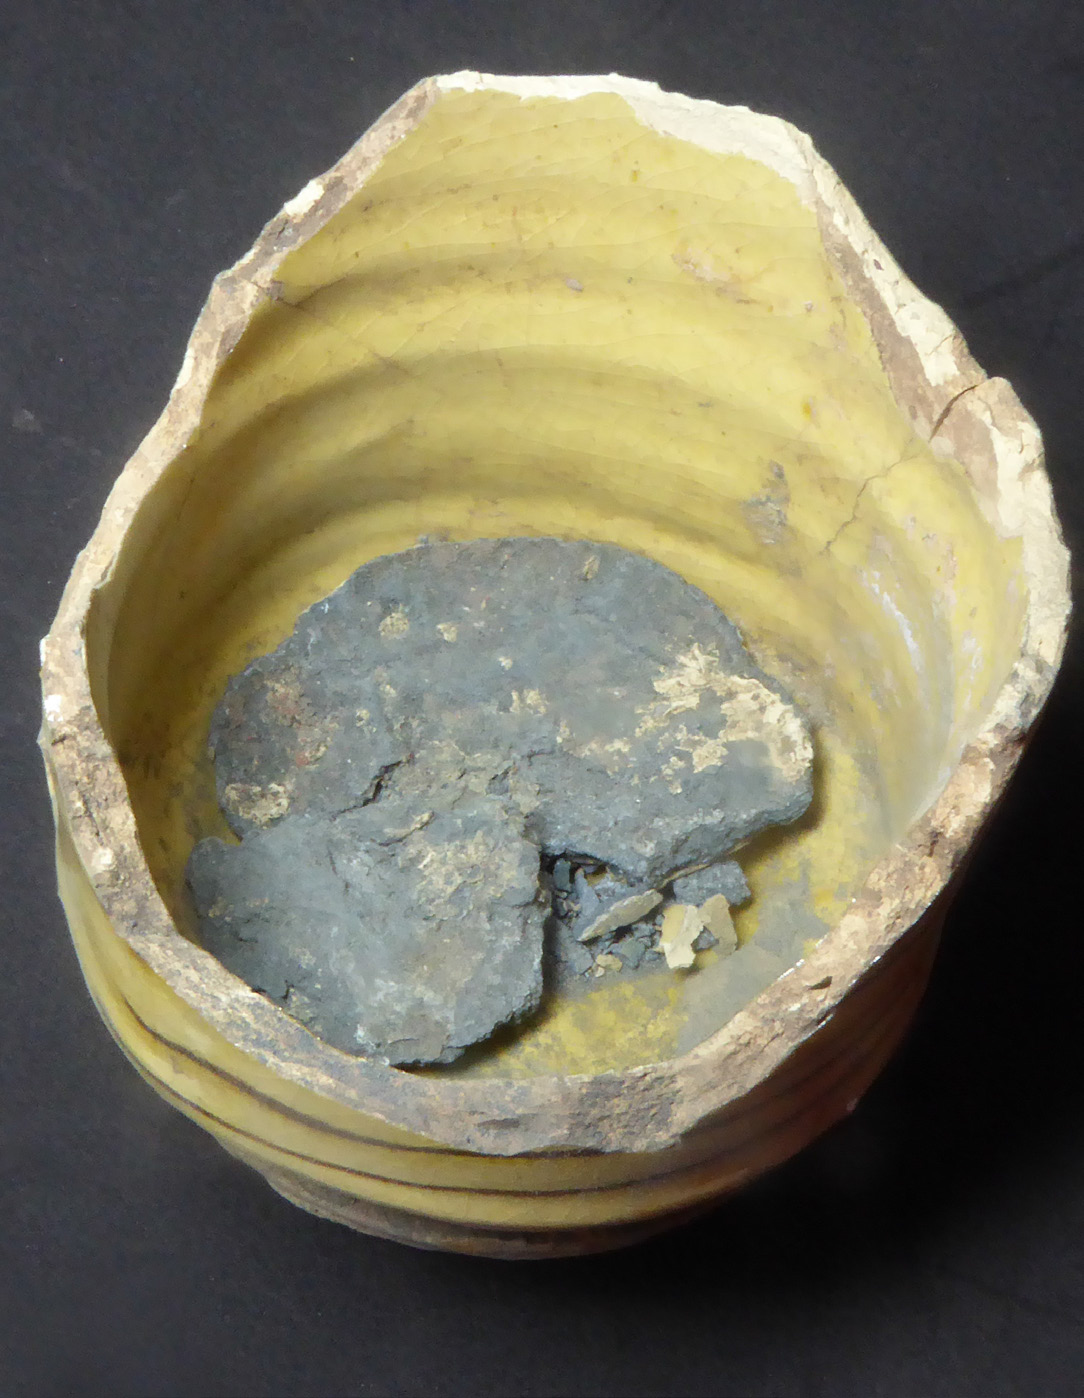
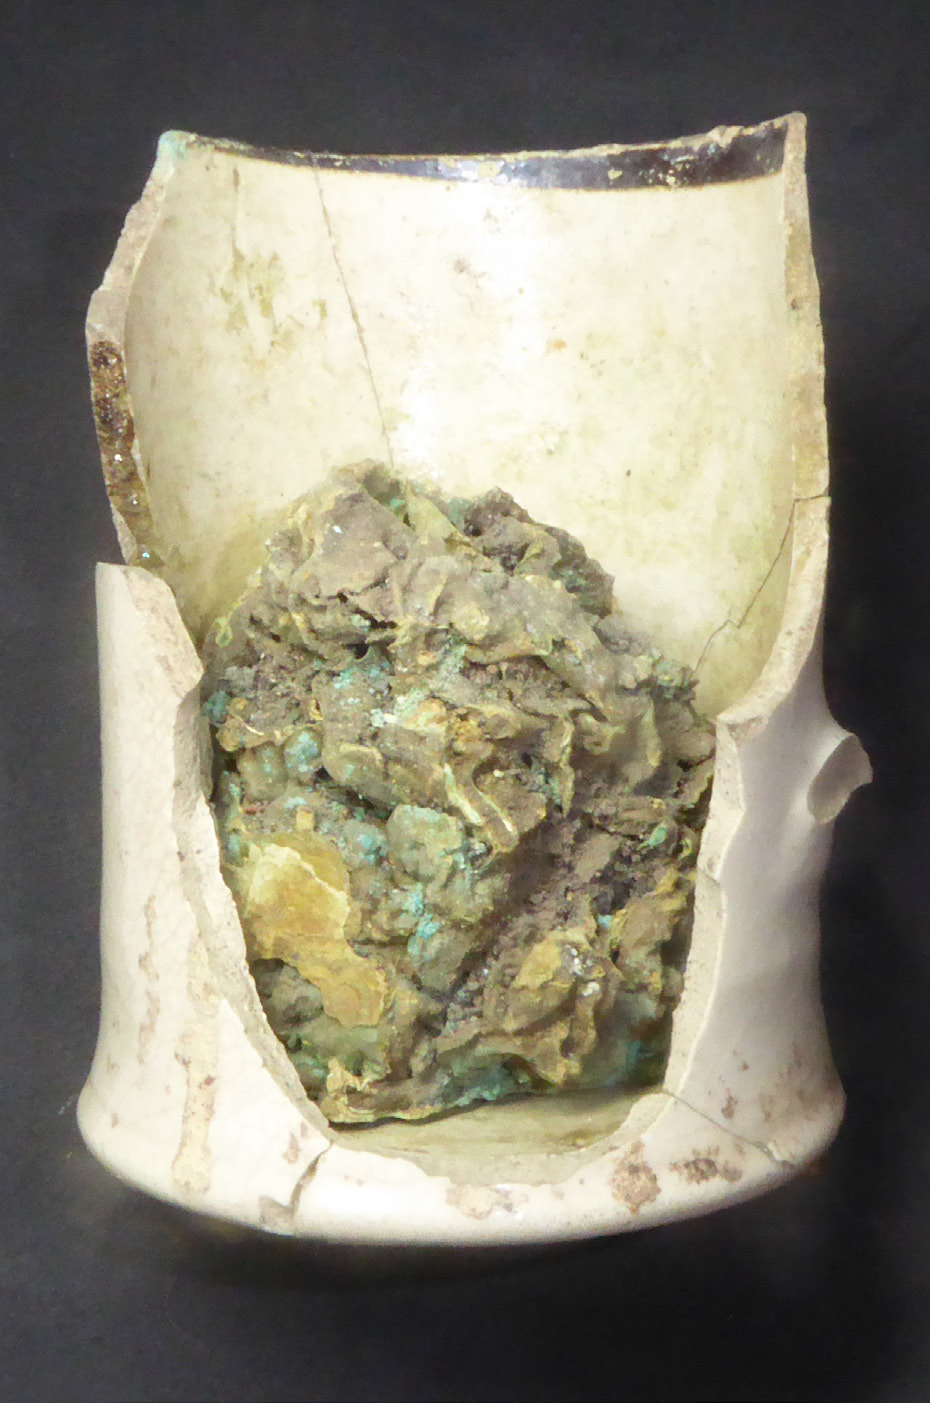
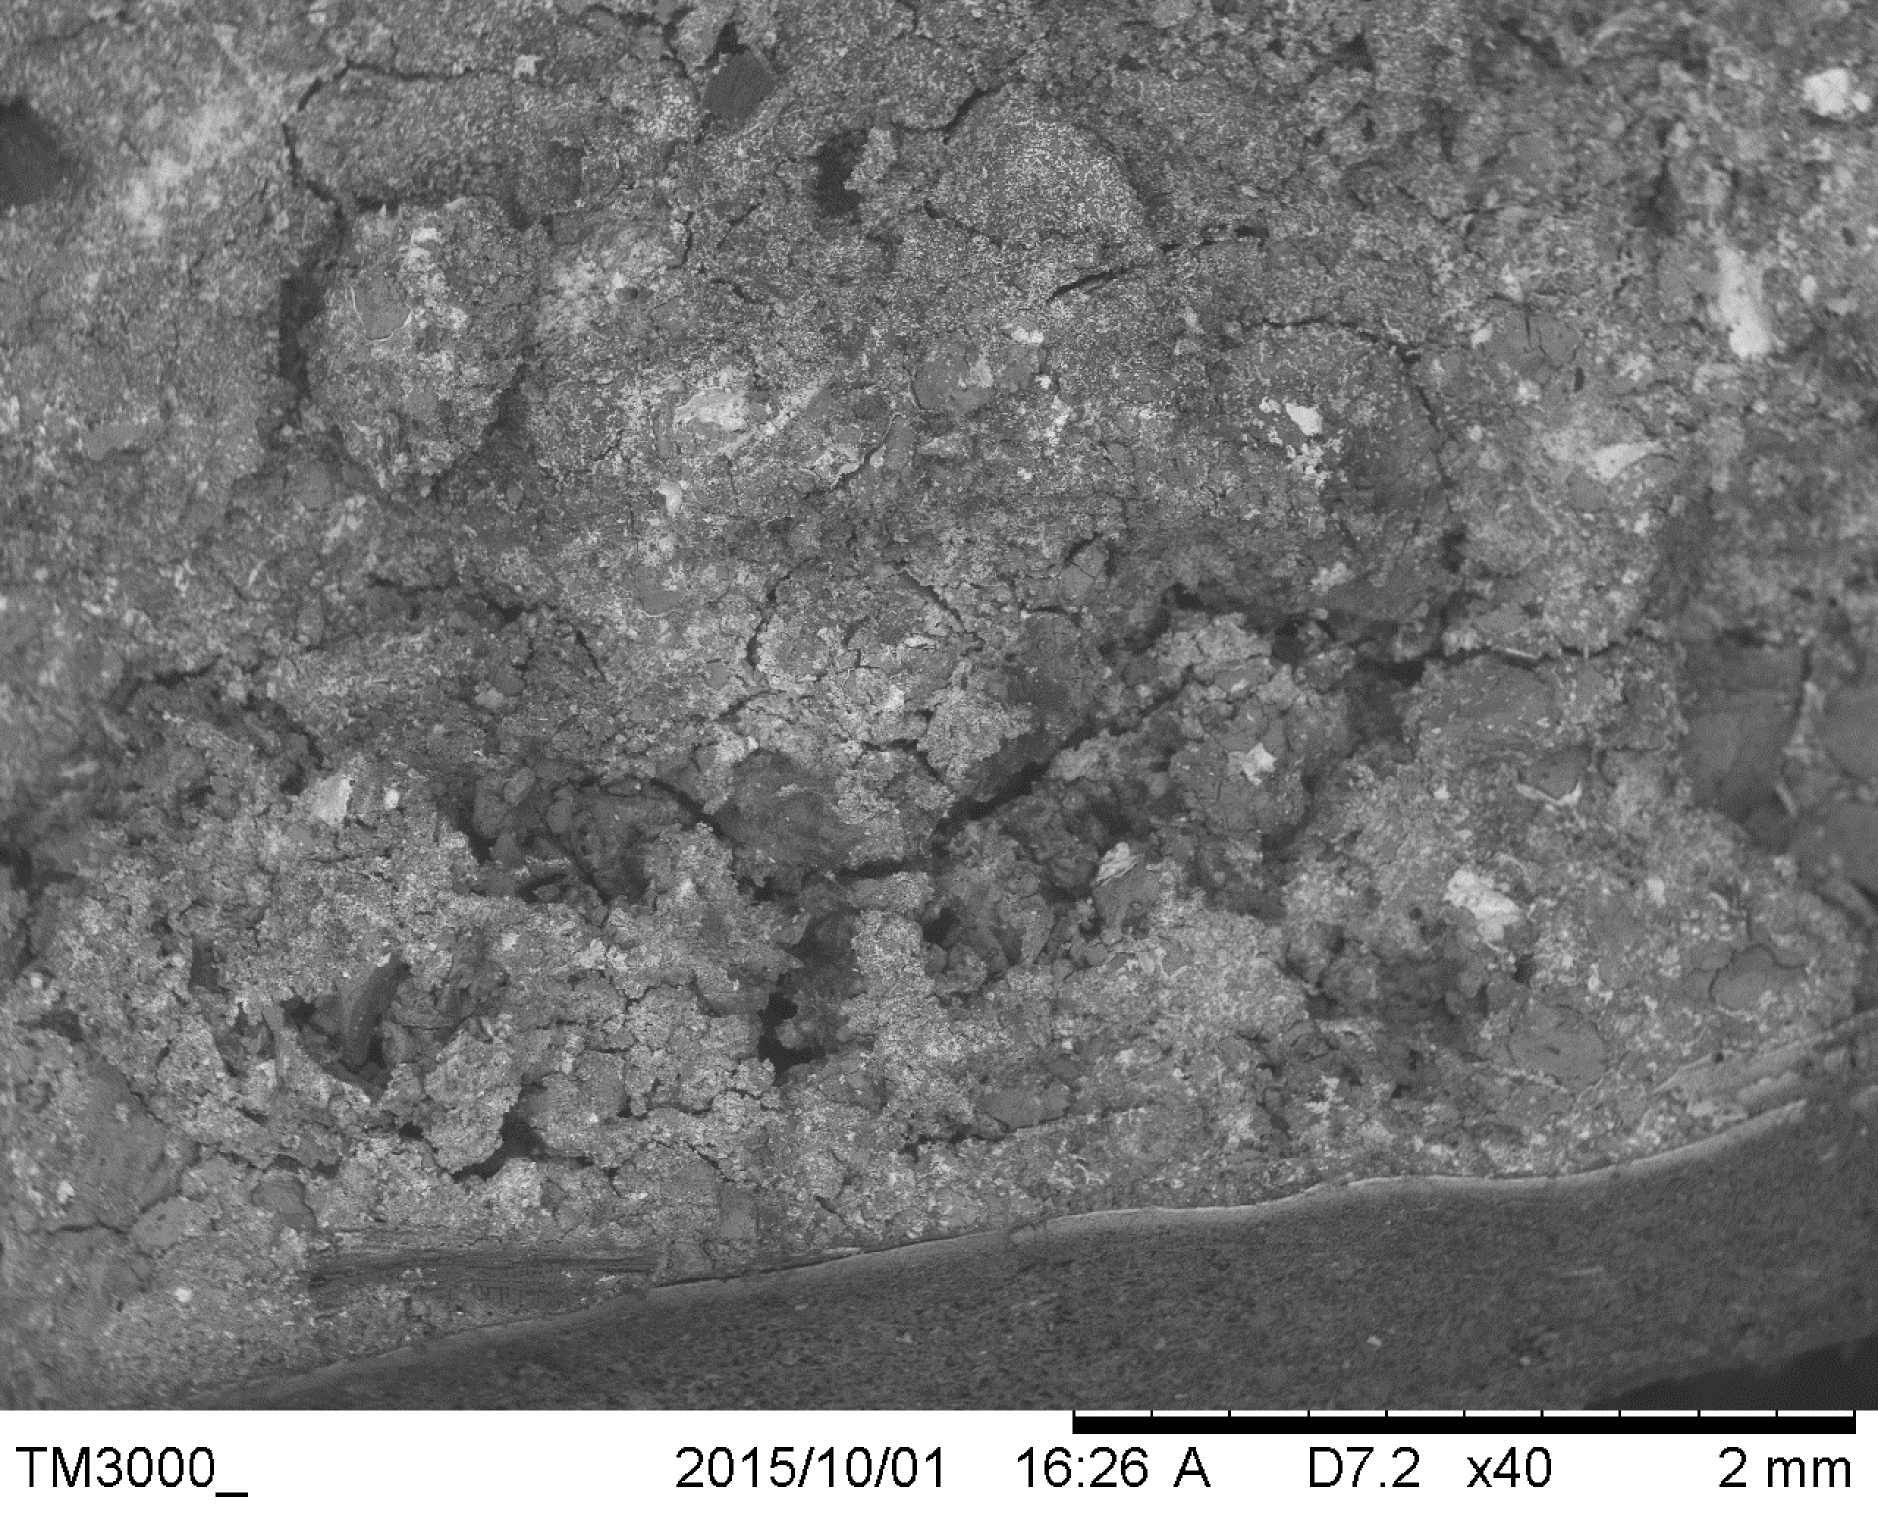
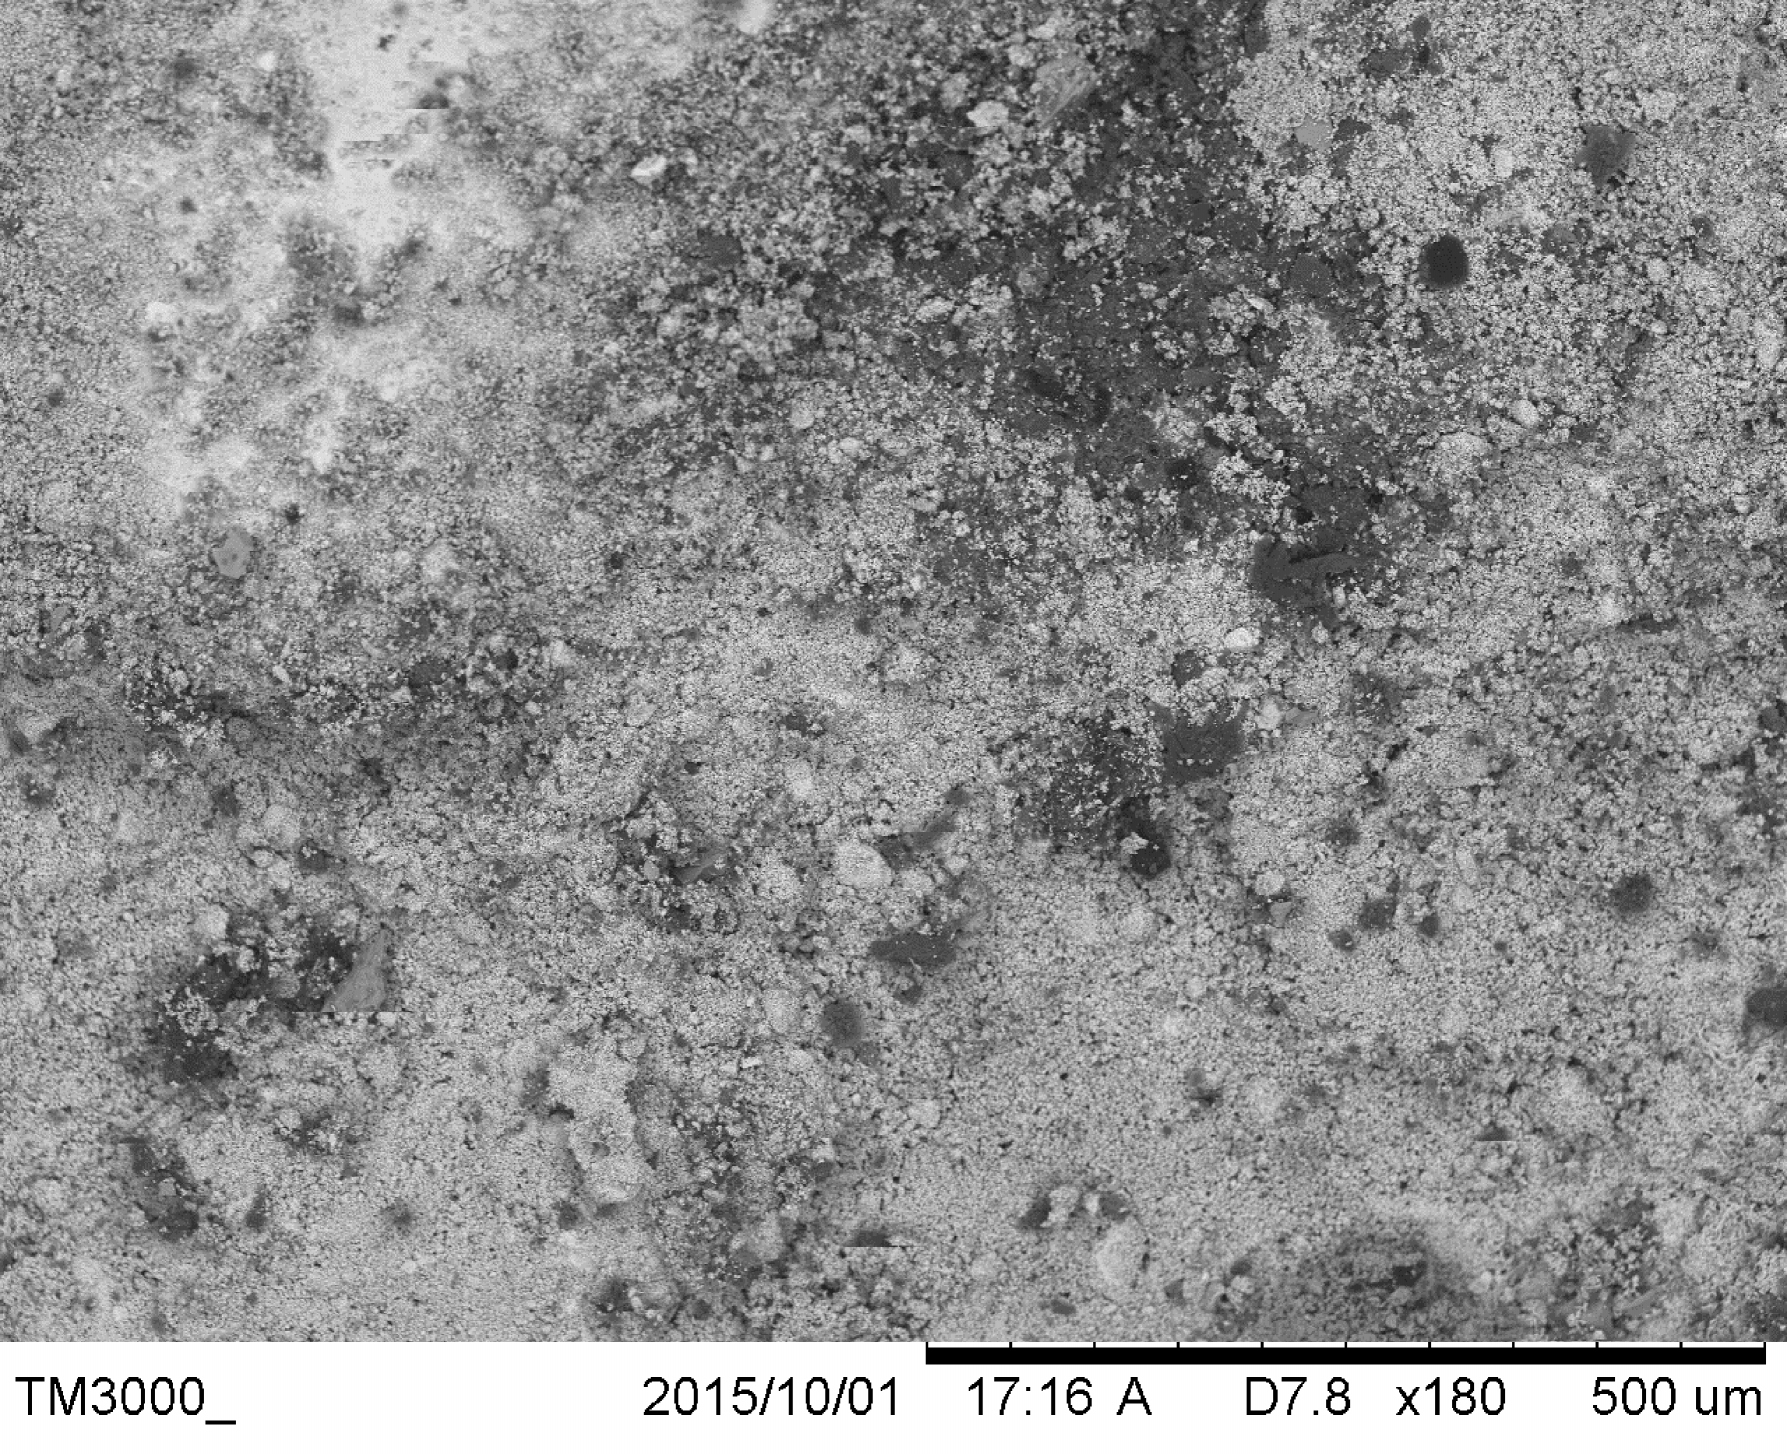
The samples were examined at the Durham Archaeomaterials Research Centre (DARC) using a Hitachi TM3000 SEM fitted with a SwiftED3000 EDS. The accelerating voltage was set to 15 kV and the probe current was set to 700 pA. The bulk compositional analysis was generated by the SwiftED software using standardless matrix corrections and is semi-quantitative. The residues of AG100 and AG101 were broken in half, exposing fresh sections for analysis. The cross-section of both residues was analysed to investigate whether they were affected by the weathering of the vessel's interior glazing. Contamination would be indicated by a greater amount of metals and other components commonly found in glazes towards the margins of the cross-section, where they would have accumulated to a greater extent after deposition as the pot surfaces weathered. Conversely, a uniform composition throughout the section would likely indicate that weathering of the vessel glazes had little impact on the results of the analysis. The residues from samples AG102, AG103 and AG104 were composed of a fine powder; no additional preparation steps were required for analysis.
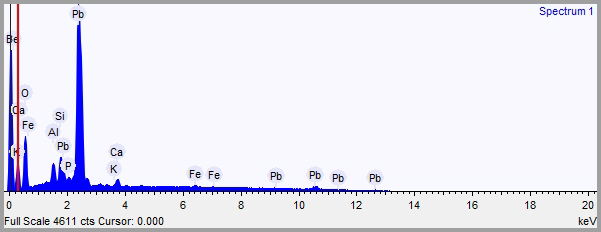
The Back-scattered electron (BSE) images of AG100 show a heterogeneous, but uniform, composition throughout the section. The EDS analysis indicates an inorganic composition, mostly of lead and iron, with lesser amounts of aluminium, silicon, sulphur, and calcium.
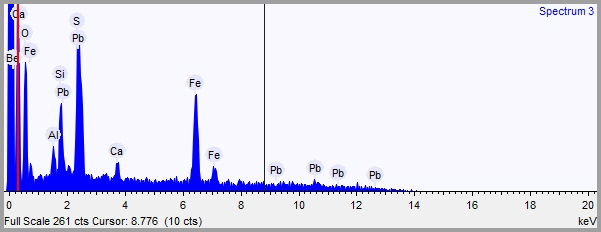
| Element | Weight % | Weight % σ | Atomic % |
|---|---|---|---|
| Oxygen | 28.162 | 1.215 | 61.841 |
| Aluminium | 1.775 | 0.278 | 2.312 |
| Silicon | 4.732 | 0.359 | 5.920 |
| Sulphur | 1.971 | 0.519 | 2.160 |
| Calcium | 2.139 | 0.338 | 1.875 |
| Iron | 33.759 | 1.230 | 21.237 |
| Lead | 27.460 | 1.390 | 4.656 |
The Back-scattered electron (BSE) images of AG101 similarly indicate a heterogeneous, but uniform, composition. The analysis of AG101 indicated a similar inorganic composition to that of AG100, containing roughly the same concentration of lead, aluminium, silicon, sulphur, and calcium. The composition of AG101 varies from that of AG100, as it contains high levels of copper and lower levels of iron.

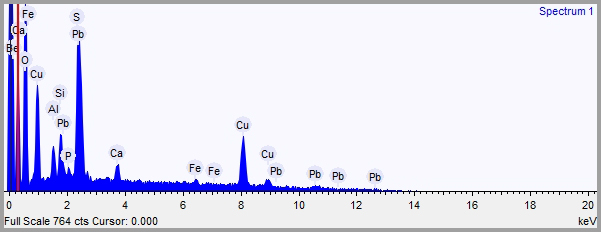
| Element | Weight % | Weight % σ | Atomic % |
|---|---|---|---|
| Oxygen | 38.539 | 0.758 | 74.553 |
| Aluminium | 2.321 | 0.161 | 2.662 |
| Silicon | 2.884 | 0.175 | 3.178 |
| Phosphorus | 0.547 | 0.149 | 0.547 |
| Sulphur | 1.311 | 0.290 | 1.265 |
| Calcium | 1.922 | 0.186 | 1.484 |
| Iron | 1.878 | 0.374 | 1.041 |
| Copper | 22.838 | 0.702 | 11.124 |
| Lead | 27.761 | 0.789 | 4.147 |
As mentioned above, the residues AG100 and AG101 probably derive from a liquid. The SEM-EDS analysis confirmed that the original material was inorganic and composed largely of metals. The BSE images show a uniform composition throughout the section of the residues, indicating no contamination from the vessel surfaces. Positively identifying the original materials from which the residues were derived would require further analysis. SEM-EDS analyses of pre-modern lead-based paints (Zagora 2013; Higgitt et al. 2003; Galván Josa et al. 2010) present a similar bulk chemistry to that of samples AG100 and AG101. AG100 and AG101 could thus represent lead-based paint residues. Interestingly, both AG100 and AG101 contain a similar concentration of lead, but vary in the composition of other elements like iron and copper, which are both well-known colourants. The differences in the composition of these elements could indicate that the residues represent different pigments.
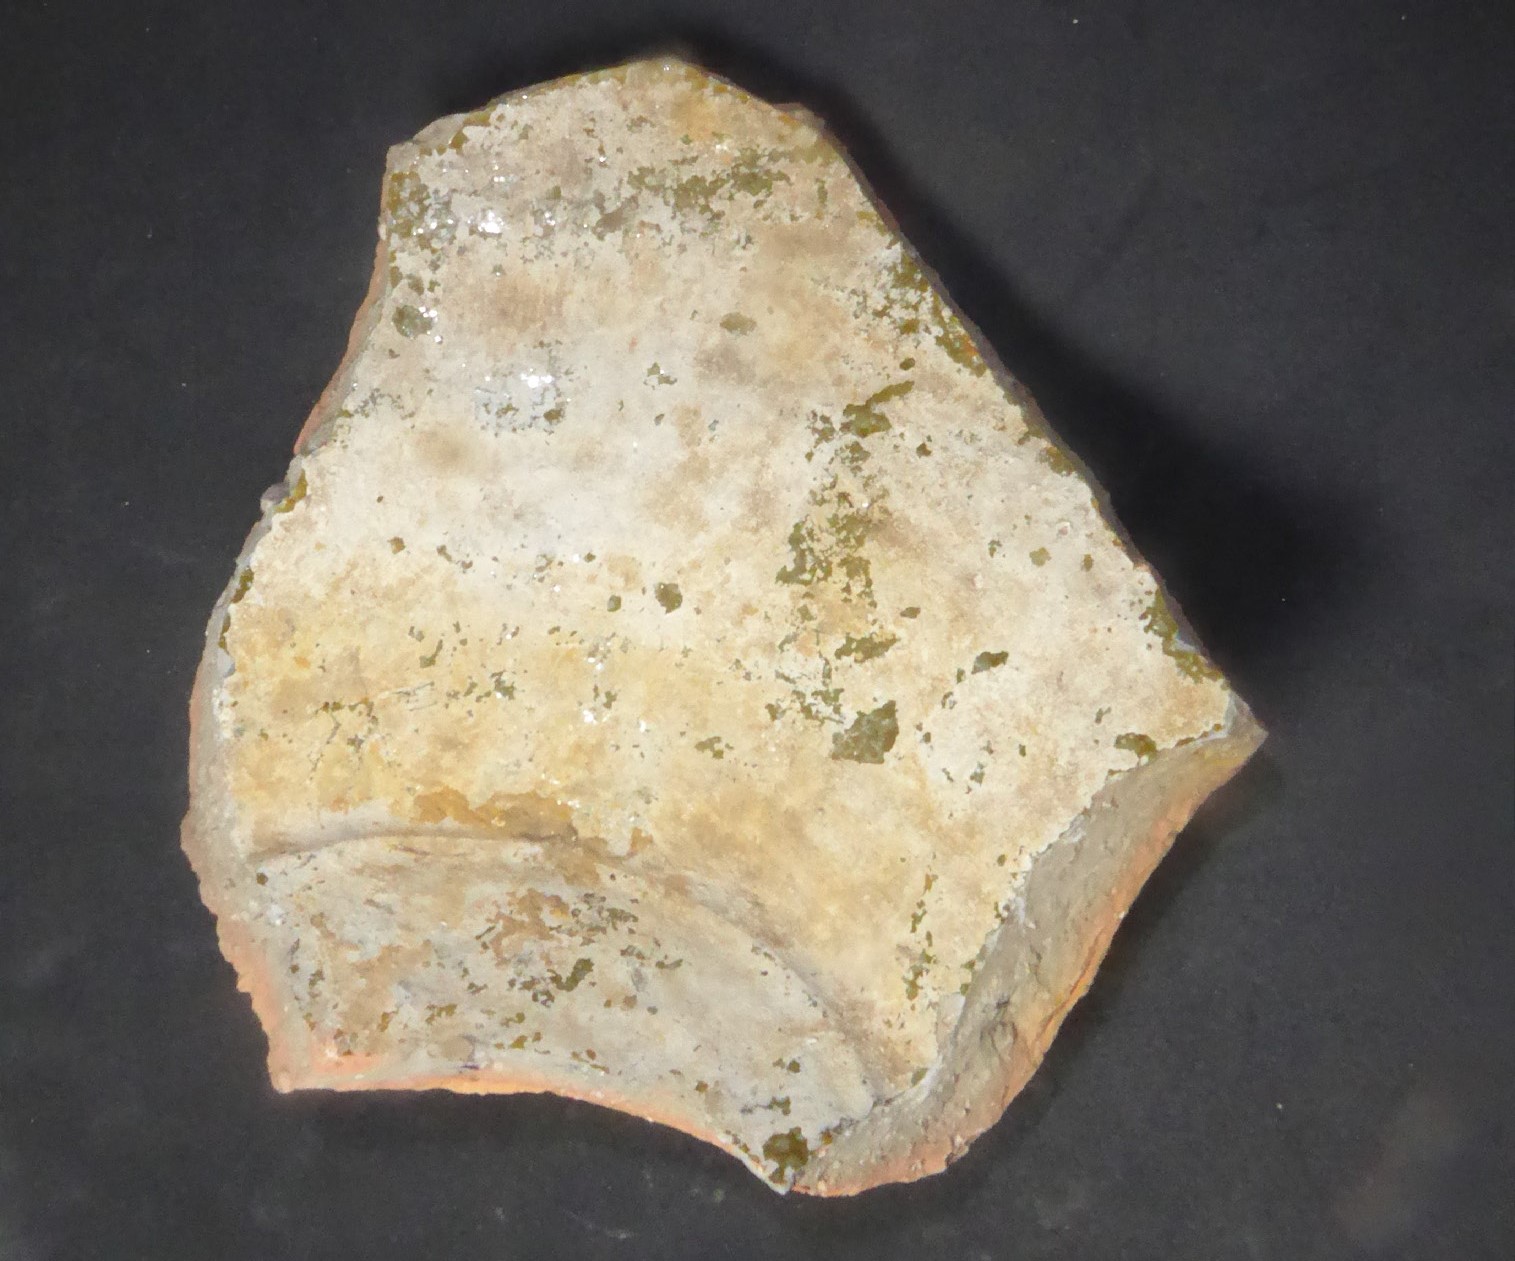
AG102, the white residue from the interior surface of a vessel, was analysed to investigate whether it represented a lead residue. The SEM-EDS analysis confirmed it is mostly composed of lead. The amount of lead found in AG102 is somewhat higher than that found in AG100 or AG101, but the residue is otherwise of broadly similar composition to these two samples, suggesting it might also represent a paint residue.
| Element | Weight % | Weight % σ | Atomic % |
|---|---|---|---|
| Oxygen | 27.545 | 0.433 | 75.182 |
| Aluminium | 2.148 | 0.086 | 3.477 |
| Silicon | 2.733 | 0.095 | 4.249 |
| Phosphorus | 0.504 | 0.082 | 0.711 |
| Potassium | 0.342 | 0.092 | 0.382 |
| Calcium | 1.655 | 0.108 | 1.803 |
| Iron | 0.843 | 0.213 | 0.659 |
| Lead | 64.230 | 0.457 | 13.537 |
AG103 was tested to investigate whether the residue contained lead or resulted from post-depositional concretions. The EDS analysis showed a high calcareous content.
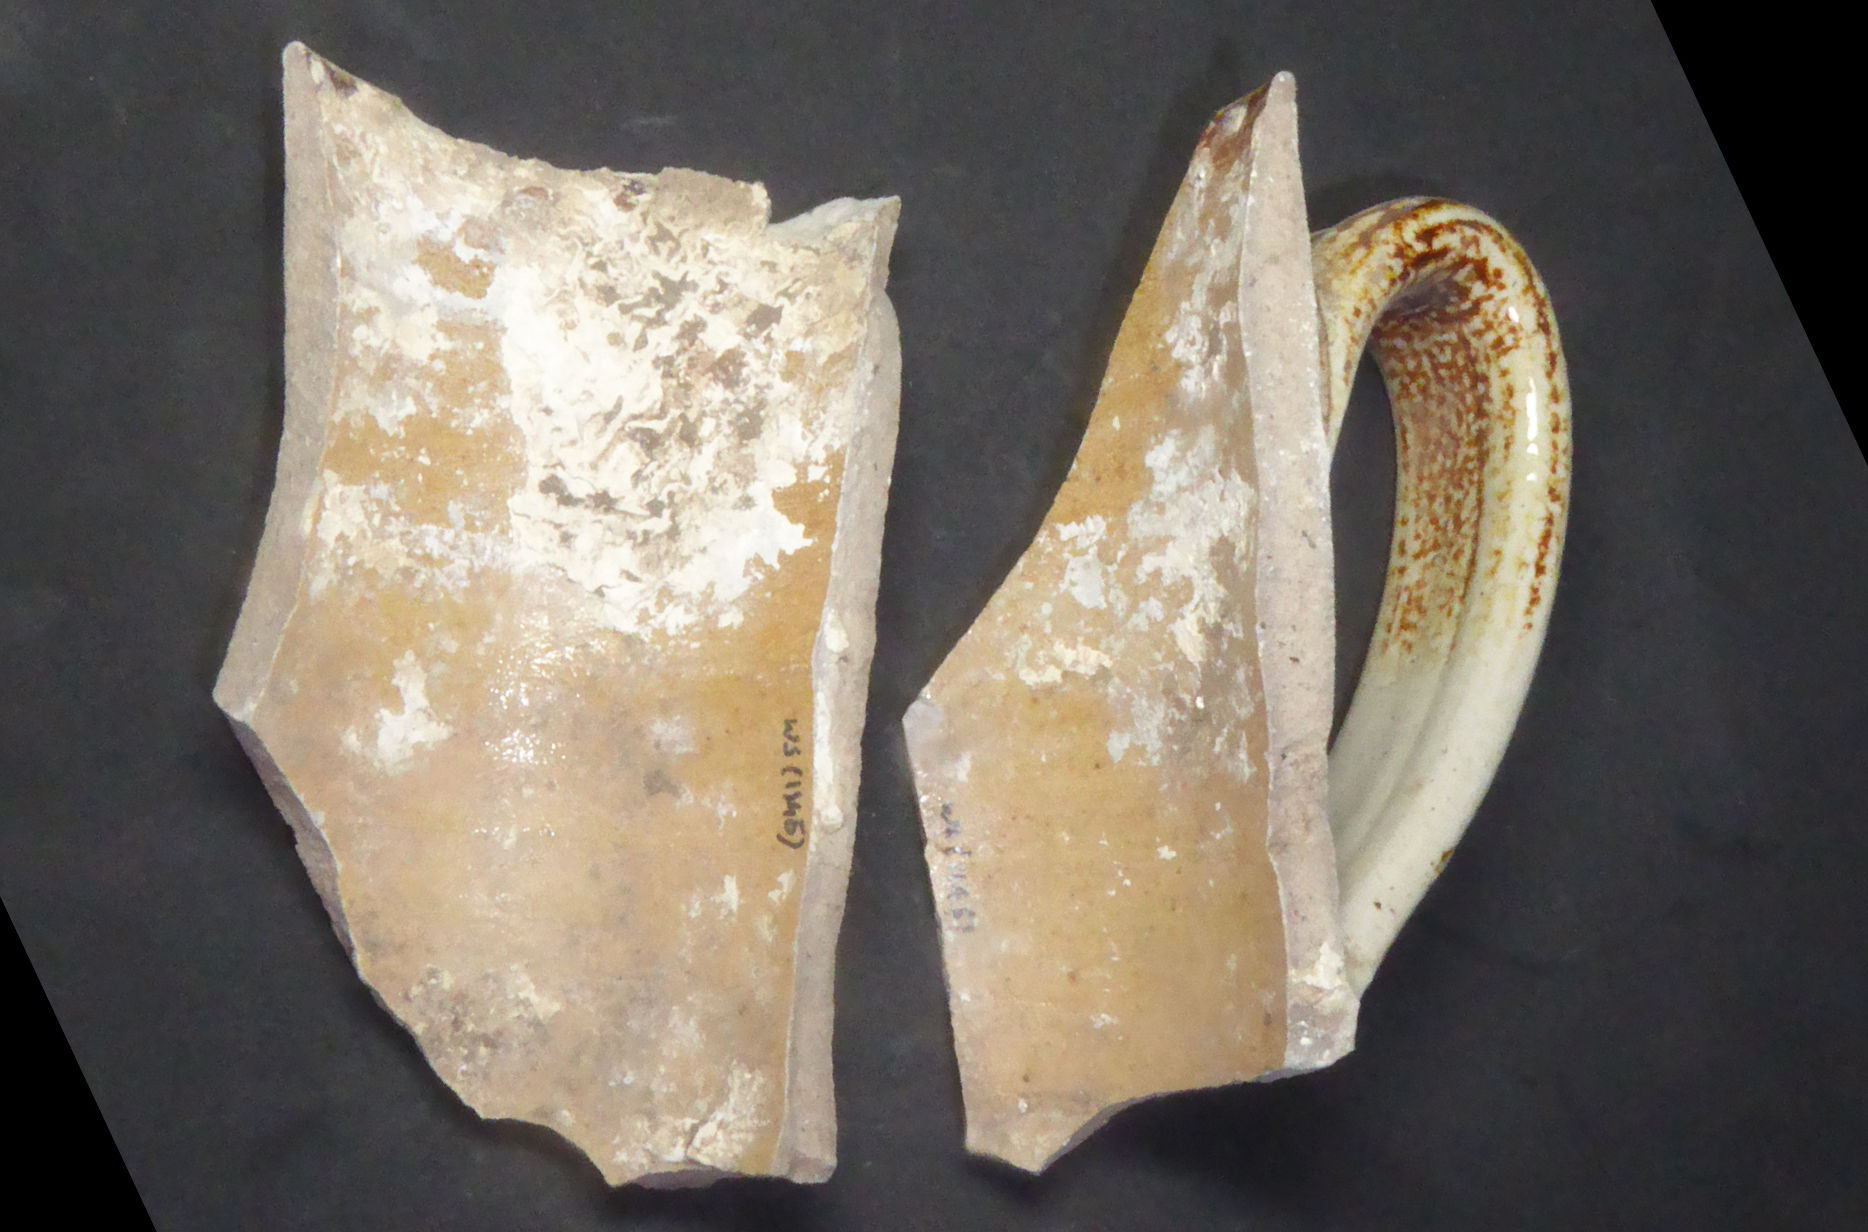
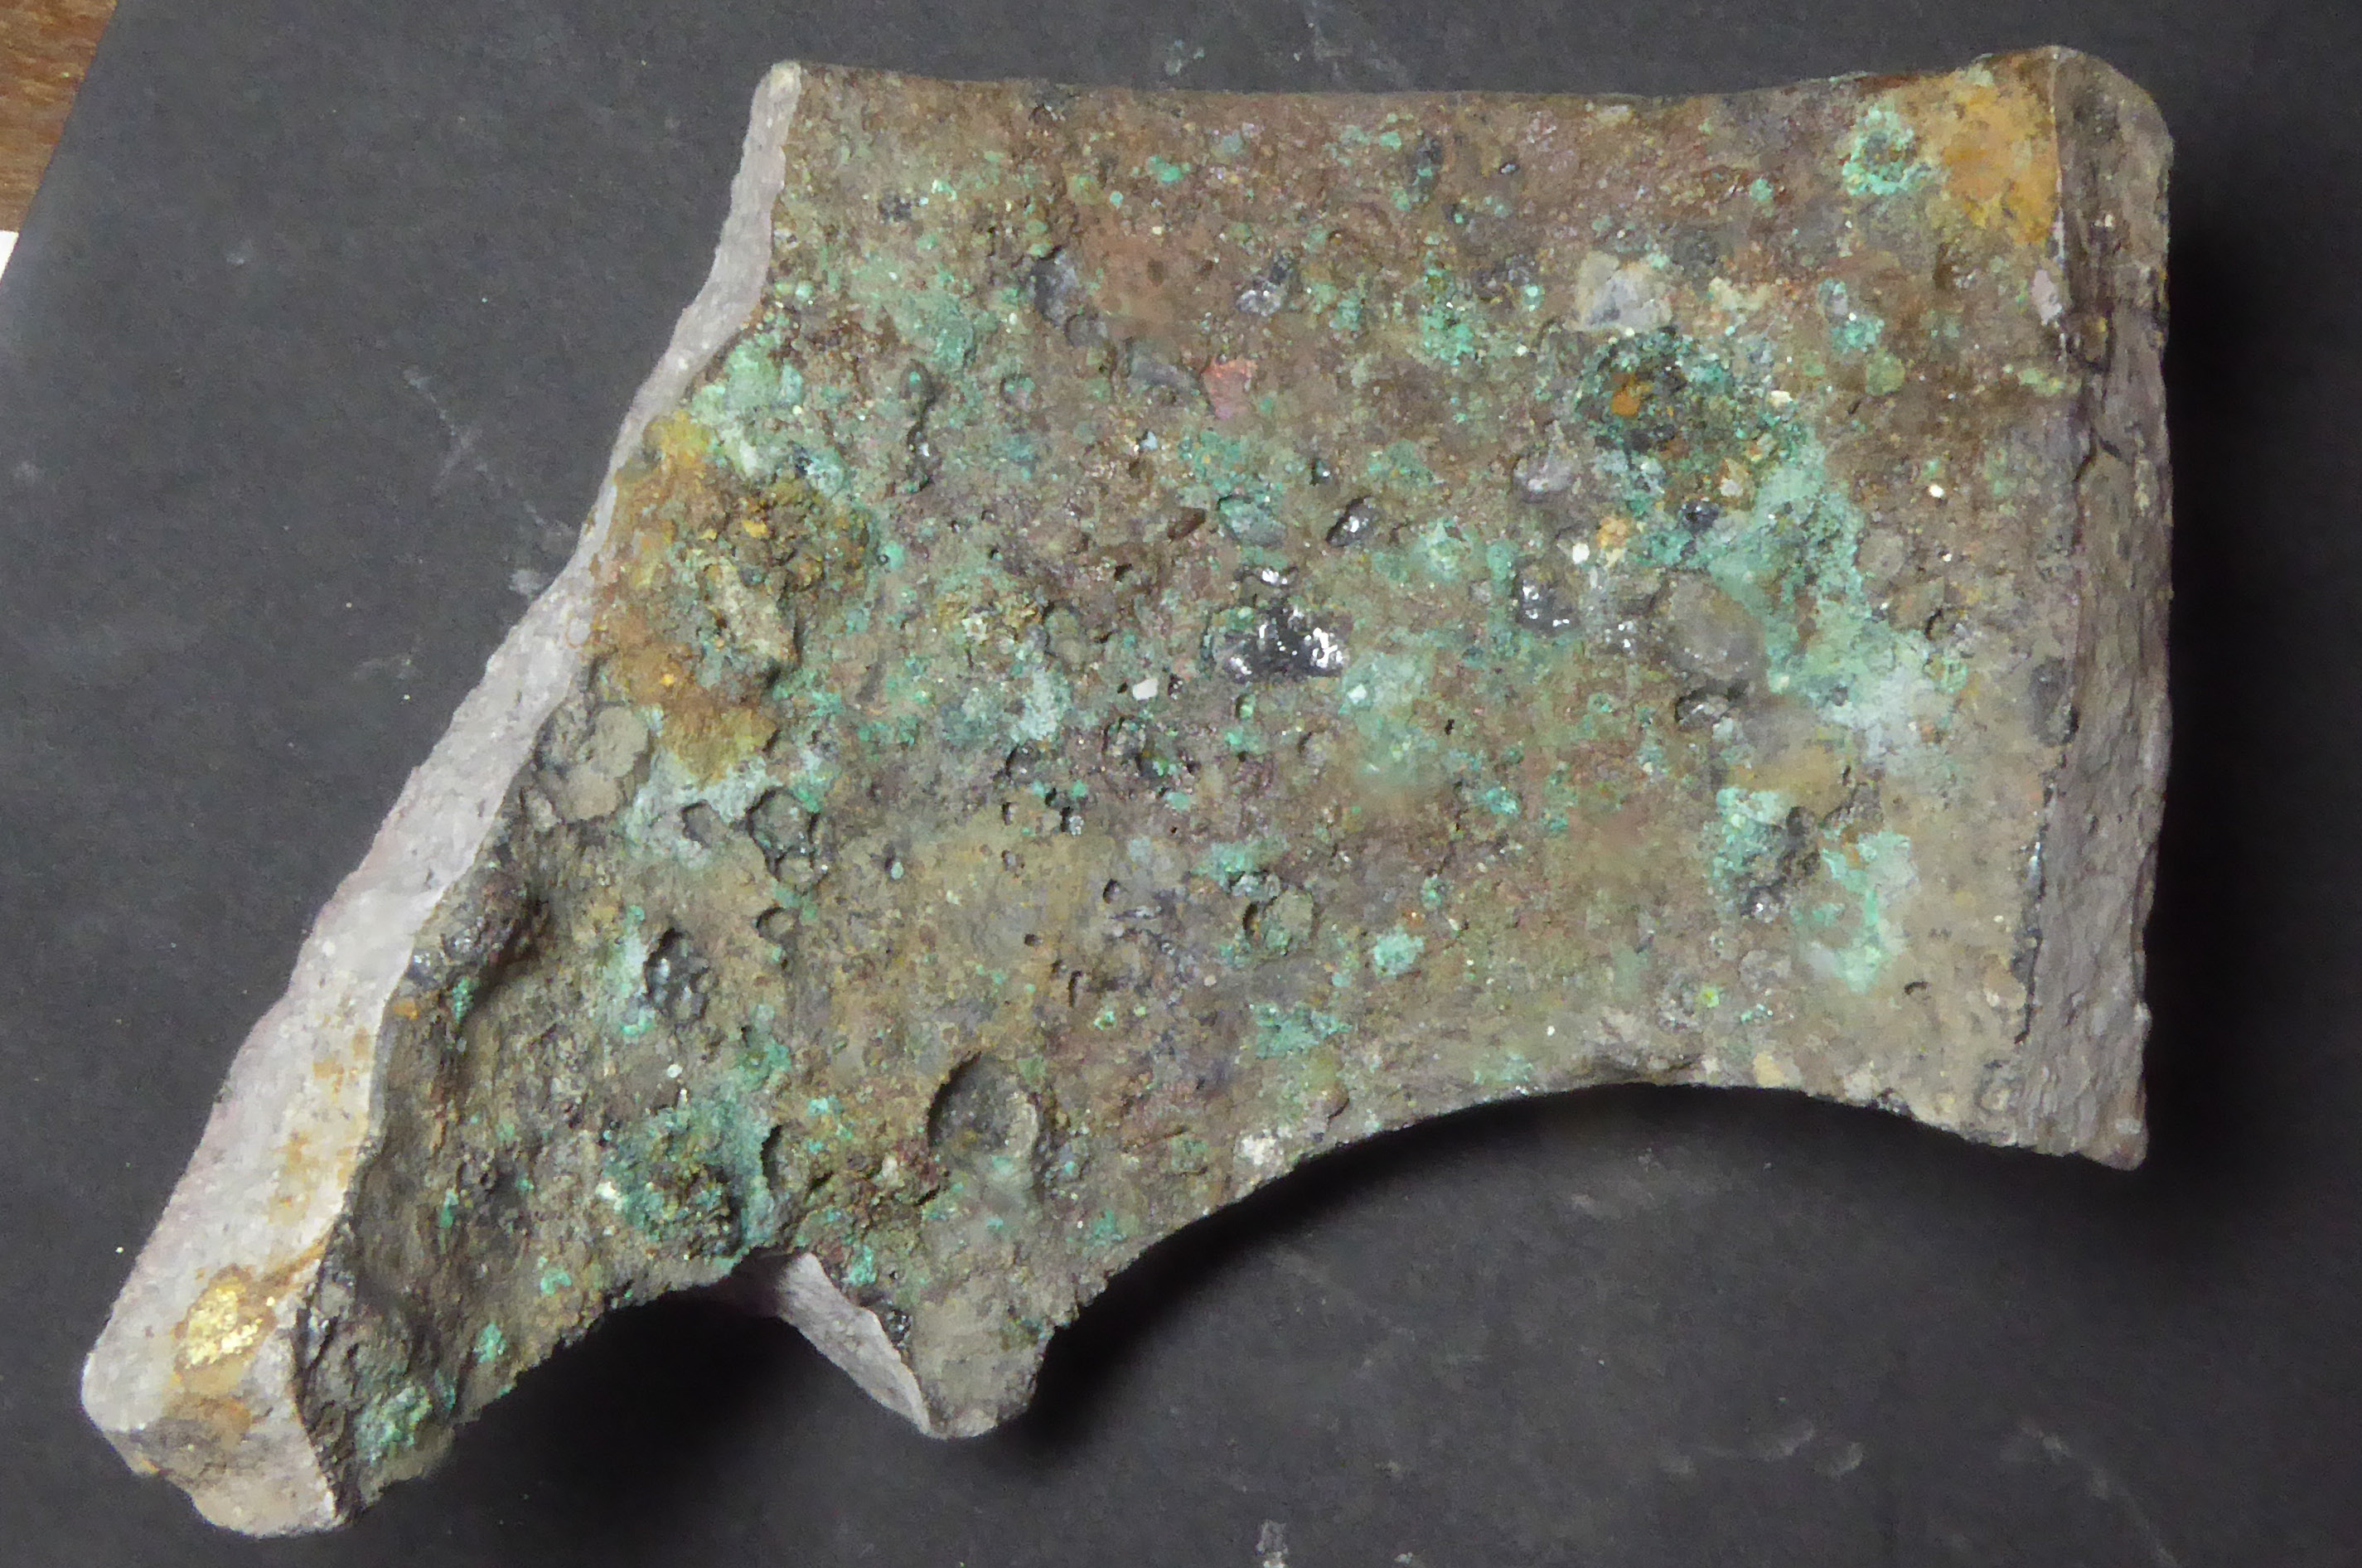
AG104, the greenish residue found on the inside of a dark brown glazed pottery fragment that may have been part of a crucible or a drainage pipe, was analysed to determine if the colour was due to a high copper composition. A small sample of the residue was scraped from the interior of the fragment. The results of the EDS analysis confirmed the residue was composed mostly of copper oxide and some aluminium.


| Element | Weight % | Weight % σ | Atomic % |
|---|---|---|---|
| Oxygen | 49.363 | 3.231 | 72.321 |
| Aluminium | 18.005 | 1.794 | 15.642 |
| Copper | 32.632 | 3.555 | 12.038 |
Internet Archaeology is an open access journal based in the Department of Archaeology, University of York. Except where otherwise noted, content from this work may be used under the terms of the Creative Commons Attribution 3.0 (CC BY) Unported licence, which permits unrestricted use, distribution, and reproduction in any medium, provided that attribution to the author(s), the title of the work, the Internet Archaeology journal and the relevant URL/DOI are given.
Terms and Conditions | Legal Statements | Privacy Policy | Cookies Policy | Citing Internet Archaeology
Internet Archaeology content is preserved for the long term with the Archaeology Data Service (ROR). Help sustain and support open access publication by donating to our Open Access Archaeology Fund.