 (December 2017)
Society of Antiquaries of Scotland, Chambers Street, Edinburgh EH1 1JF. Email: emma@socantscot.org
Cite this as: O'Riordan, E.J. 2017 A Review of 'Mid Republican House from Gabii' [digital publication], Internet Archaeology 45. https://doi.org/10.11141/ia.45.8
Edited by Rachel Opitz, Marcello Mogetta, and Nicola Terrenato. Published by the University of Michigan Press. $150. Available from https://doi.org/10.3998/mpub.9231782
This article is the first major publication of the Gabii Project, an international collaboration led by the University of Michigan, to investigate the ancient town of Gabii, Italy. The text of the article is available online through the University of Michigan Press with an accompanying database of the excavation (a format that Internet Archaeology readers will be familiar with).
At a cost of $150 (c.£113 at the time of writing) it is not cheap and clearly aimed at academic institutions and libraries. It is unlikely that many individual archaeologists, students or small organisations would be able to afford such a monograph.
The novel thing about this publication however, is the way in which it aims to integrate narrative text and interpretation with publication of as much data as possible, specifically through a series of 3D models. The authors' vision is that the spatial, descriptive and quantitative data are read in conjunction with a synthesis of the excavation results, thus providing a deeper, more meaningful introduction to the site – a private dwelling in the town dating to the mid-Republican period.
Gabii is located to the east of Rome and was a Roman urban centre that was apparently never re-occupied. The town itself occupied a strategic location in that it lay at a choke point on the most direct east-west route from Rome and places like Etruria and Campania. The town appears to have gradually reduced in size from the 1st century BCE onwards before being finally abandoned in the Late Antique period. The whole area was then used as farmland and never developed, thus proving an excellent opportunity to investigate an urban site undisturbed by later habitation. A parallel in Roman Britain would the site of Silchester which existed from at least the Iron Age but was then never developed (Clarke et al. 2007). Another commonality with Silchester is that it too was subjected to Antiquarian 'excavation' (in Gabii's case by the Scottish antiquarian Gavin Hamilton) which uncovered the monumental architecture but failed to uncover the 'everyday' houses and other domestic spaces. The main aim of the Gabii Project Excavations from 2009 to 2015 was to attempt to address the question "how did the settlement develop, change over time, and finally decay?"
The publication opens with an introduction, placing the archaeology of the site in a wider context and then discussing how the article is laid out; defining terms used and providing a brief history of the project.
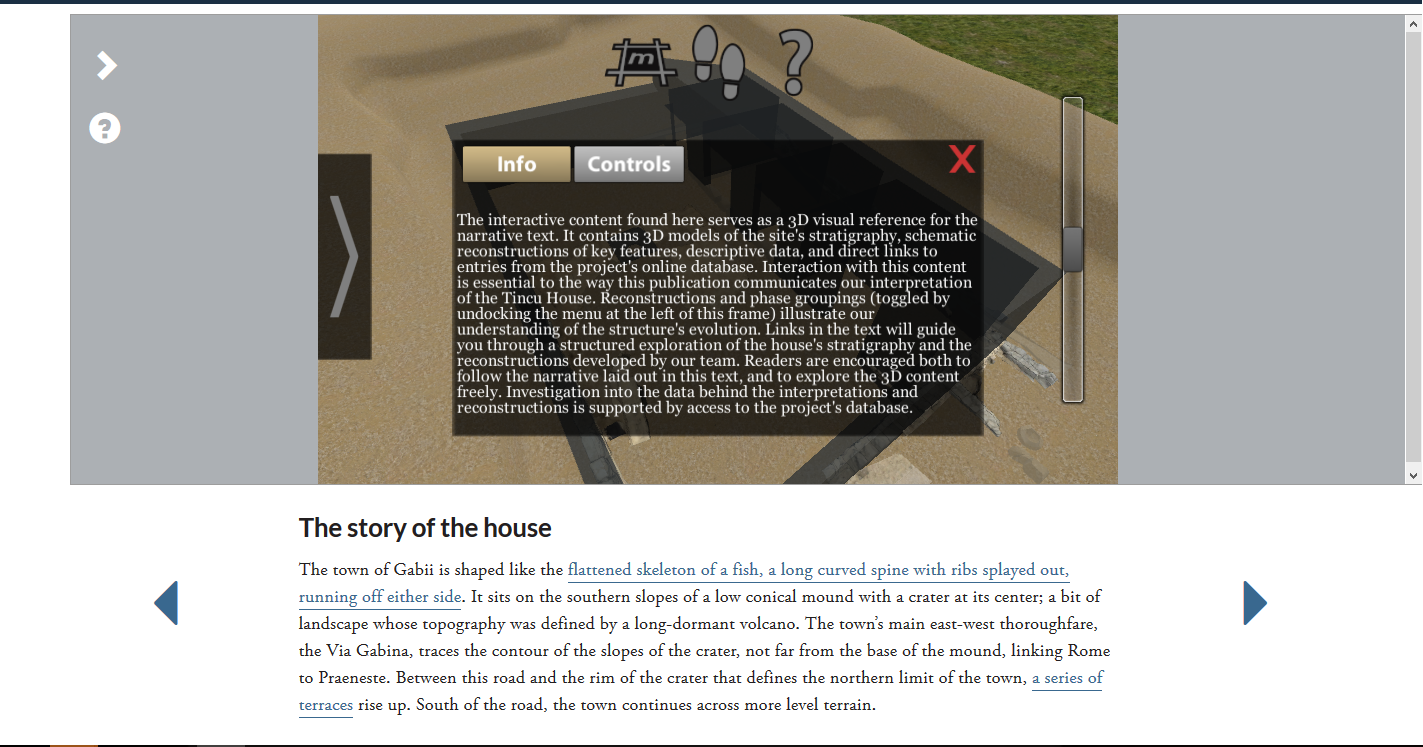
The introduction is very informative and contains a lot of archaeological information but the way in which it is structured does present a few issues. There are approximately 10,000 words in the introduction before the reader clicks through to the main article. Although the sub-headings are accessible through a menu in the top right of the browser (Figure 2), this could be made clearer as it is easy to miss, especially on device screens (I tested primarily using Chrome on a Windows PC and on a mobile phone using Chrome on an Android operating system. All review screenshots are from the Chrome on Windows PC). Having the menu screen enabled also obscures the first few lines of text, so it can be easy to get lost if readers look away from the screen for a moment. The lack of links apart from in the small, easily hidden menu (there are none for example along the top or side of the screen) means that the right hand side scrollbar in the browser has its work cut out! A simple menu of sub-headings would have improved general readability.
The introduction section also contains a number of illustrations which help the reader locate Gabii in relation to Rome and place previous geophysical work in context but there is no site plan, despite specific areas of the site (lettered A to F) being mentioned in the text. This makes it difficult to visualise the archaeology that is being discussed, both in terms of the scale of Gabii in the landscape and within the town itself. The text discusses a wide variety of archaeological evidence; including a large and well-preserved multi-hut elite residential compound, at least one cemetery, a laundry or tannery and what the authors say is the “largest and the best-preserved civic space in central Italy for its period to date”. To represent all of this archaeology, there is not one image. Including even a few visuals in this section would have broken up the text, thereby potentially increasing readability, and have added some colour and depth to what, as the text implies, is incredible archaeology.
At the end of this introductory section is the bibliography. In order to continue reading the article, readers must click on an arrow on the right hand side of the page. It could perhaps be made a little clearer that selecting this arrow takes the reader to the main 'story', rather than the next section of introductory text.
At the outset, a pop up box appears to tell the reader that “interaction with this content is essential to the way this publication communicates our interpretation”. By default, the article splits the screen into an upper and lower section as seen in Figure 1. The upper half contains the 3D model (discussed later in this review) but it is the lower half that contains the main 'story' and will be discussed first.
The main idea is that the article text can be read in three ways, or 'levels';
The different 'levels' can either be chosen from the menu in top right hand corner of the browser window or the reader can scroll through the text to find each one. Again, the menu is not obvious (although this may vary from browser to browser) and there are no sub-headings in the menu save for the three outlined above. Navigation of the overall publication is therefore difficult at times and it is very easy to lose your place.

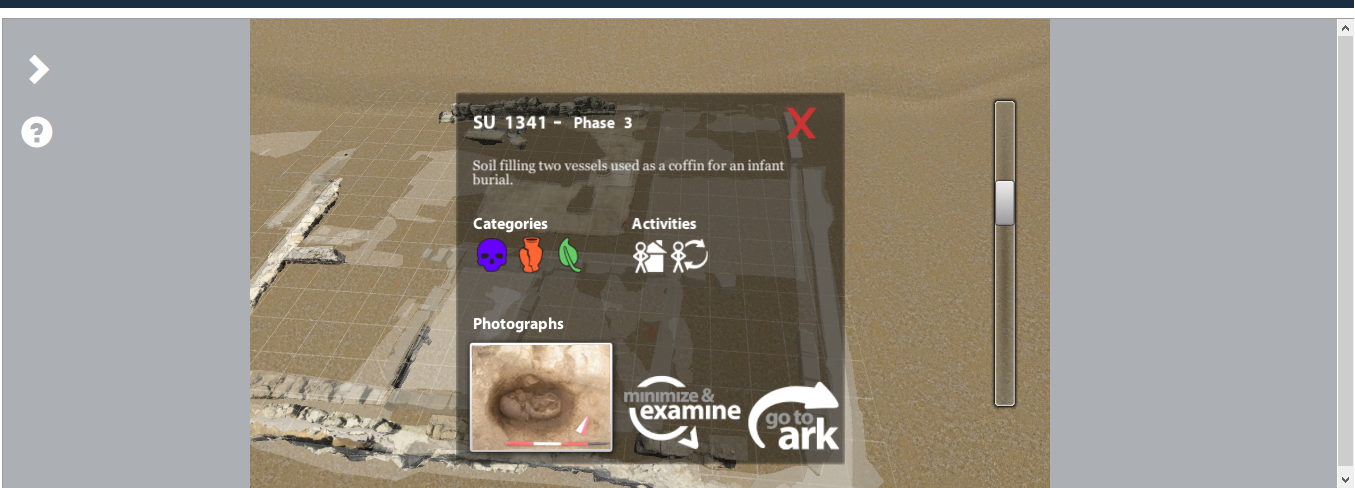
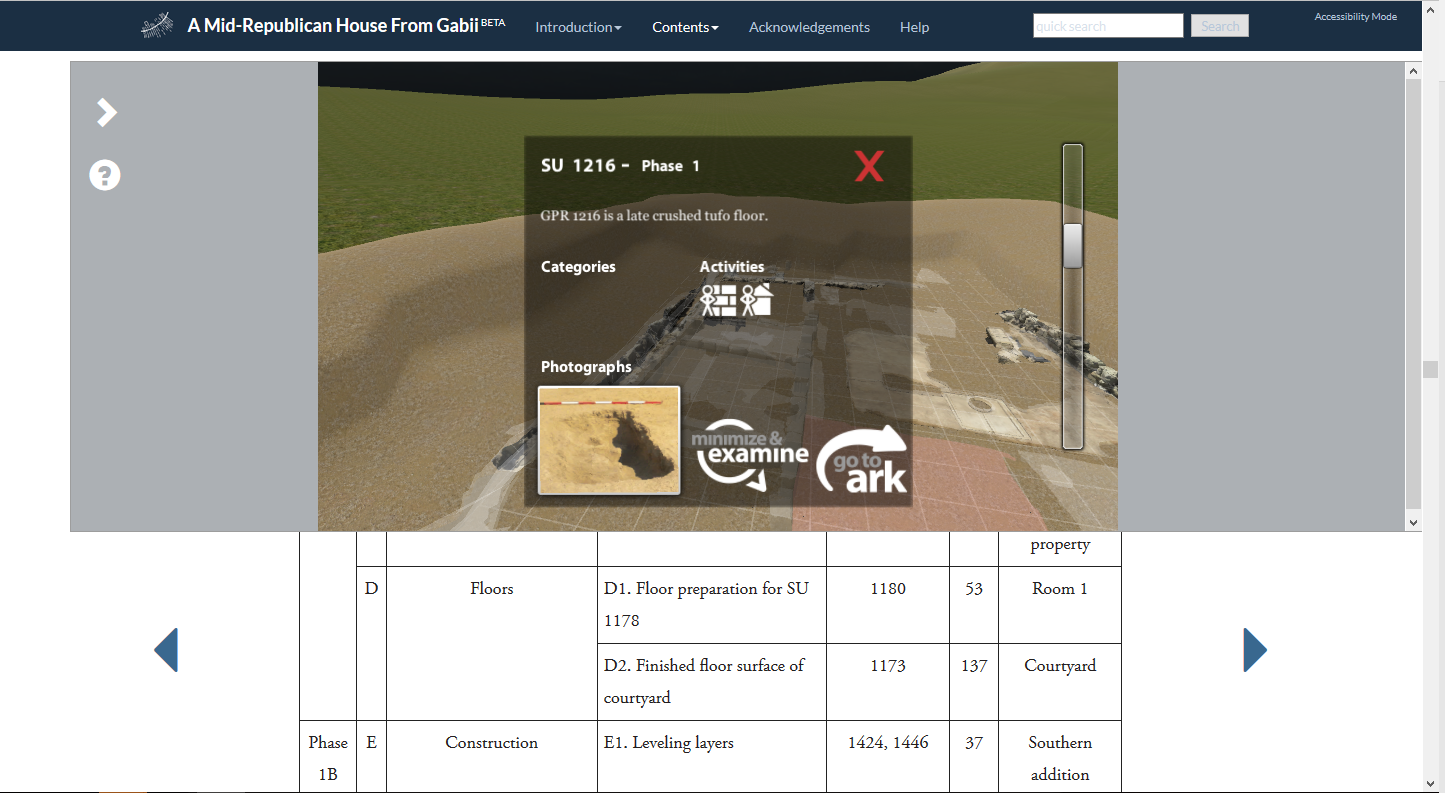
There are hyperlinks throughout the 'more' and 'details' sections; mainly stratigraphic units appearing as blue numbers in the text. If the 3D model is switched on, clicking on these will very helpfully highlight the context in the model in red and open a pop up with some more information as in Figure 3.
If the 3D model is not switched on or 'accessibility mode' is on, then a new browser window opens showing the database information for that stratigraphic unit.
The upper half of the main story screen contains the 3D model that forms the centrepiece of the publication. I should note that the model took a very long time to load for me, often up to 30 minutes, even with up to date software and hardware and with a variety of browsers and graphics cards. Access to the publication was tested in the morning, afternoon and evening and both during the working week and at weekends – no time seemed to be better than others in terms of loading speed. In my opinion, relying on the 3D model as the focus would have worked better if the loading experience had been smoother. As it was, while waiting for the model to load, I found it difficult at times to read the text when it was only given less than half of the screen at any one time.
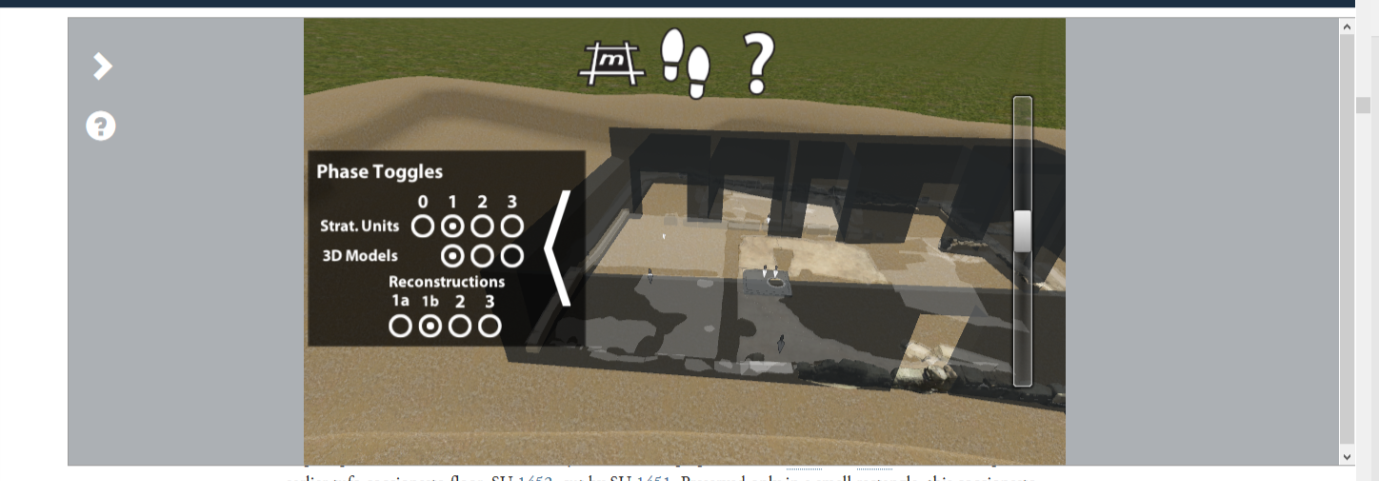
Once loaded, the reader is presented with a 3D model of the site and the option to switch a variety of reconstructions, models and contexts on and off. For this review, I will focus on how the model actually works, and will walk through the simplest reconstruction provided (Figure 4).
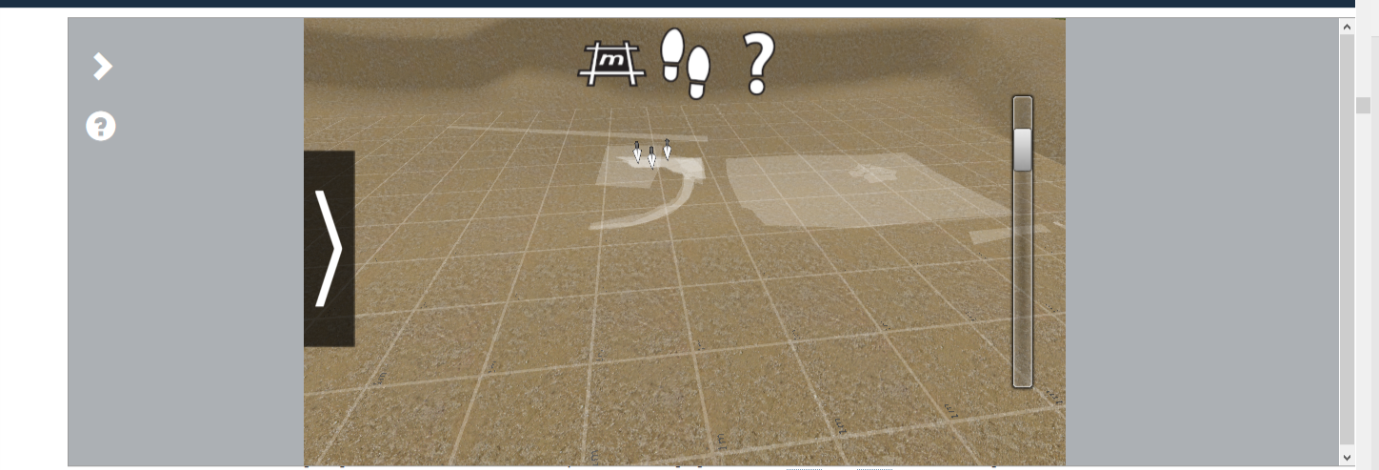
Clicking on one of the trowel icons will bring up the information for that context or stratigraphic unit.
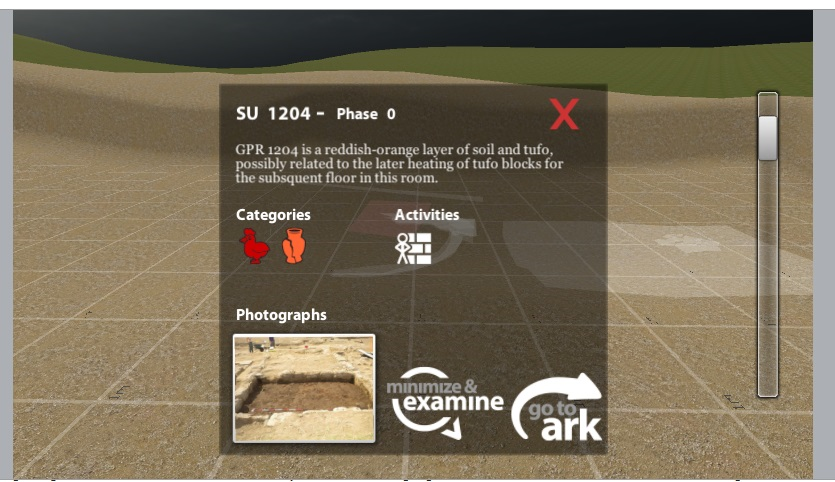
It is worth here describing the icons used in these pop-ups (these are explained in the Introduction to the publication). The authors describe the site in terms of categories of archaeological 'activities' and each of these is represented by a pictograph within the 3D model. Icons are also used within the 3D models to represent the type of archaeological evidence present. While the symbols chosen may appear abstract to some at first glance, anyone used to computer game icons will have no trouble quickly memorising their meaning. Hovering over an icon will also result in some descriptive text appearing as a pop up. The option to “go to ark” will take the reader to the project database record for that stratigraphic unit in a new window (Figure 6).
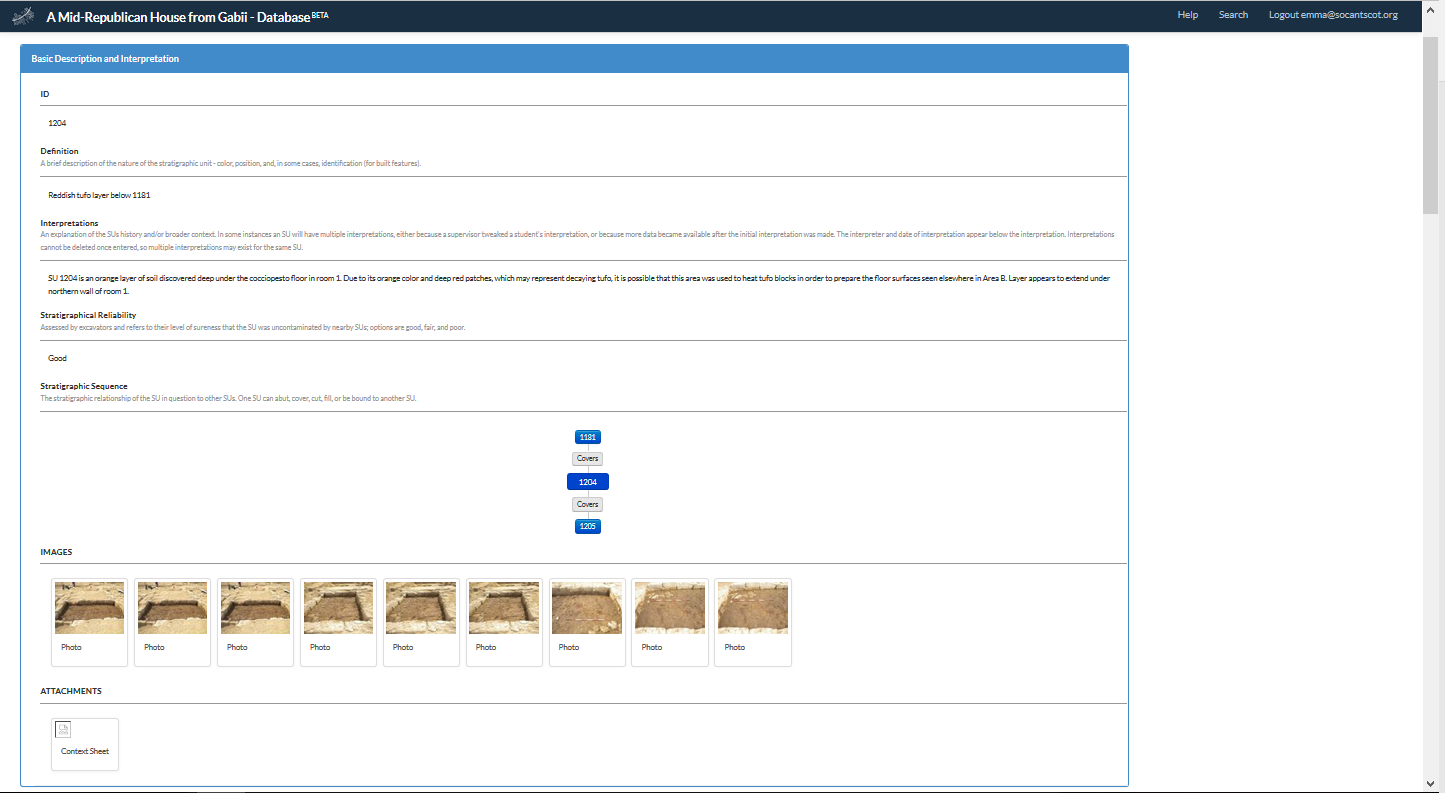
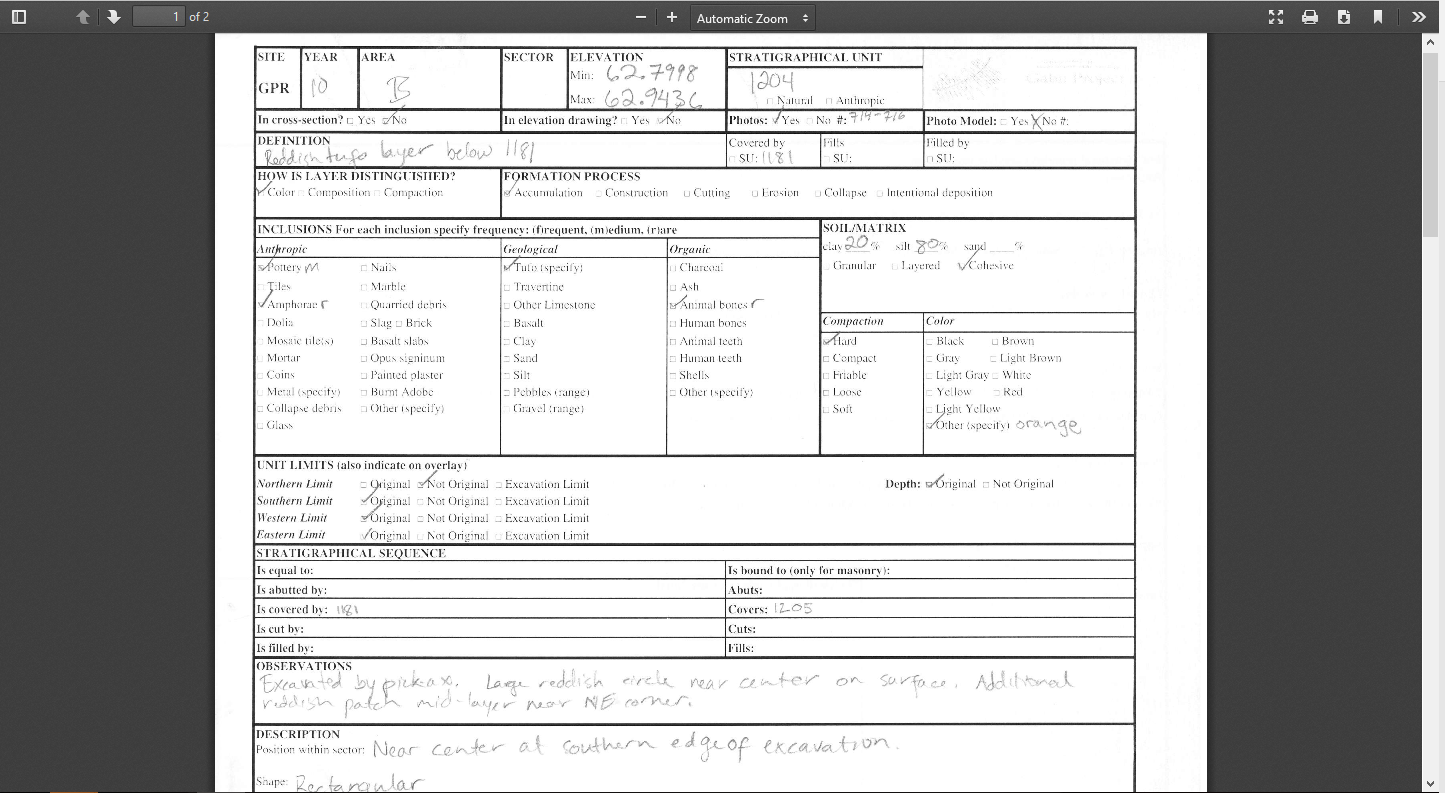
The stratigraphic unit records could be really useful to those interested in detailed aspects of the site, and often contain a good amount of photographs, interpretation and mini Harris Matrices. Other units shown in the matrices are clickable, and will take the reader to that record so there are plenty of opportunities to really drill down into the data. The option to download a TIF file of the original context card (Figure 7) for many of the records is welcome, enabling the actual data used by the authors to create the interpretation provided in the publication to be clear. I felt that this feature would make a useful teaching aid, showing excavators in training where the data they record can end up and how it can be used.
One of the aims of the authors is to "add an embodied layer of engagement with the 3D digital media to the analytical, abstracted one, primarily through the deliberate use of a first person navigation mode" (Opitz and Johnson 2016). If a more detailed 3D model is switched on (Figure 8), then the role of the footprint icon at the top of the model becomes apparent. This activates 'explore on foot' mode where the reader can use a combination of keys and the mouse to walk through the reconstruction as if playing a game. The mouse is used to turn and the keyboard used to 'walk' but they must be used together in order to successfully navigate. The trowel icons then act in the same way as in 'orbit view' offering pop-ups with more detailed information appear.
All of the four available 'reconstructions' appear in the same way, as black outlines. This is an elegant way of showing where walls are thought to have been and avoids going into debate about their possible height, material etc. This helps to focus the reader on the archaeology rather than the theory and practice of 3D reconstructions.
The navigation problems I encountered earlier become more of an issue as the reader progresses from the 'story' level to the 'more' and 'detailed' levels. For example, there appear to be no links within the text to go back through the levels in reverse order. However the 'details' level contains stratigraphic information as well as specialist reports, so there is a lot of information and plenty of archaeological gems to discover despite some navigation issues.
The specialist reports are not integrated with the main publication and are, as is commonly found in archaeological texts, at the 'end'. Here, though that means they are in the 'details' section, found either by scrolling down (some sections are very long) or via the navigation menu. To reach the specialist sections through the navigation menu, the reader must leave the main text and go to a Table of Contents which is itself lengthy and could, I felt, have been laid out in a clearer manner. An easier to access index or menu of the specialist reports, available without leaving the main text, would have helped.
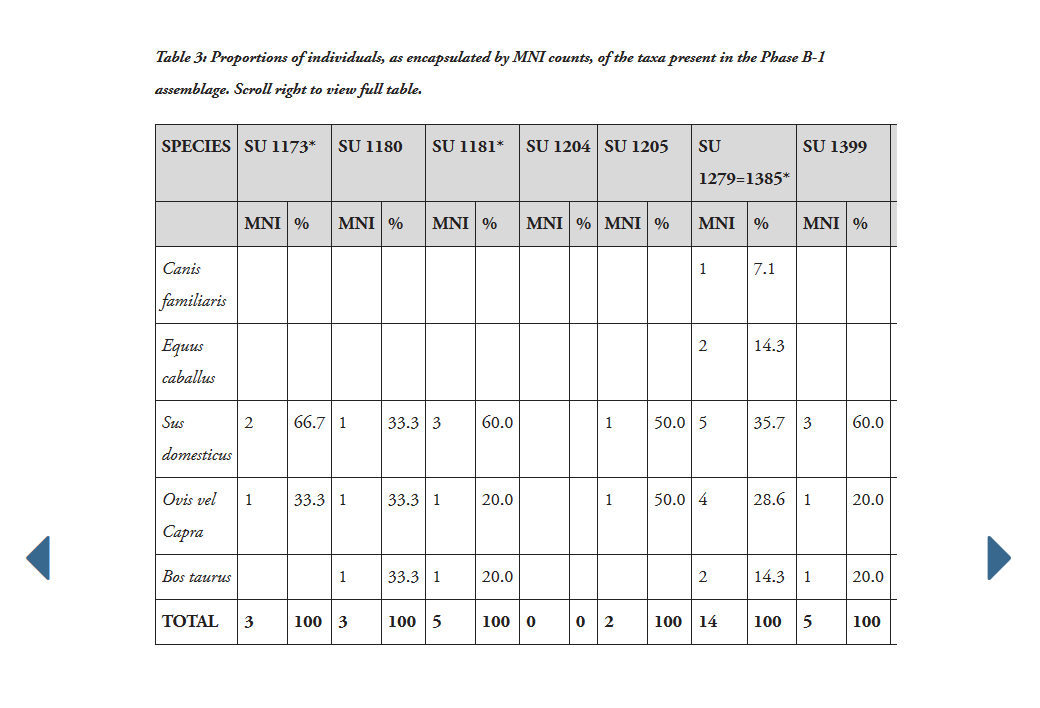
The specialist reports seem to have a variety of images, graphs and tables. However, none of these appear to be available as downloadable data. It seems like a missed opportunity to not have made them downloadable, especially given that the authors discuss the benefits of sharing finds data from the region more widely with international specialists in order to aid identification (finds not being a traditional strong point of research in the area). The layout of the text and tables also appears to be heavily browser dependent and so it is unfortunate that some readers may not see the entire data table. For example, the caption for Table 3 (Figure 9) suggested that the reader should "scroll right to view full table". But the only way to find this scrollbar is to go to the very bottom of the publication page and then use the scrollbar there, but by that time readers may have forgotten where the table was that they wanted to look at (Figure 10).
I also found it almost impossible to read the specialist reports with the 3D model switched on. Tables were especially hard to read as the model takes up just over half of the screen (Figure 11). None of the specialist tables contain hyperlinks to the stratigraphic units, finds or samples mentioned anyway and so it was easier to switch the model off to read them.
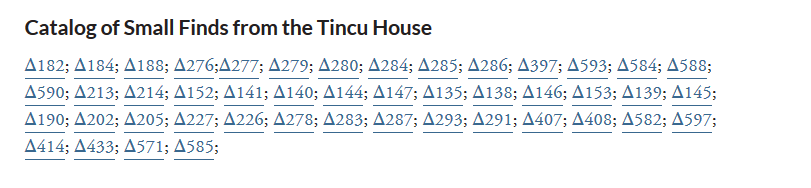
The 'Small Finds' section in the publication contains many links to the underlying project database, but these are often just numbers with no accompanying text (Figure 12). By clicking on a small find number, a new browser window is opened along with an excerpt from the project database. Some of the finds records I clicked on at random (e.g. SF182) did not contain context information or links to anything else in the database, so it was difficult to understand how they fitted into the archaeology or why they were singled out for inclusion in the catalogue, but the majority of the records I viewed did contain at least one image of the find as well as links to further stratigraphic information.
In the 'story' section there are no images. The 'more' section has five. The 'details' section contains no photographs of the site under excavation. Although there are hundreds, if not thousands, of images in the underlying project database accessible through the stratigraphic unit records, it would have added such a richness to the interpretation and story of the site if a few more images had been included throughout the text. Although the 3D model gave a feel for specific phases as imagined by the authors, more photographs of the site under excavation and images of some of the finds would have aided my overall immersion in the site 'story'.
More thought could have been given to the placement and size of the images of some of the small finds, in particular coins. As Figure 13 shows, with the 3D model switched on, I found the image of the coin so large that it could not be seen. In addition, the scales used kept changing and they did not display the measurement unit (assumed to be cms).

From an archaeological point of view, this publication is interesting to read and well written, but it is at times deeply frustrating to navigate. It may have been better to have had more pages rather than trying to have the entire publication on one page. At the very least a page for each level of text would have improved navigation and made for a more enjoyable read. Although there is an 'accessibility mode' that allows the 3D model to be switched off for less powerful computers or to simply see full size images or tables, this means readers switch off one of the main ways to navigate the archaeology. Given that the premise is for the 3D model to provide the starting point for the archaeological exploration, this is lost and there is no clear alternative focus.
It is helpful that the specialist reports were included in the main text, but navigating them was tricky at times. Making the data available to download and therefore be able to be used by others, especially for comparing similar sites, would have improved them further. Providing links to the underlying project database is a valuable feature and research tool and helps to give a deeper understanding of the site and the interpretation of the authors. This approach has been shown to work well for other archaeological sites e.g. Silchester (Clarke et al. 2007 where readers can 'drill down' from the article to the underlying data), Castleporziano (Rendell and Claridge 2010; Claridge and Rendell 2013 data paper with project database available through the Archaeology Data Service) and the project at the Anglo Saxon site of Lyminge (where readers can view a read-only project database by using a guest log in on the website). Perhaps most importantly, making the excavation data available in this way allows re-interpretation in the future, not just of the archaeological story of the site, but also of the 3D model - the star of the show – as new ideas and techniques become available.
The authors of the publication are to be admired for thinking of a creative way to engage readers with what is basically an excavation report, but perhaps some of time spent creating the innovative (and admittedly excellent when it works) 3D model could have been spent on the layout and navigation of the more traditional aspects of the text. A Mid-Republican House From Gabii is a good read and the problems some may have in accessing the 3D model and underlying data should not detract from the exciting archaeology it discusses.
Claridge, A. and Rendell, H. 2013 'The Evolution of Rome's Maritime Façade: archaeology and geomorphology at Castelporziano (Data Paper)', Internet Archaeology 35. https://doi.org/10.11141/ia.35.11
Clarke, A., Fulford, M.G., Rains, M. and Tootell, K. 2007 'Silchester Roman Town Insula IX: The Development of an Urban Property c. AD 40-50 - c. AD 250', Internet Archaeology 21. https://doi.org/10.11141/ia.21.4
Opitz, R.S. and Johnson, T.D. 2016 'Interpretation at the Controller's Edge: Designing Graphical User Interfaces for the Digital Publication of the Excavations at Gabii (Italy)' Open Archaeology 1, 274–290 https://doi.org/10.1515/opar-2015-0017
Rendell, H. and Claridge, A. 2010 The evolution of Rome's maritime facade: archaeology and geomorphology at Castelporziano [data-set]. York: Archaeology Data Service [distributor] https://doi.org/10.5284/1000127
Internet Archaeology content is preserved for the long term with the Archaeology Data Service. Help sustain and support open access publication by donating to our Open Access Archaeology Fund.
Internet Archaeology is an open access journal based in the Department of Archaeology, University of York. Except where otherwise noted, content from this work may be used under the terms of the Creative Commons Attribution 3.0 (CC BY) Unported licence, which permits unrestricted use, distribution, and reproduction in any medium, provided that attribution to the author(s), the title of the work, the Internet Archaeology journal and the relevant URL/DOI are given.
Terms and Conditions | Legal Statements | Privacy Policy | Cookies Policy | Citing Internet Archaeology
Internet Archaeology content is preserved for the long term with the Archaeology Data Service. Help sustain and support open access publication by donating to our Open Access Archaeology Fund.