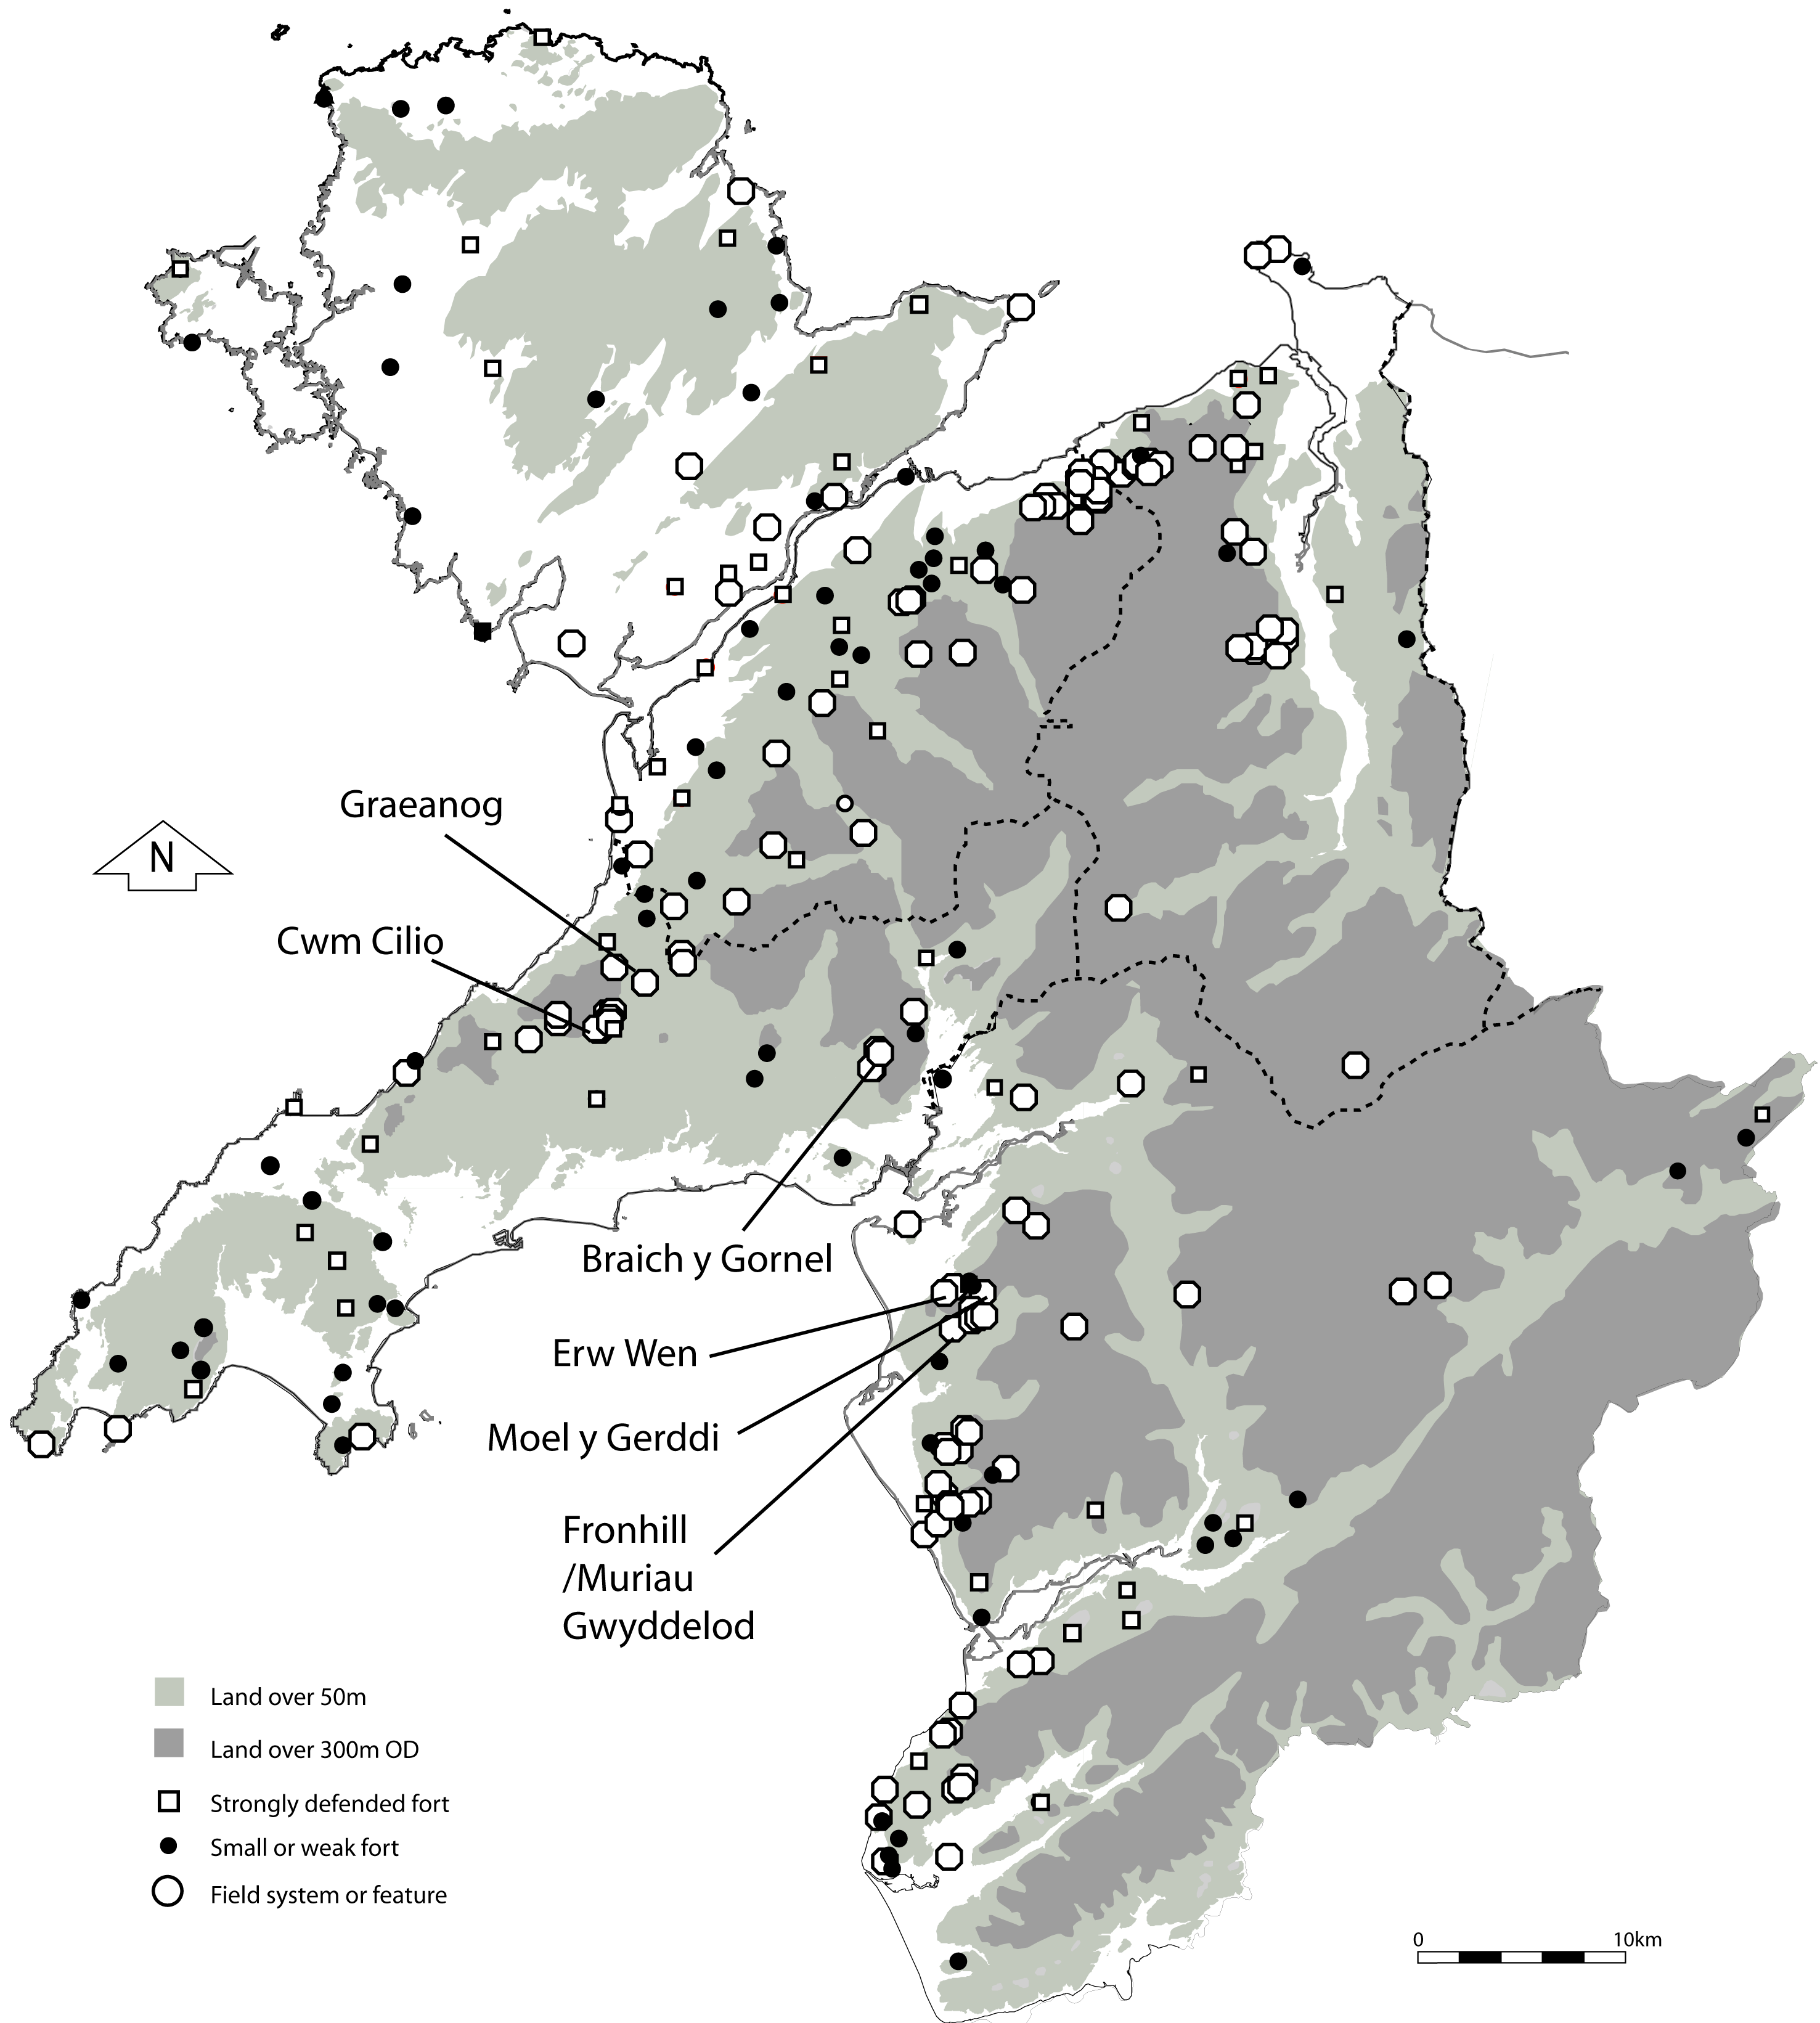
Figure 1: The distribution of recorded early fields or field systems in relation to major strongly defended sites and other, smaller, defended sites in north-west Wales
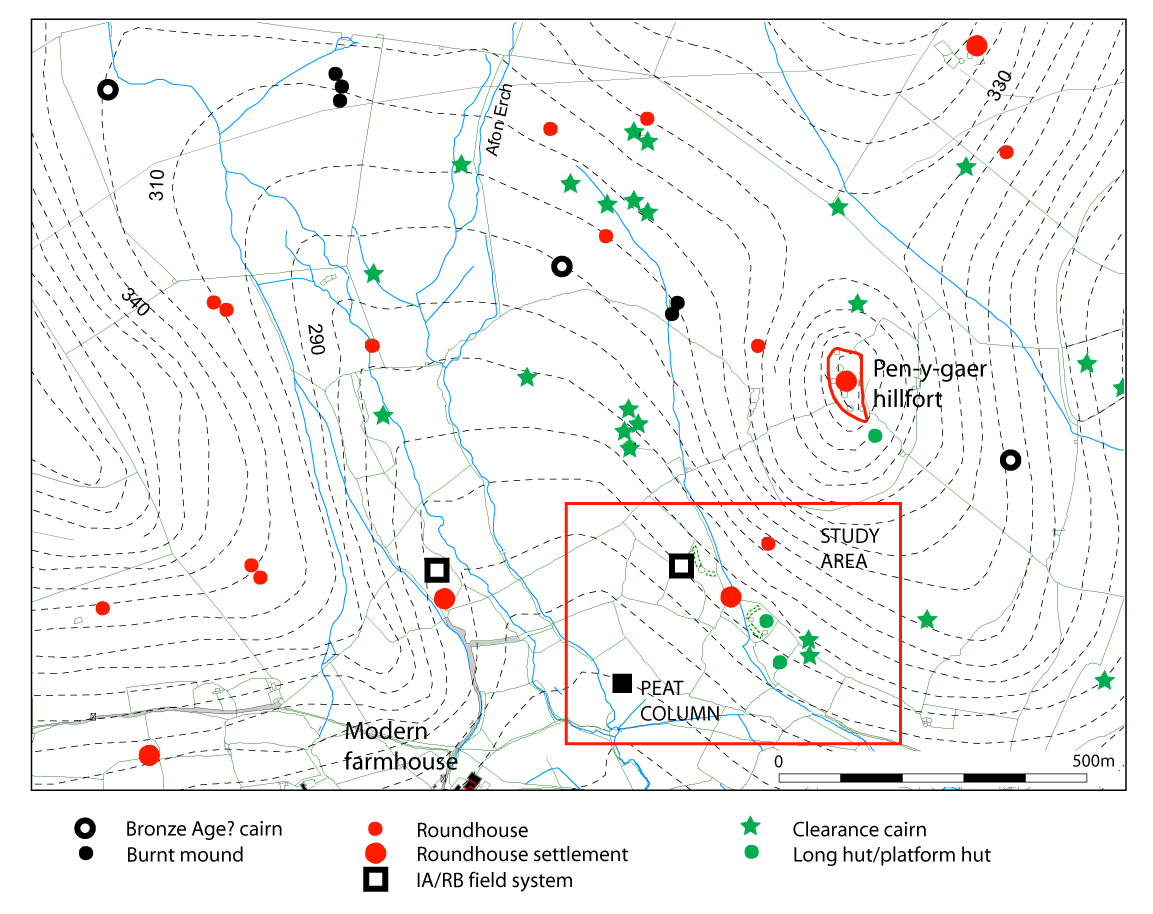
Figure 2: Cwm Cilio. Location of the study area and of peat sampling (Based on Ordnance Survey maps. © Crown copyright. All rights reserved. License number AL 100020895).
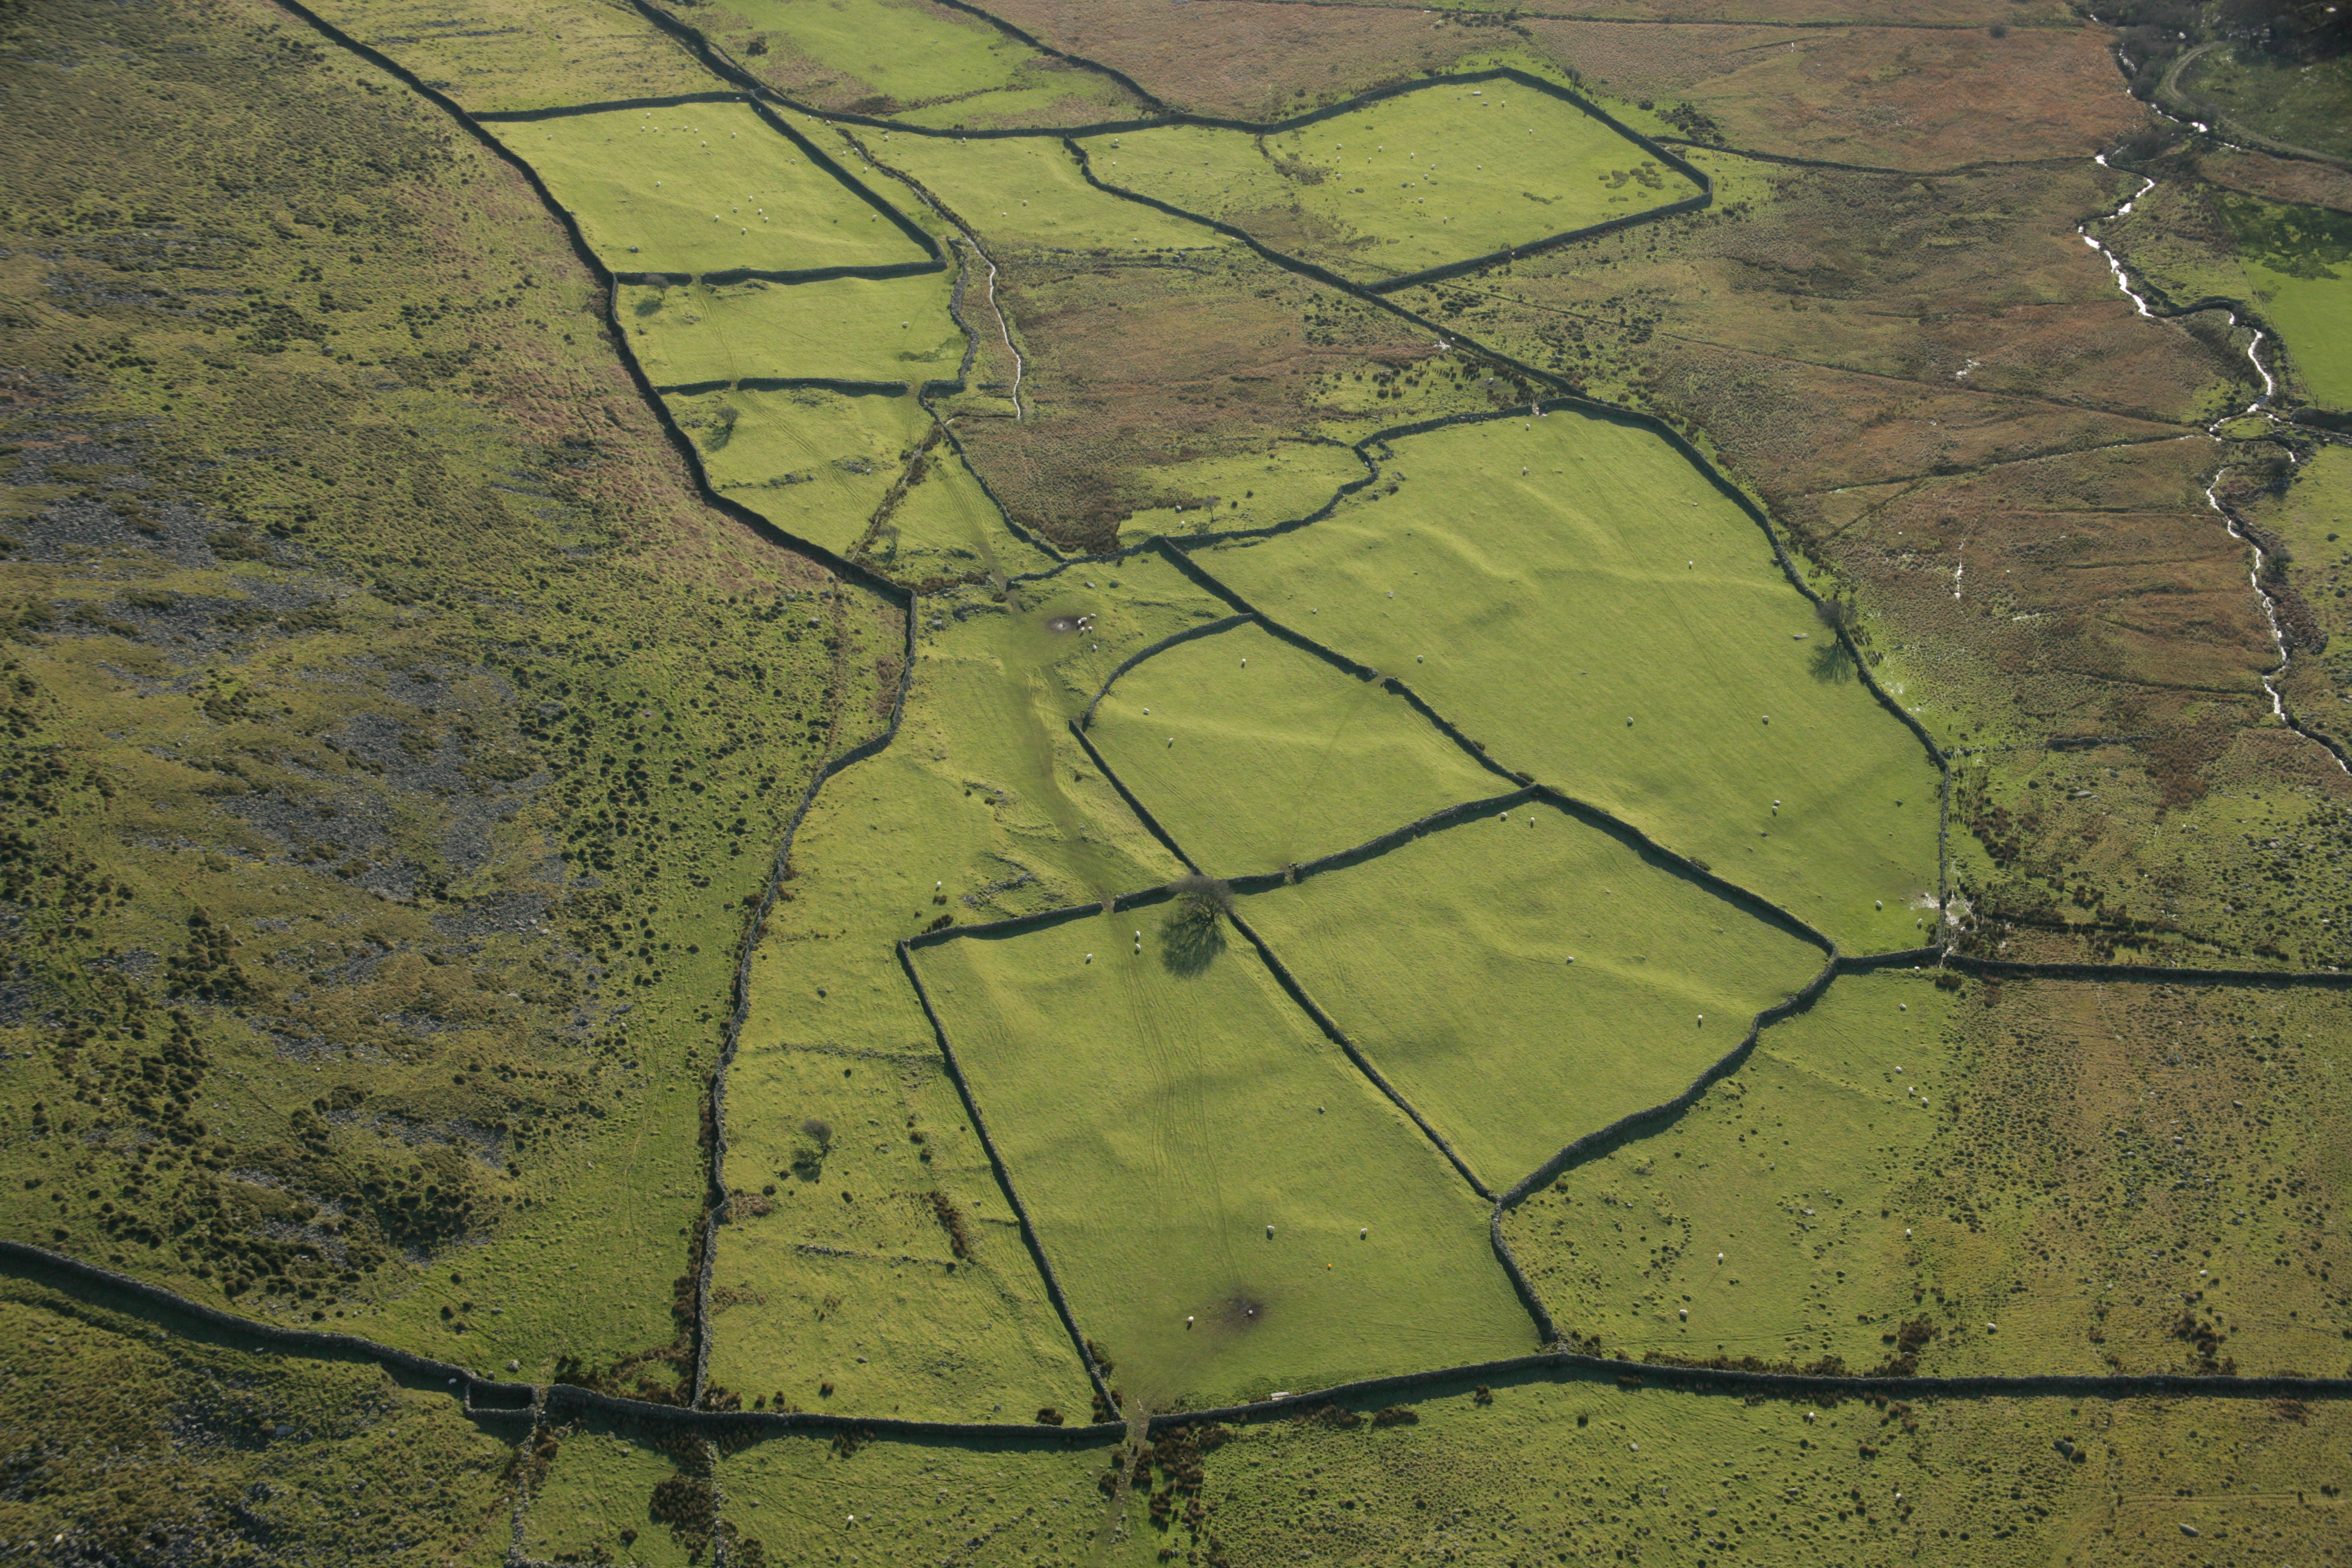
Figure 3: Cwm Cilio. Field system from the north-west (Photograph by Toby Driver. Copyright RCAHMW)
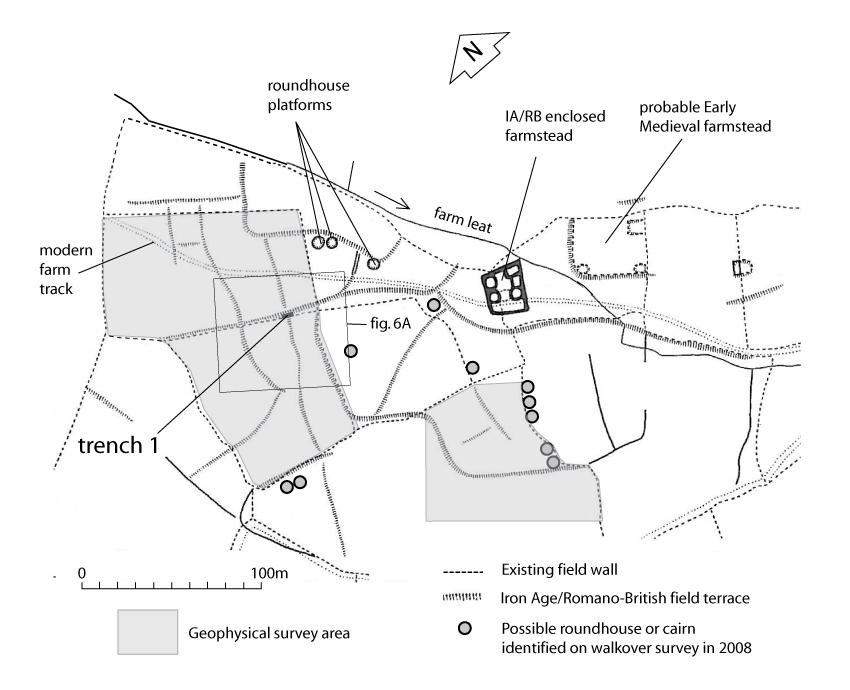
Figure 4: Cwm Cilio. Plan of the field system and associated features based on survey by the RCAHMW (1960), showing the location of the excavation (Trench 1, Figure 6A), outline of the geophysical survey areas, and of possible new features identified from walkover survey by GAT in 2008
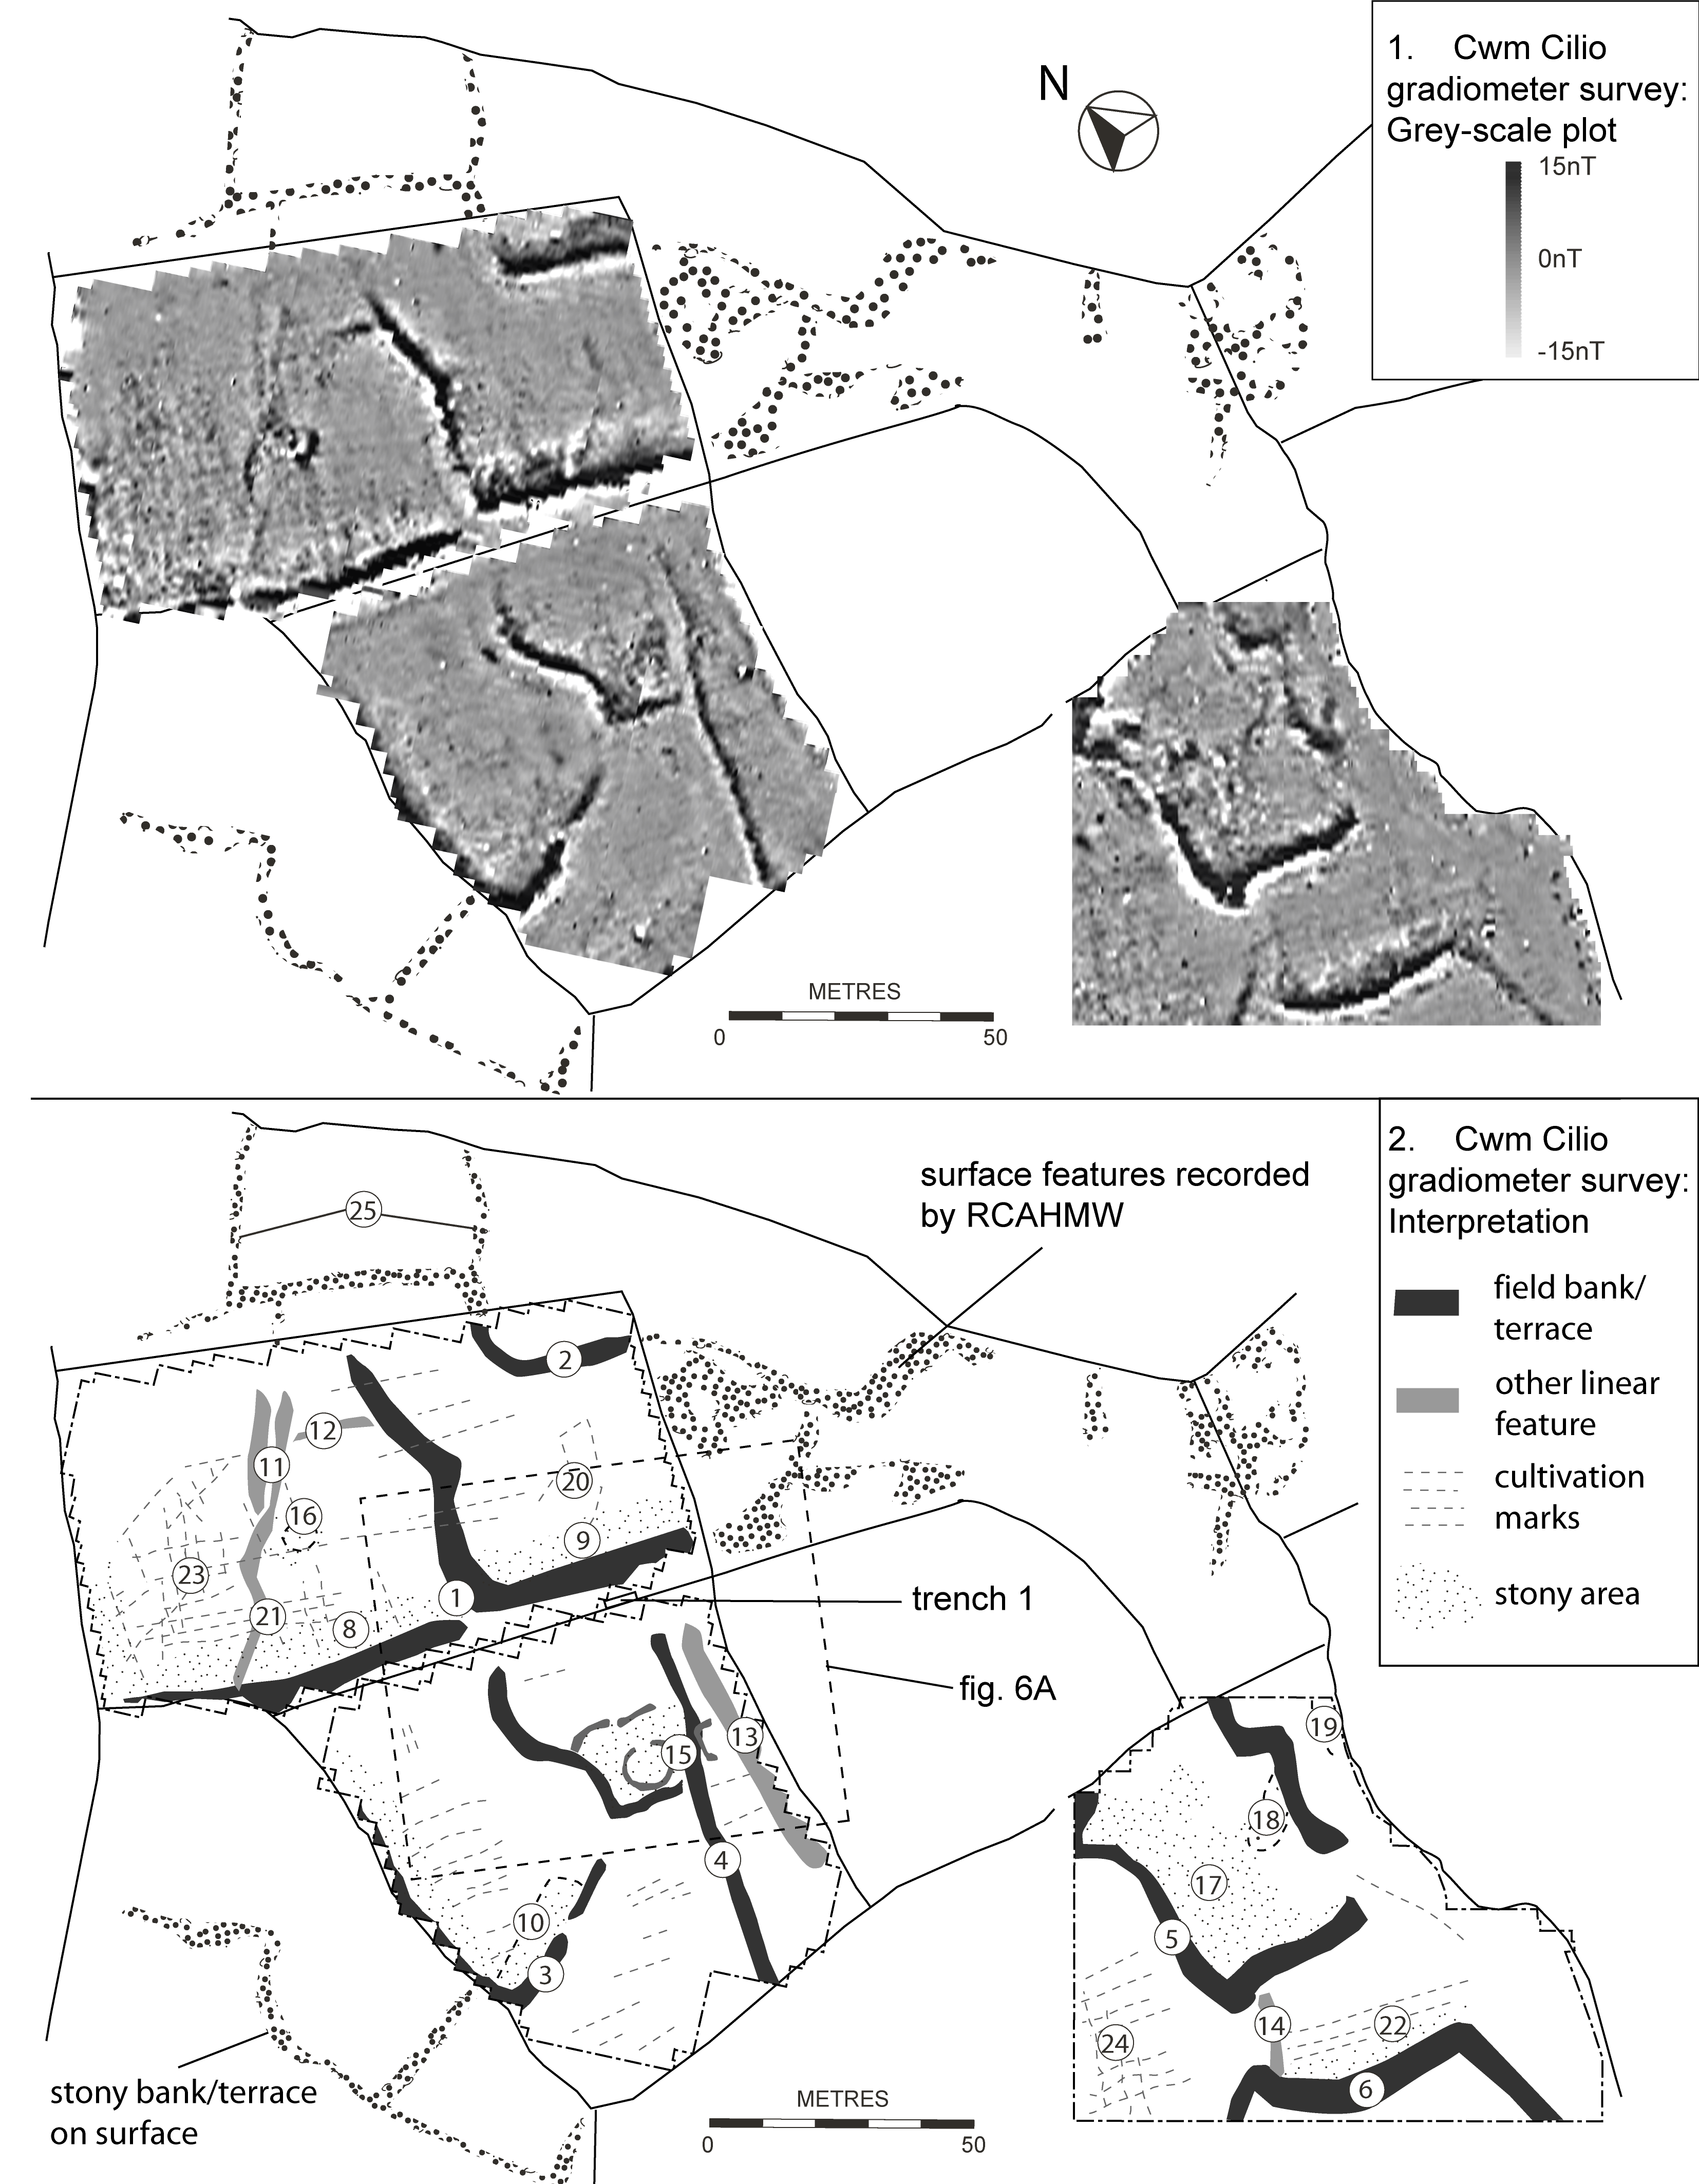
Figure 5: Cwm Cilio. Gradiometer survey – Grey-scale plot and interpretation
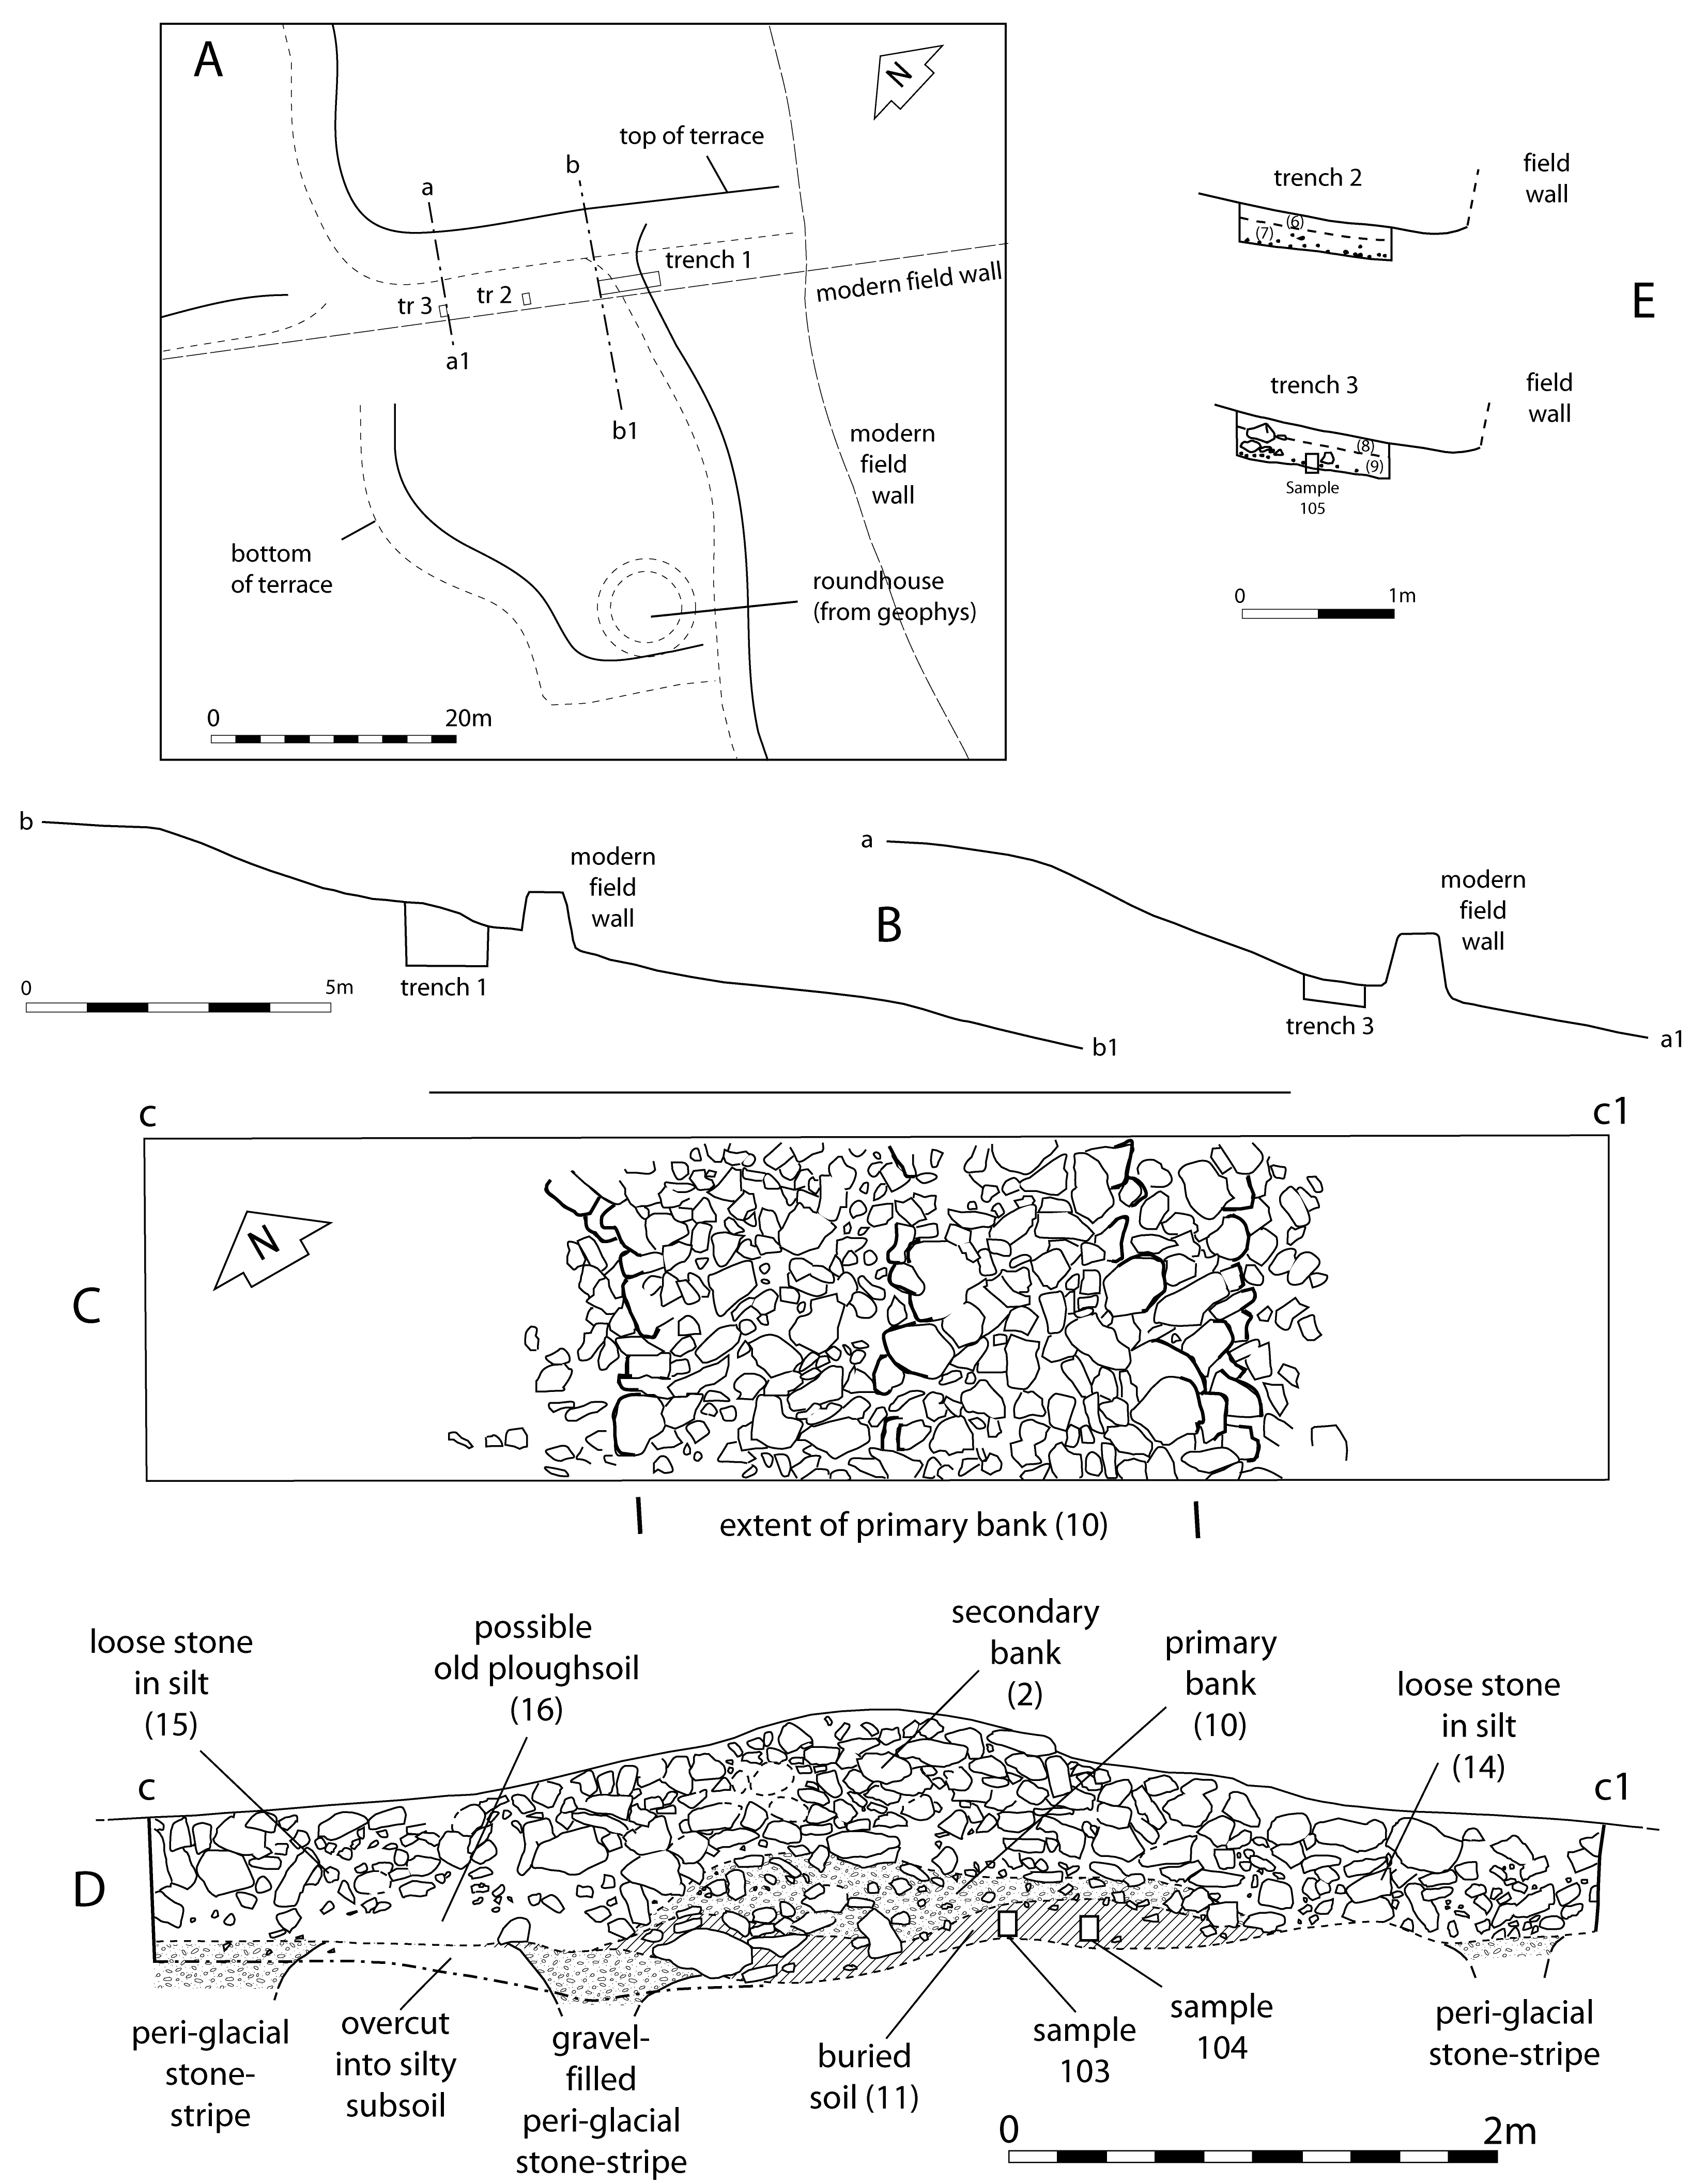
Figure 6: Cwm Cilio. A, Location of Trenches 1–5 in relation to the early boundaries; B, Profiles of the early field terrace in relation to the trenches; C, Trench 1. Plan of core bank after removal of the overlying rubble spread; D, Trench 1. South-west-facing section; E, North-west-facing sections of soil test Trenches 2 and 3
Figure 7: Soil micromorphology
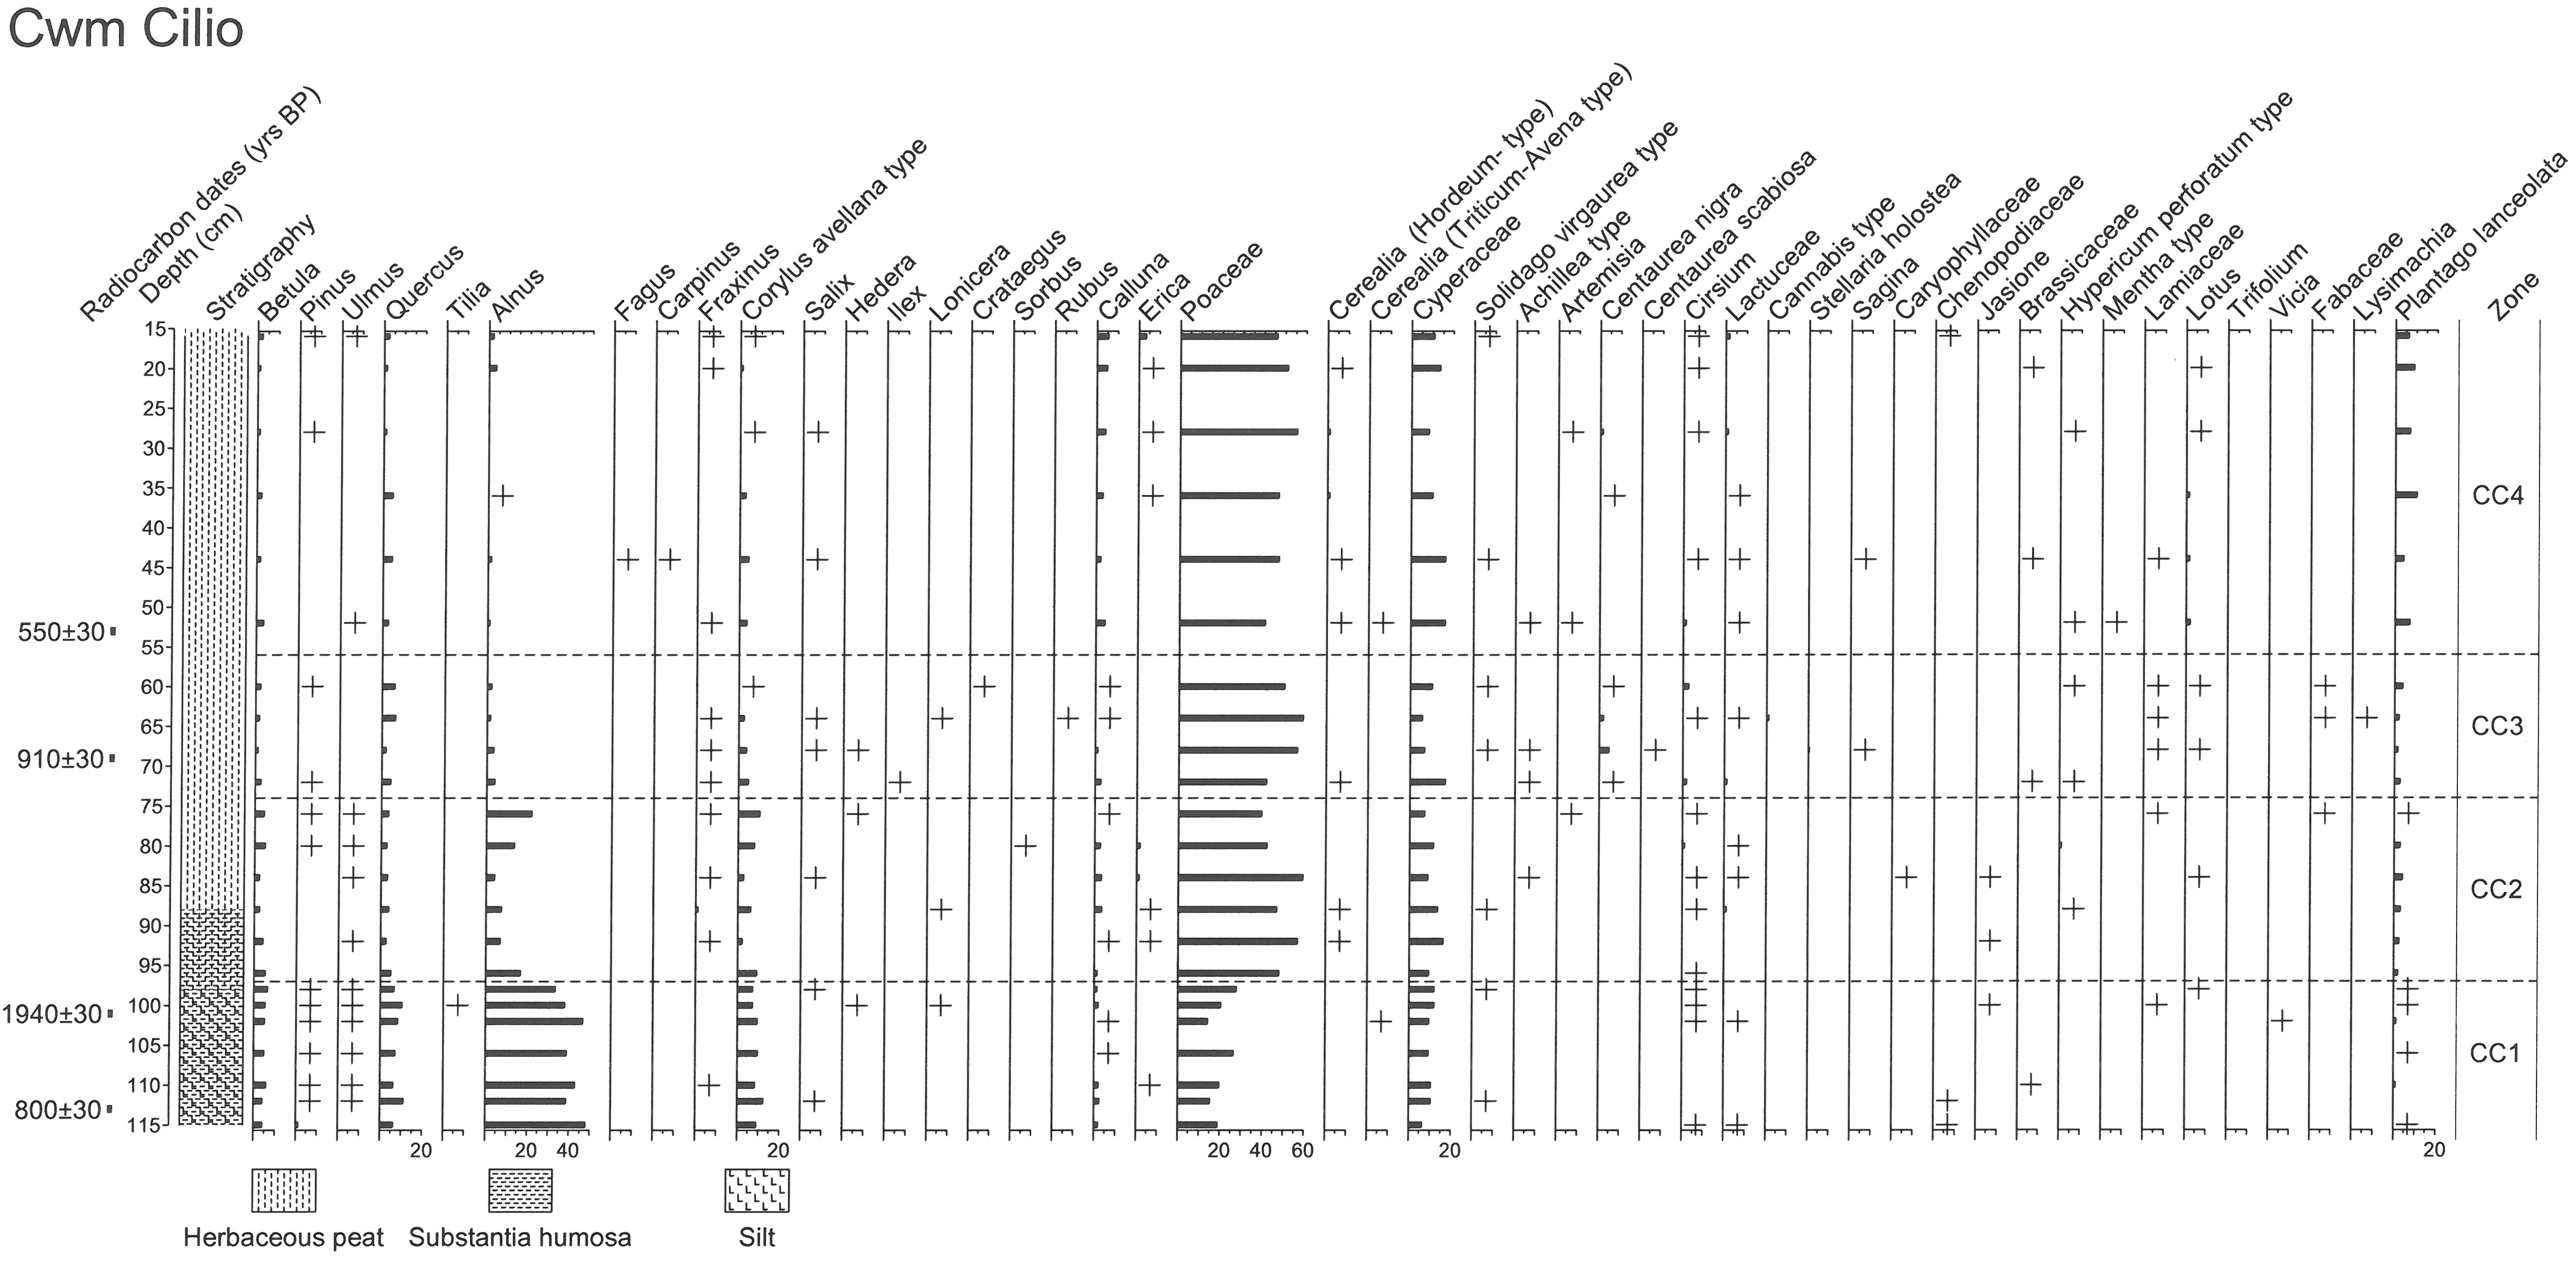
Figure 8a: Cwm Cilio. Percentage pollen diagram set 1
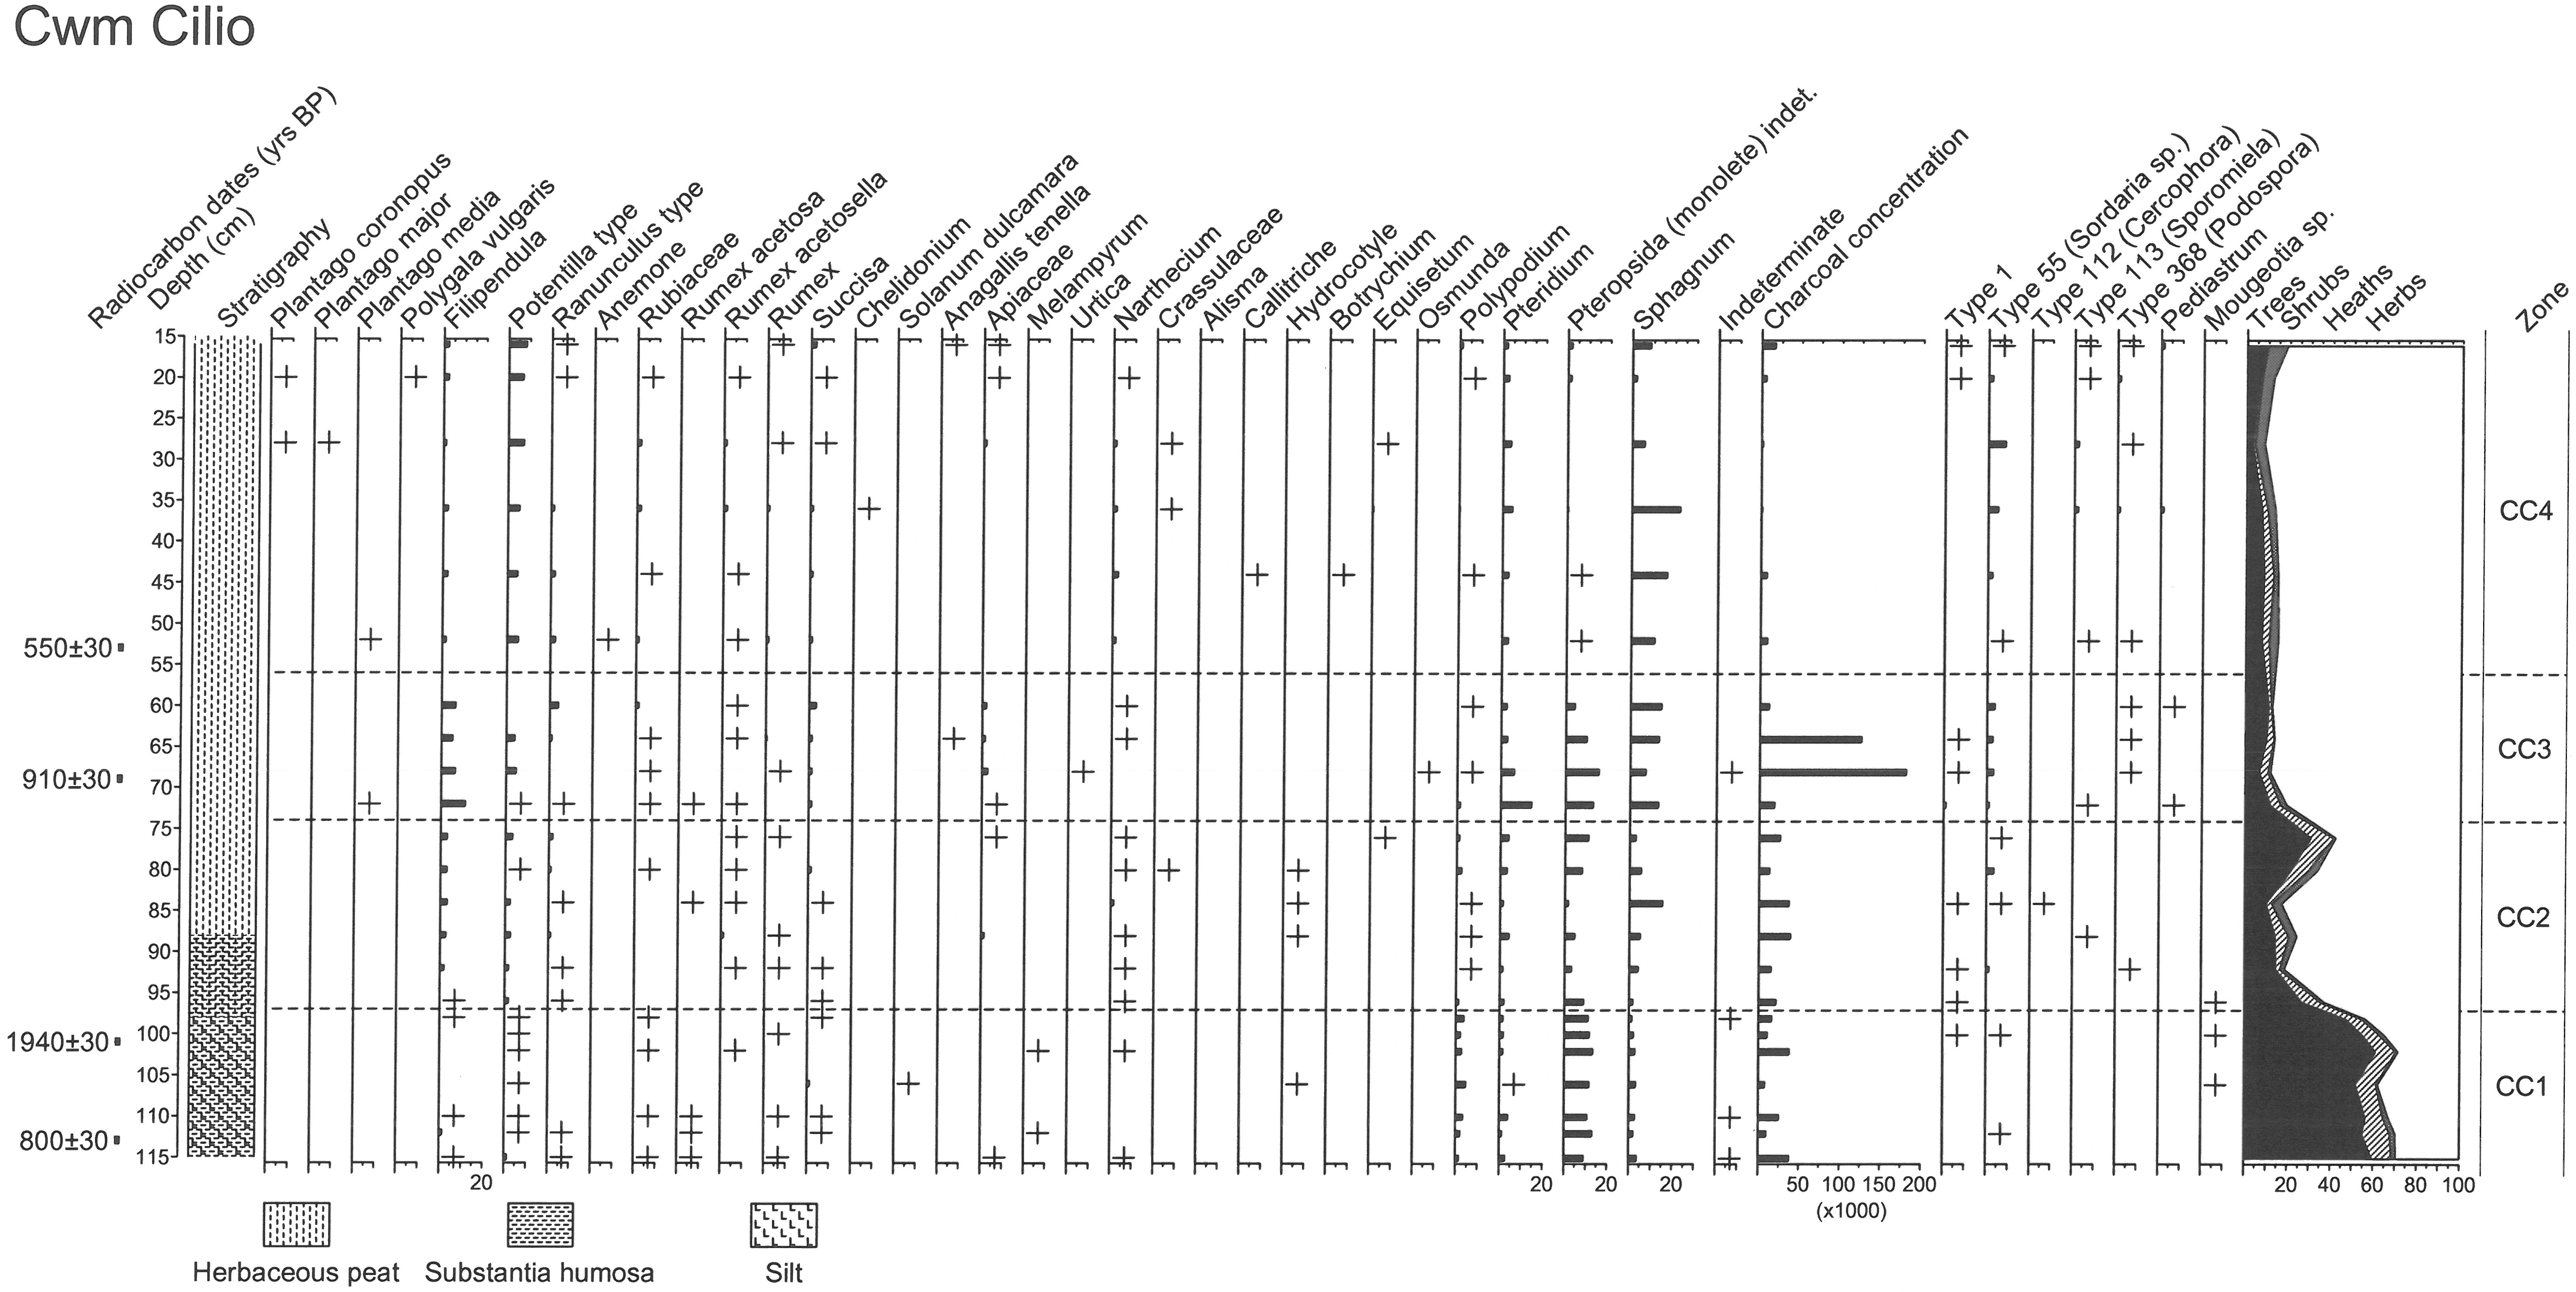
Figure 8b: Cwm Cilio. Percentage pollen diagram set 2
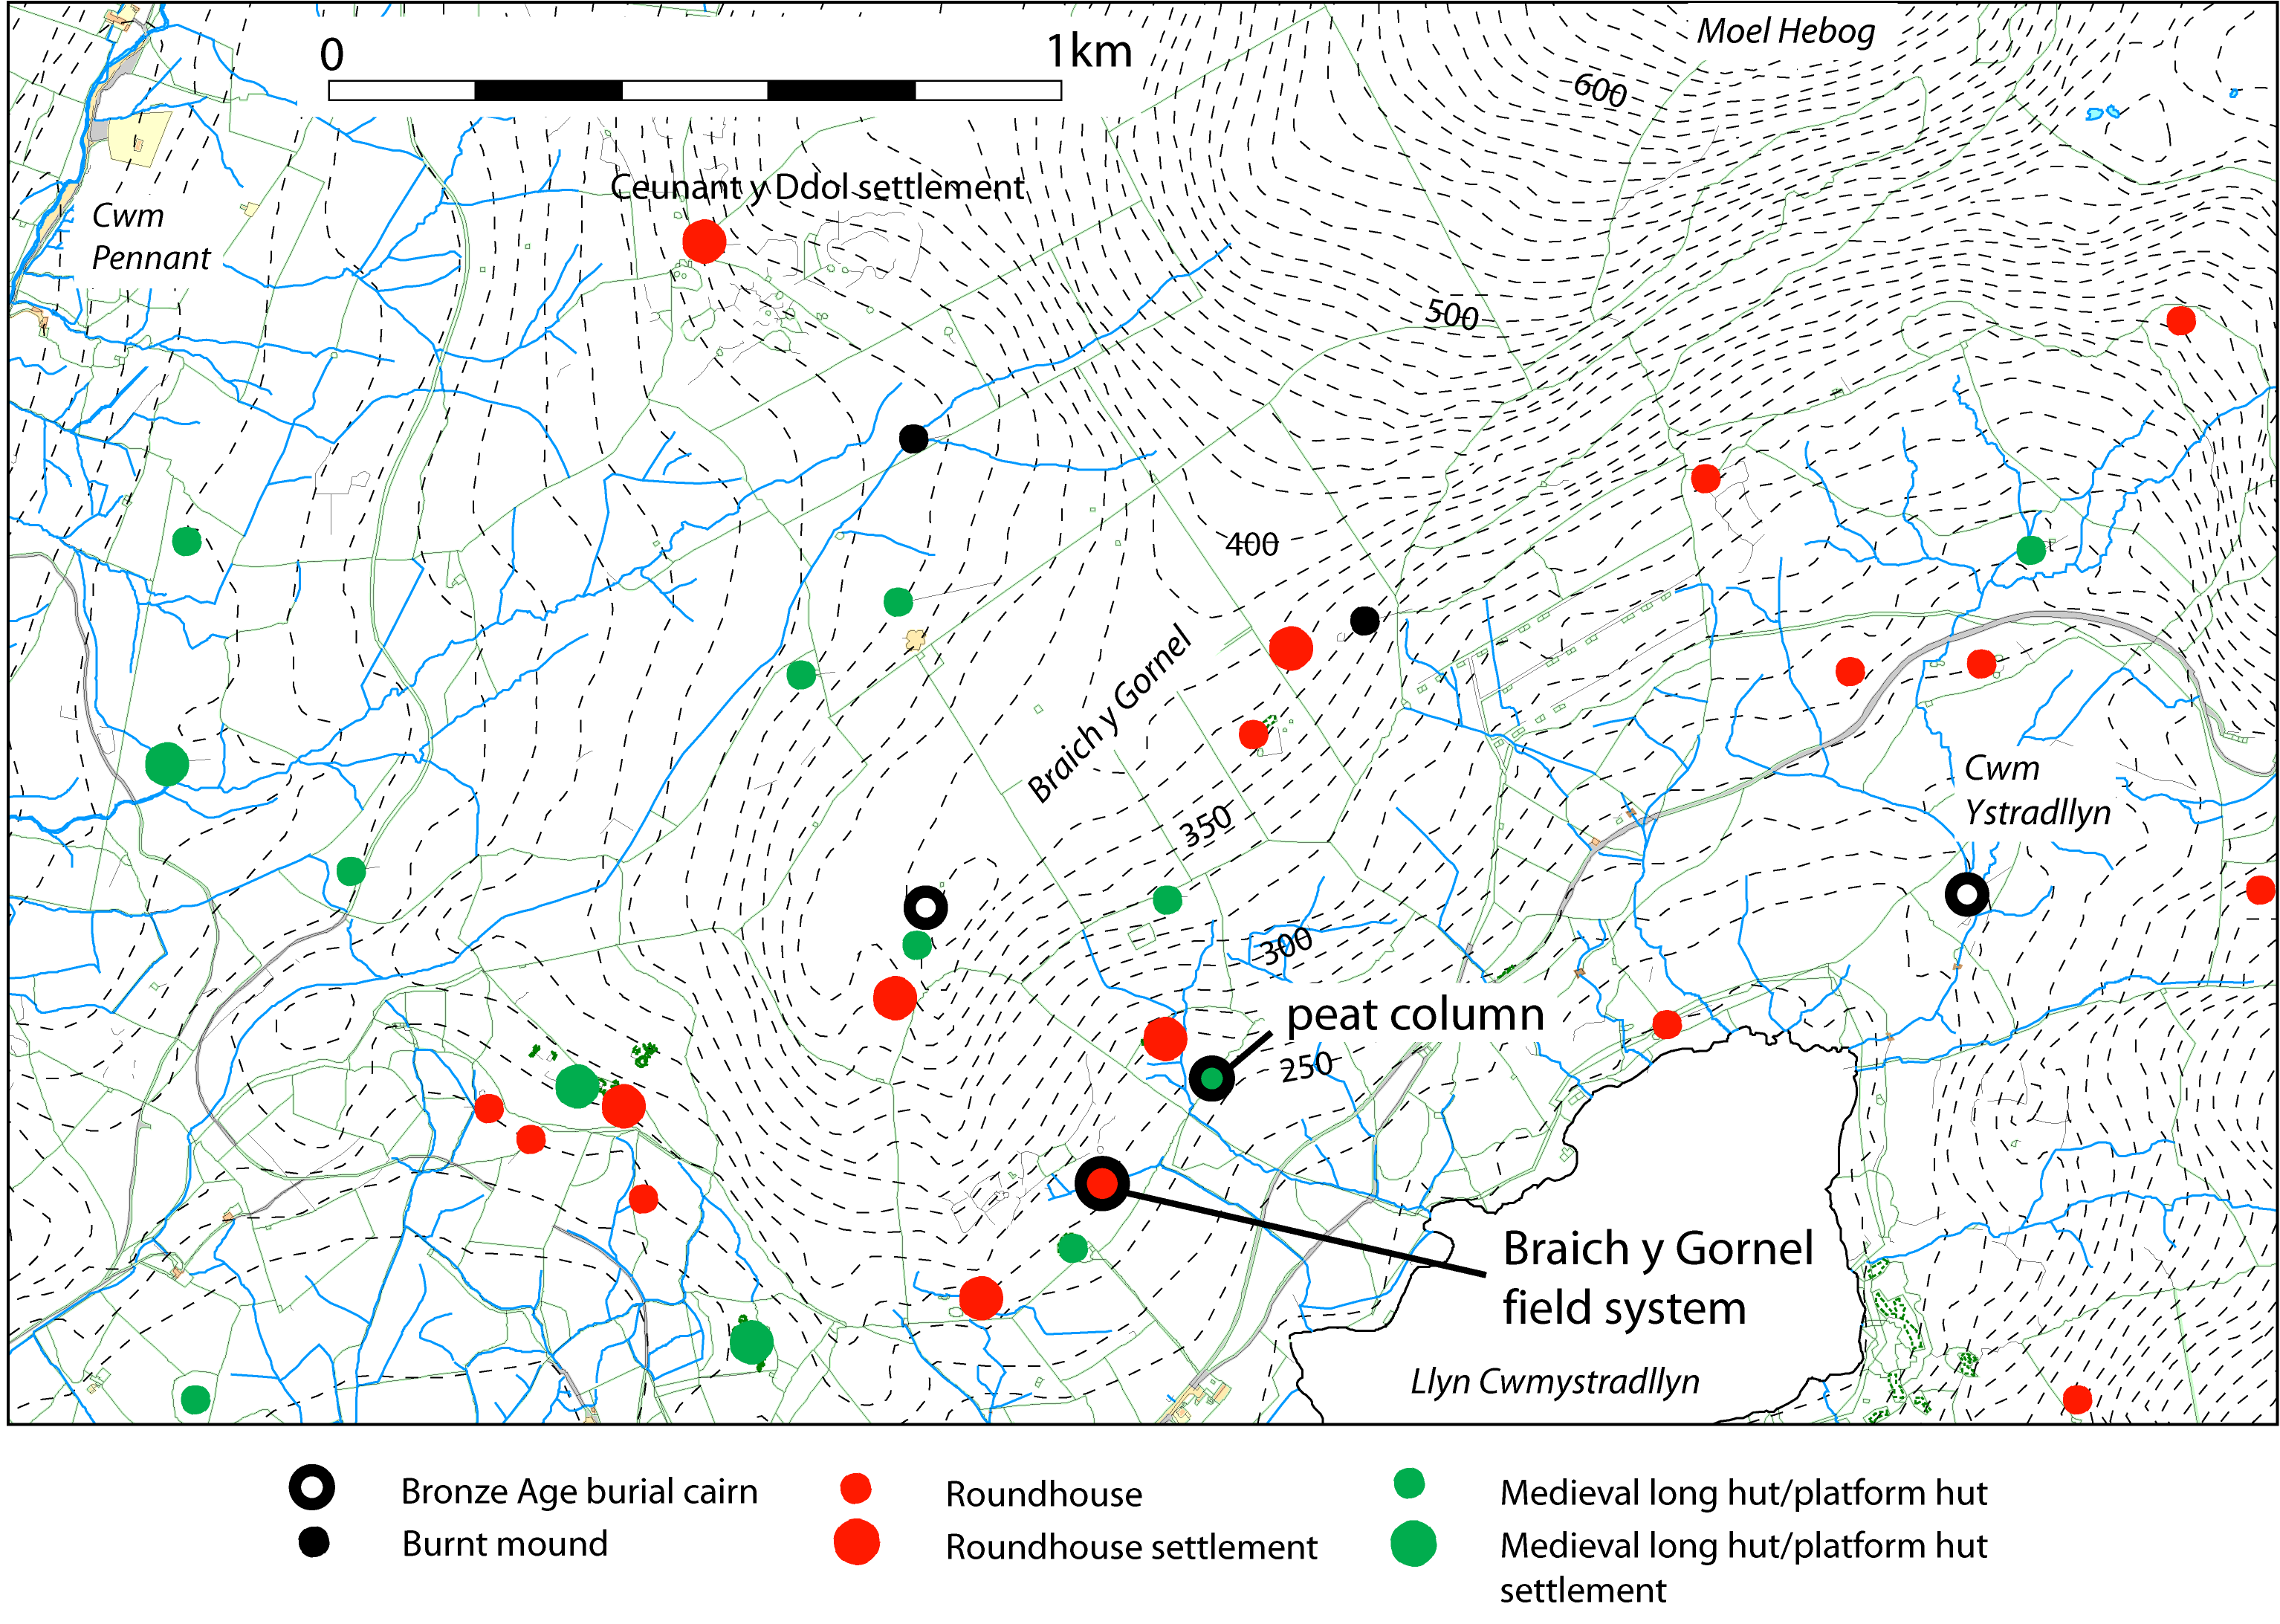
Figure 9: Braich y Gornel. Location map. Contours metres OD (Based on Ordnance Survey maps. © Crown copyright. All rights reserved. License number AL 100020895)
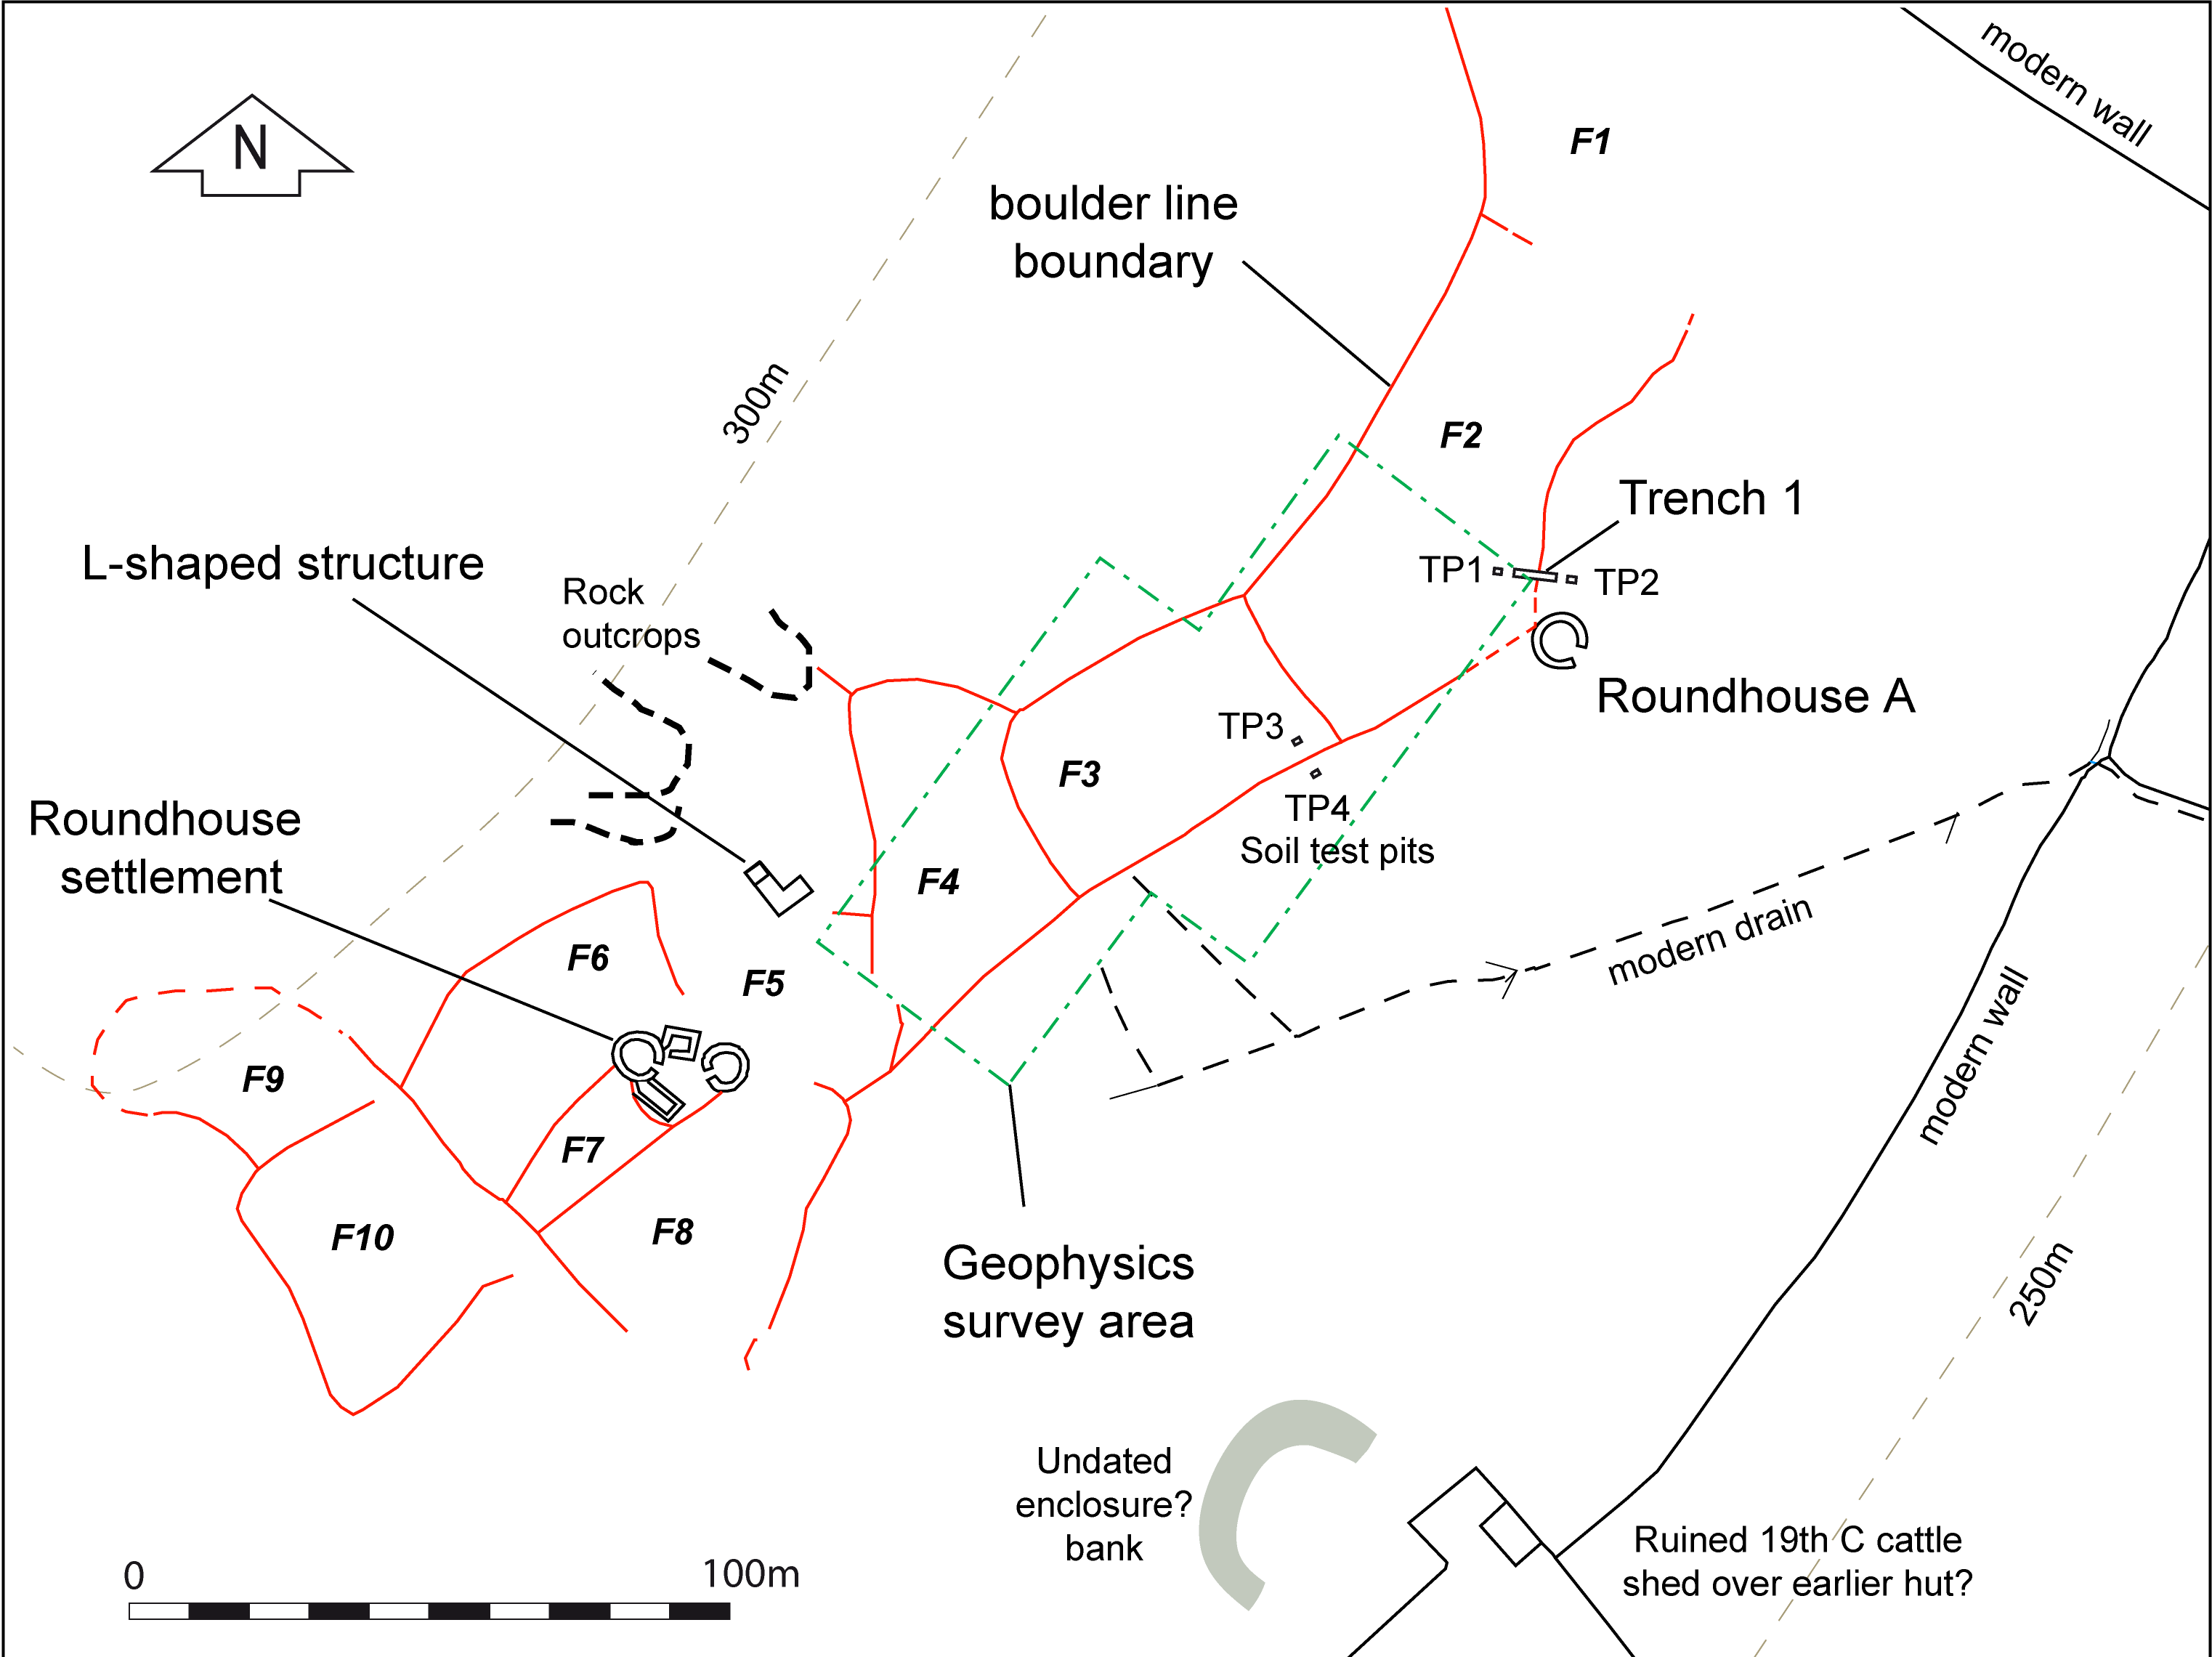
Figure 10: Braich y Gornel. Plan of field system, from RCAHMW survey (1960) showing the location of the geophysical survey and of the excavated trenches. Contours metres OD (Based on Ordnance Survey maps. © Crown copyright. All rights reserved. License number AL 100020895)
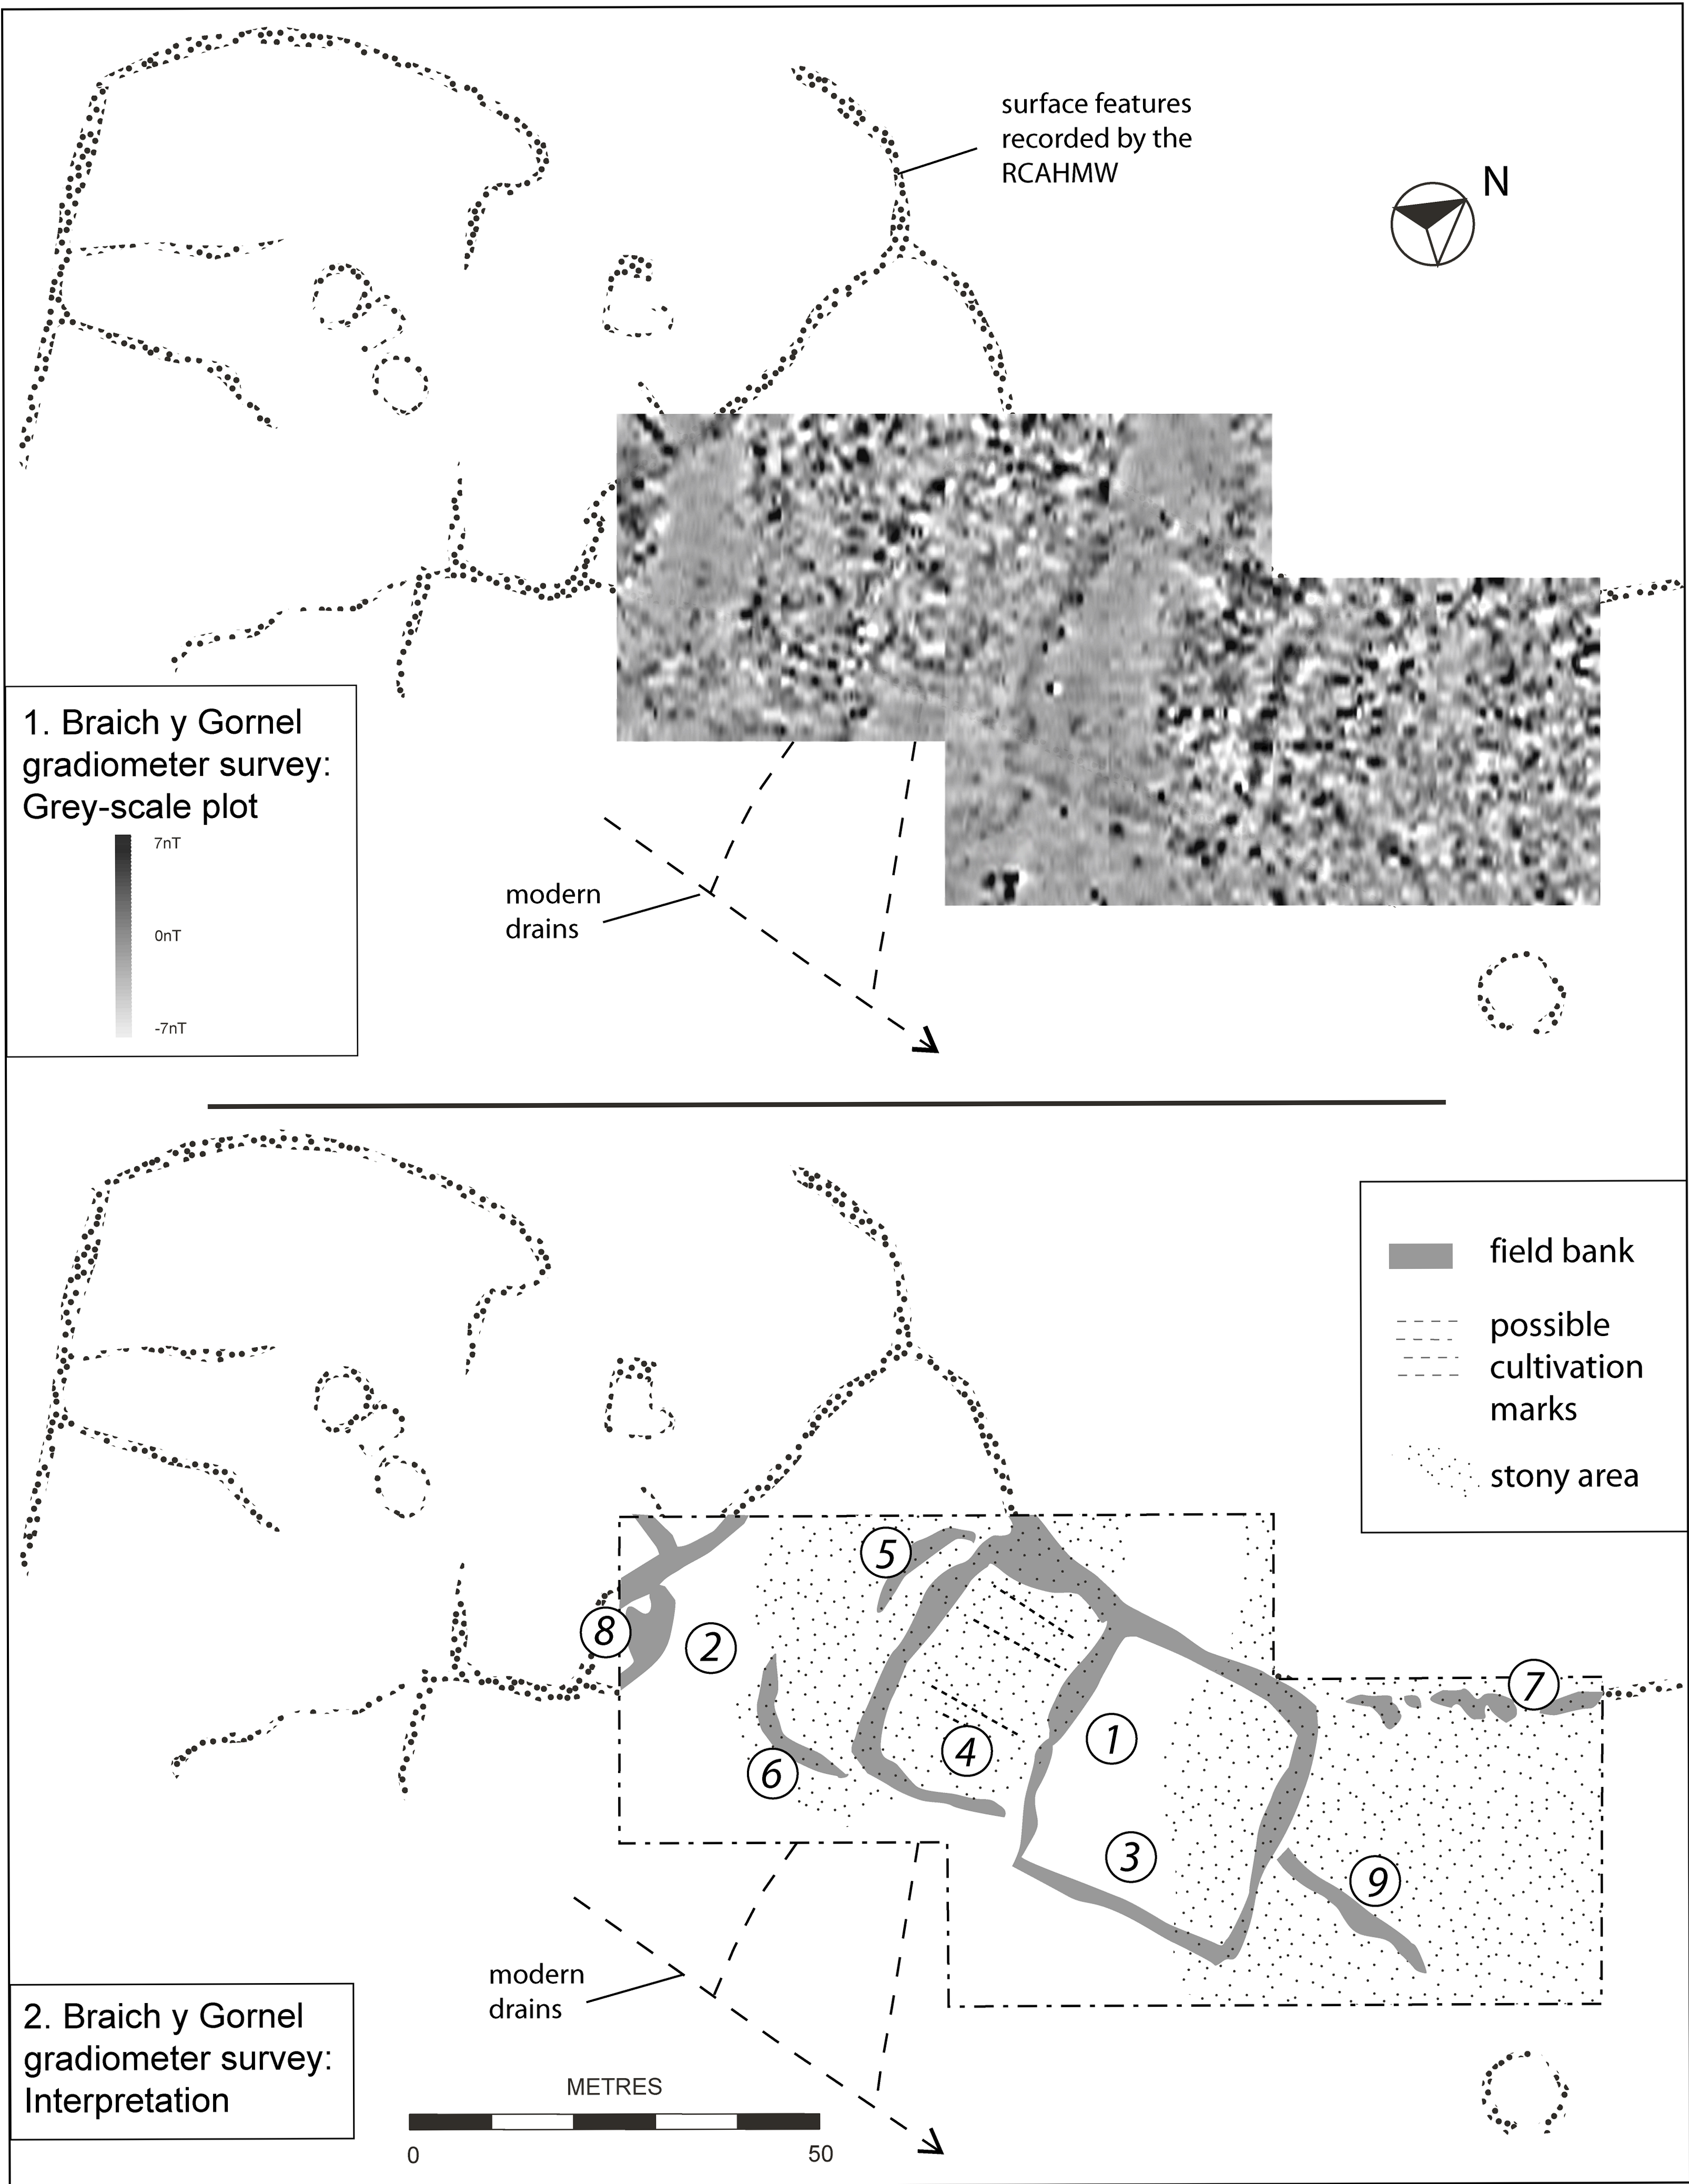
Figure 11: Braich y Gornel. Gradiometer survey. Grey-scale plot and interpretation
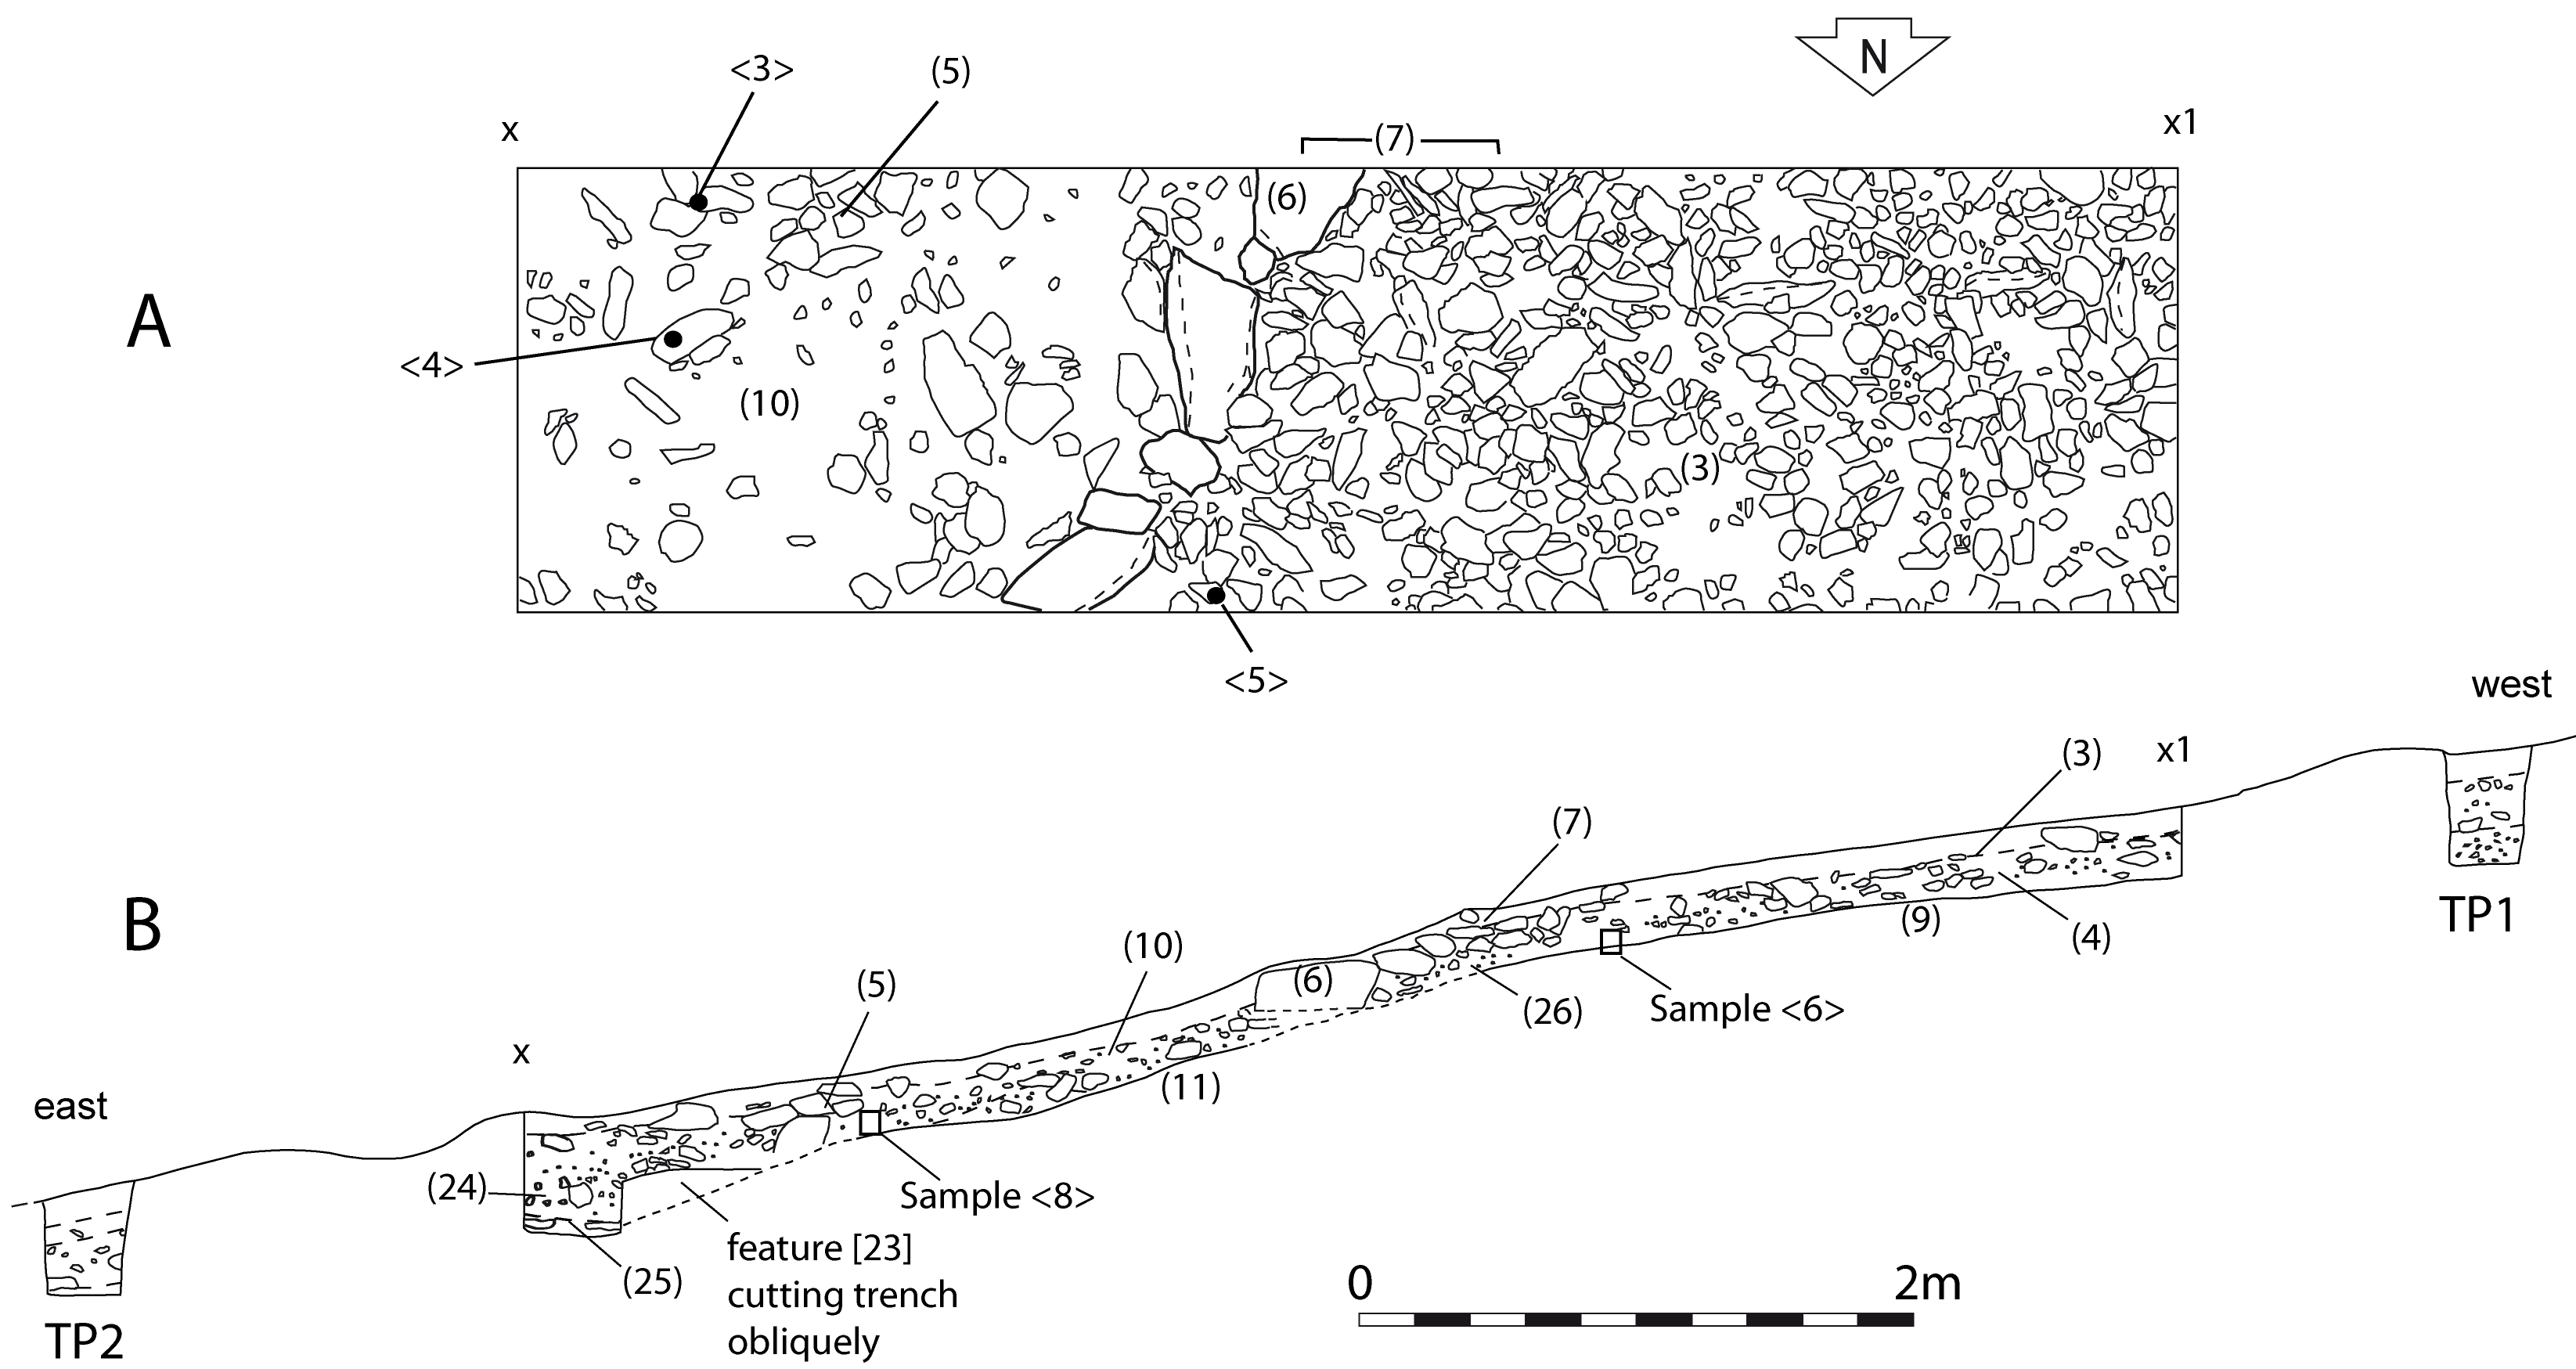
Figure 12: Braich y Gornel. A, Plan after removal of topsoil; B, North-facing section of trench and soil test pits
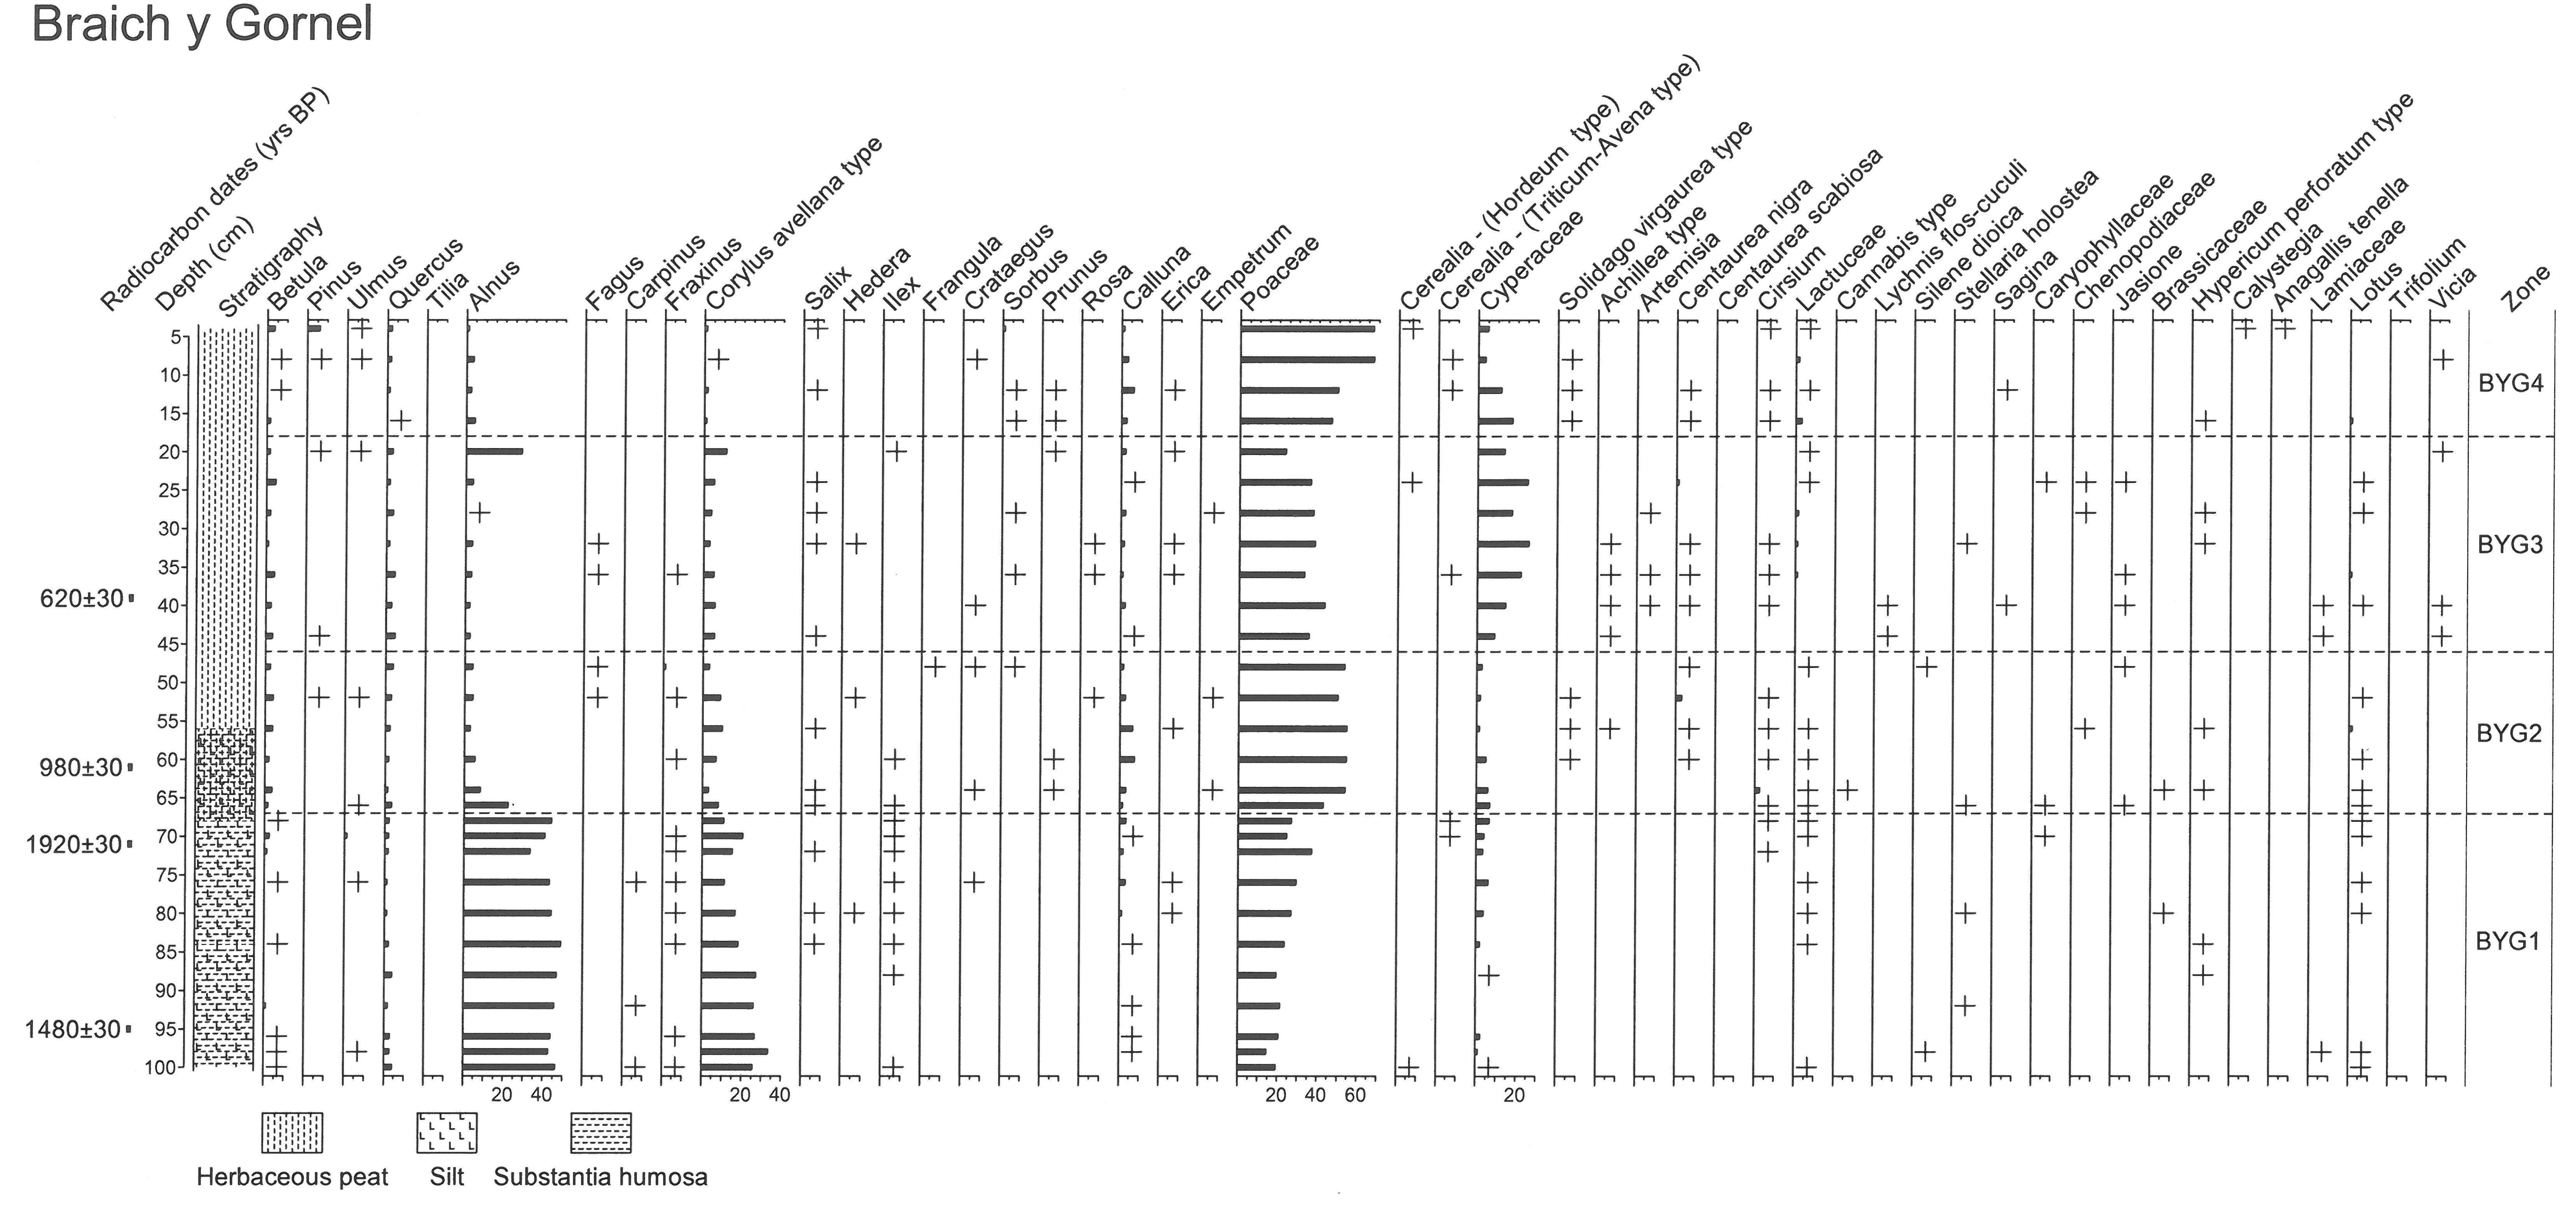
Figure 13a: Braich y Gornel. Percentage pollen diagram set 1
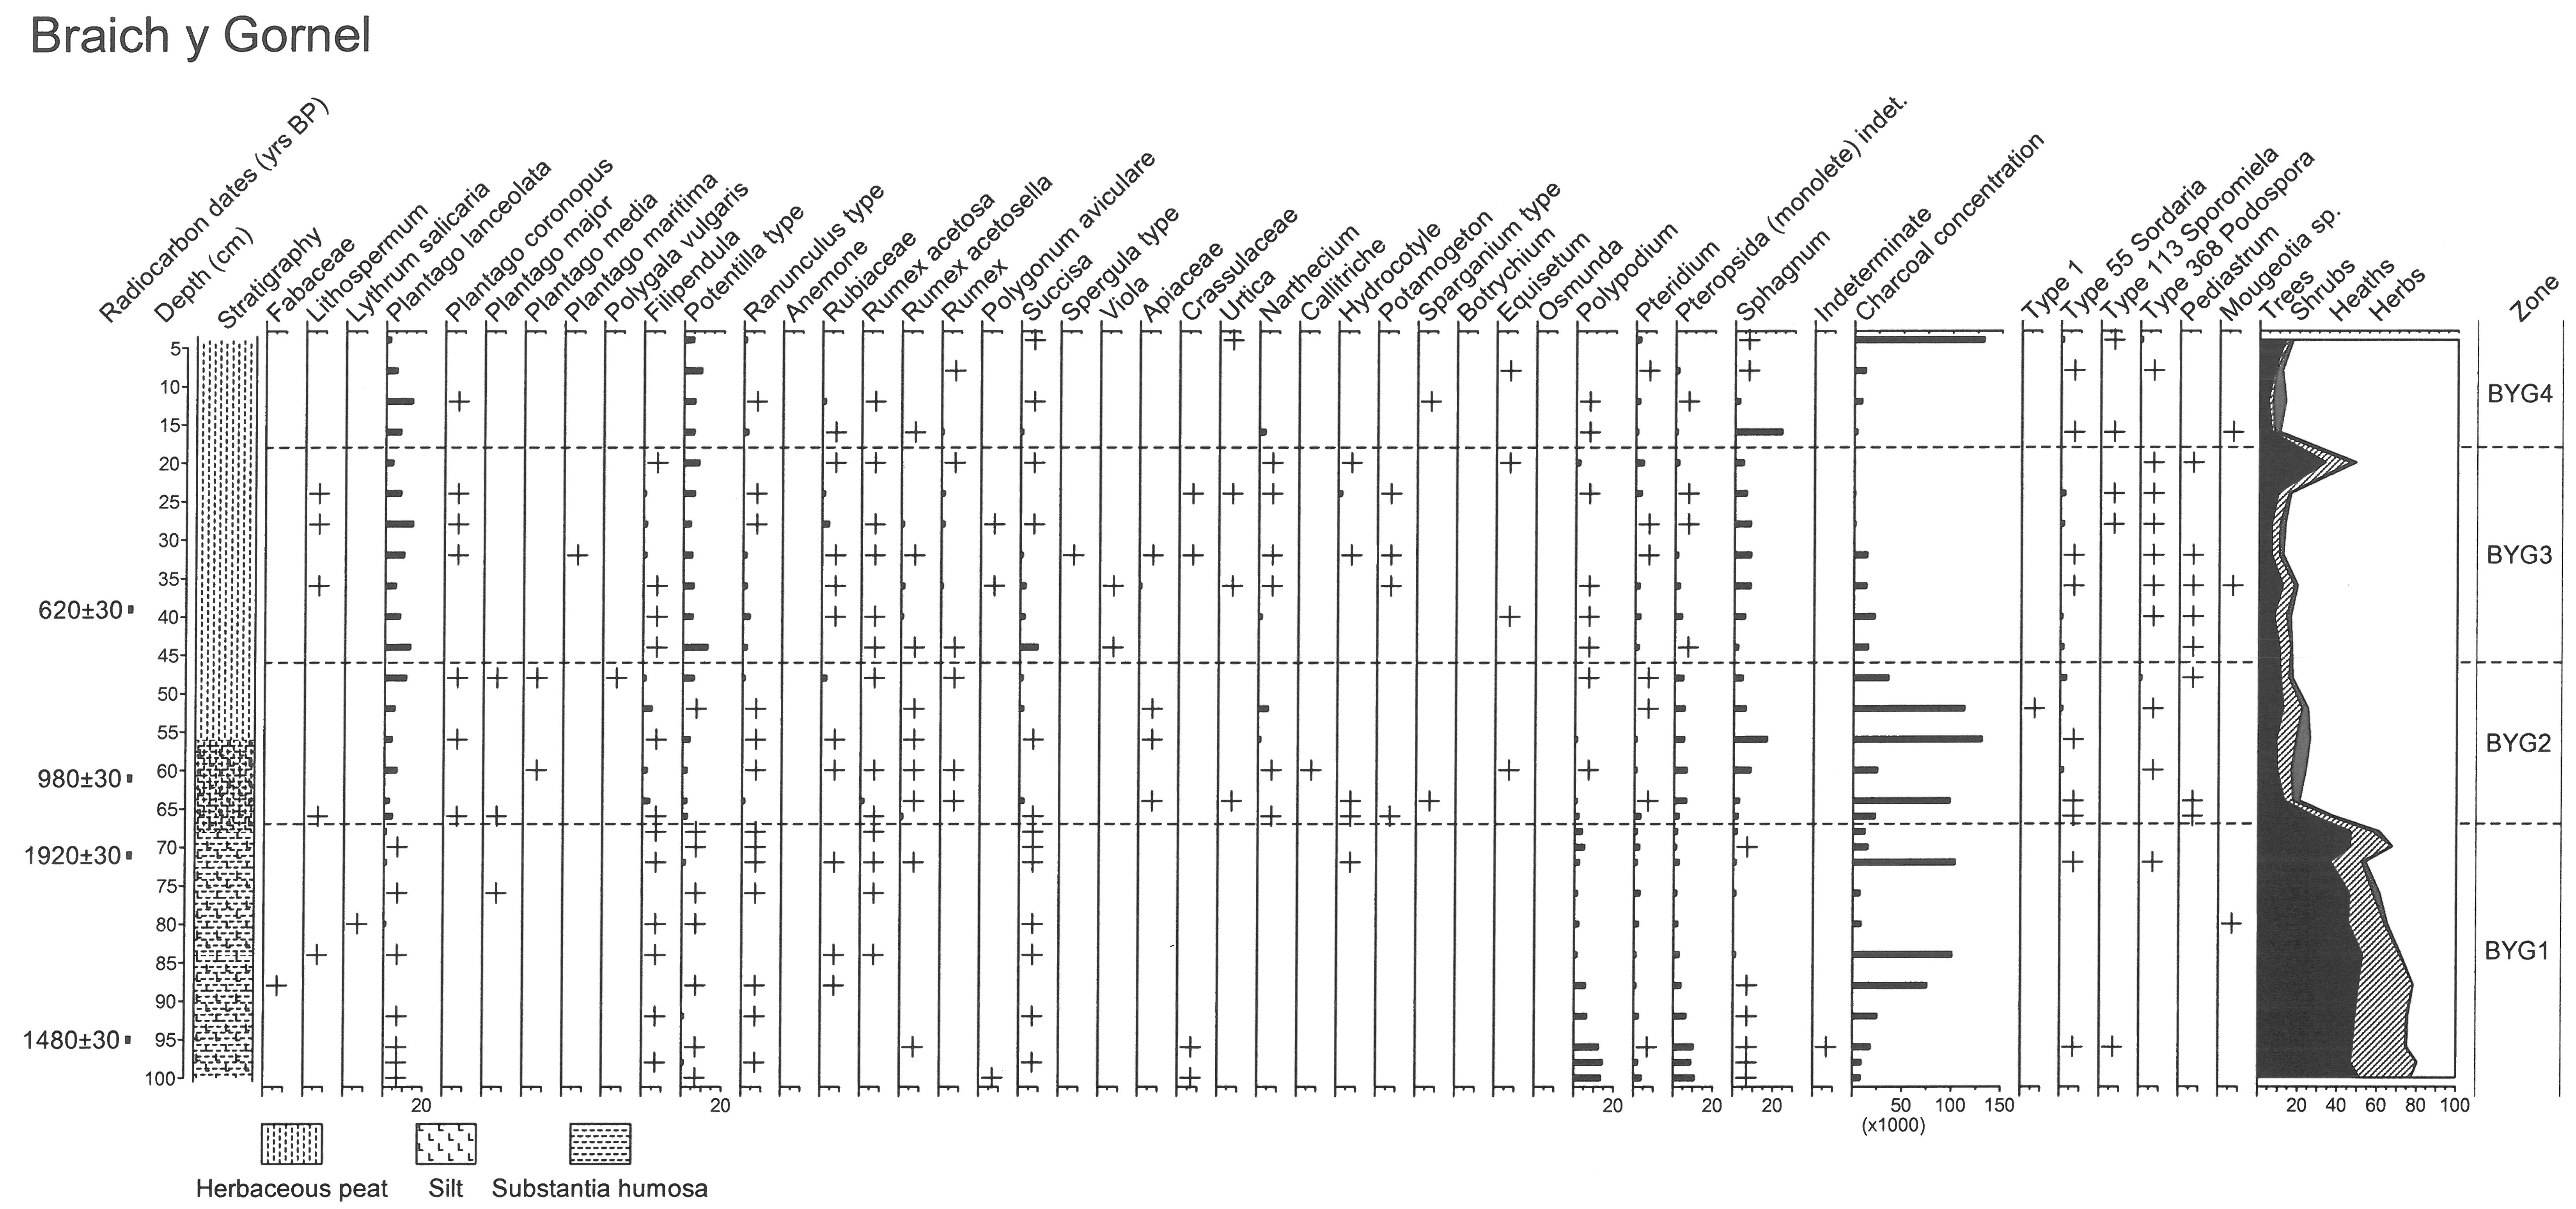
Figure 13b: Braich y Gornel. Percentage pollen diagram set 2
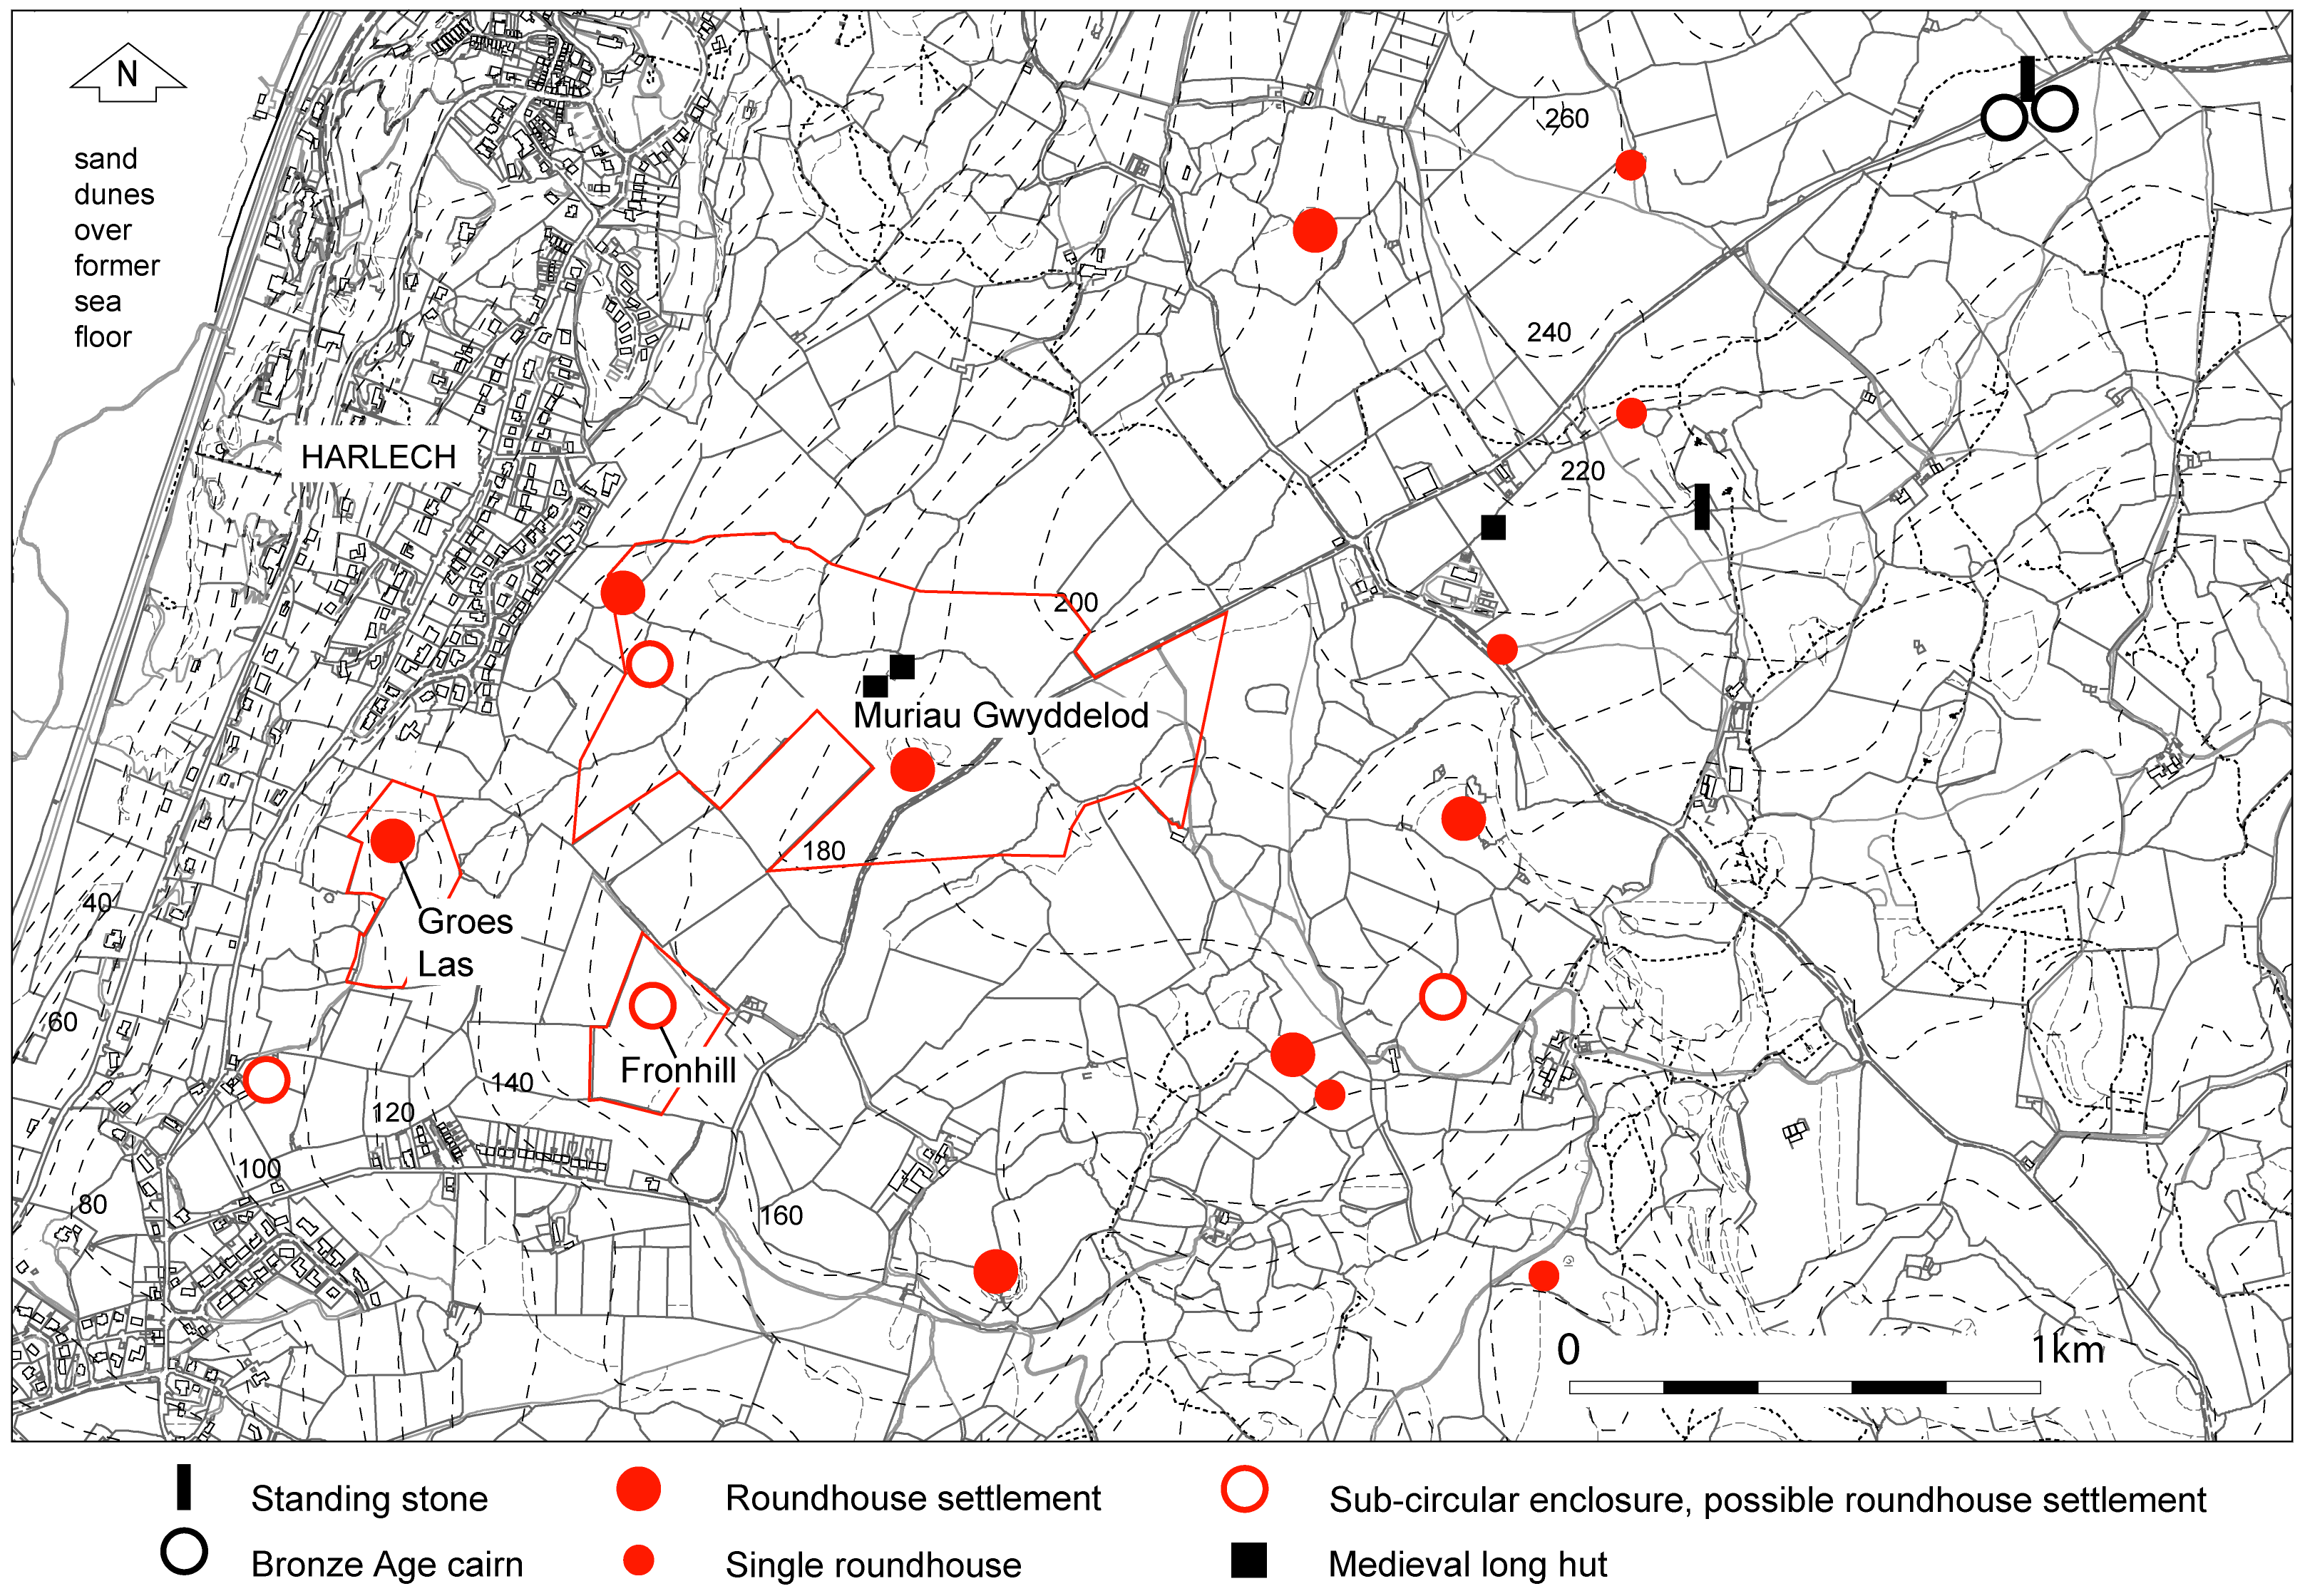
Figure 14: Muriau Gwyddelod. Location map. Scheduled areas in red outline (Based on Ordnance Survey maps. © Crown copyright. All rights reserved. License number AL 100020895)
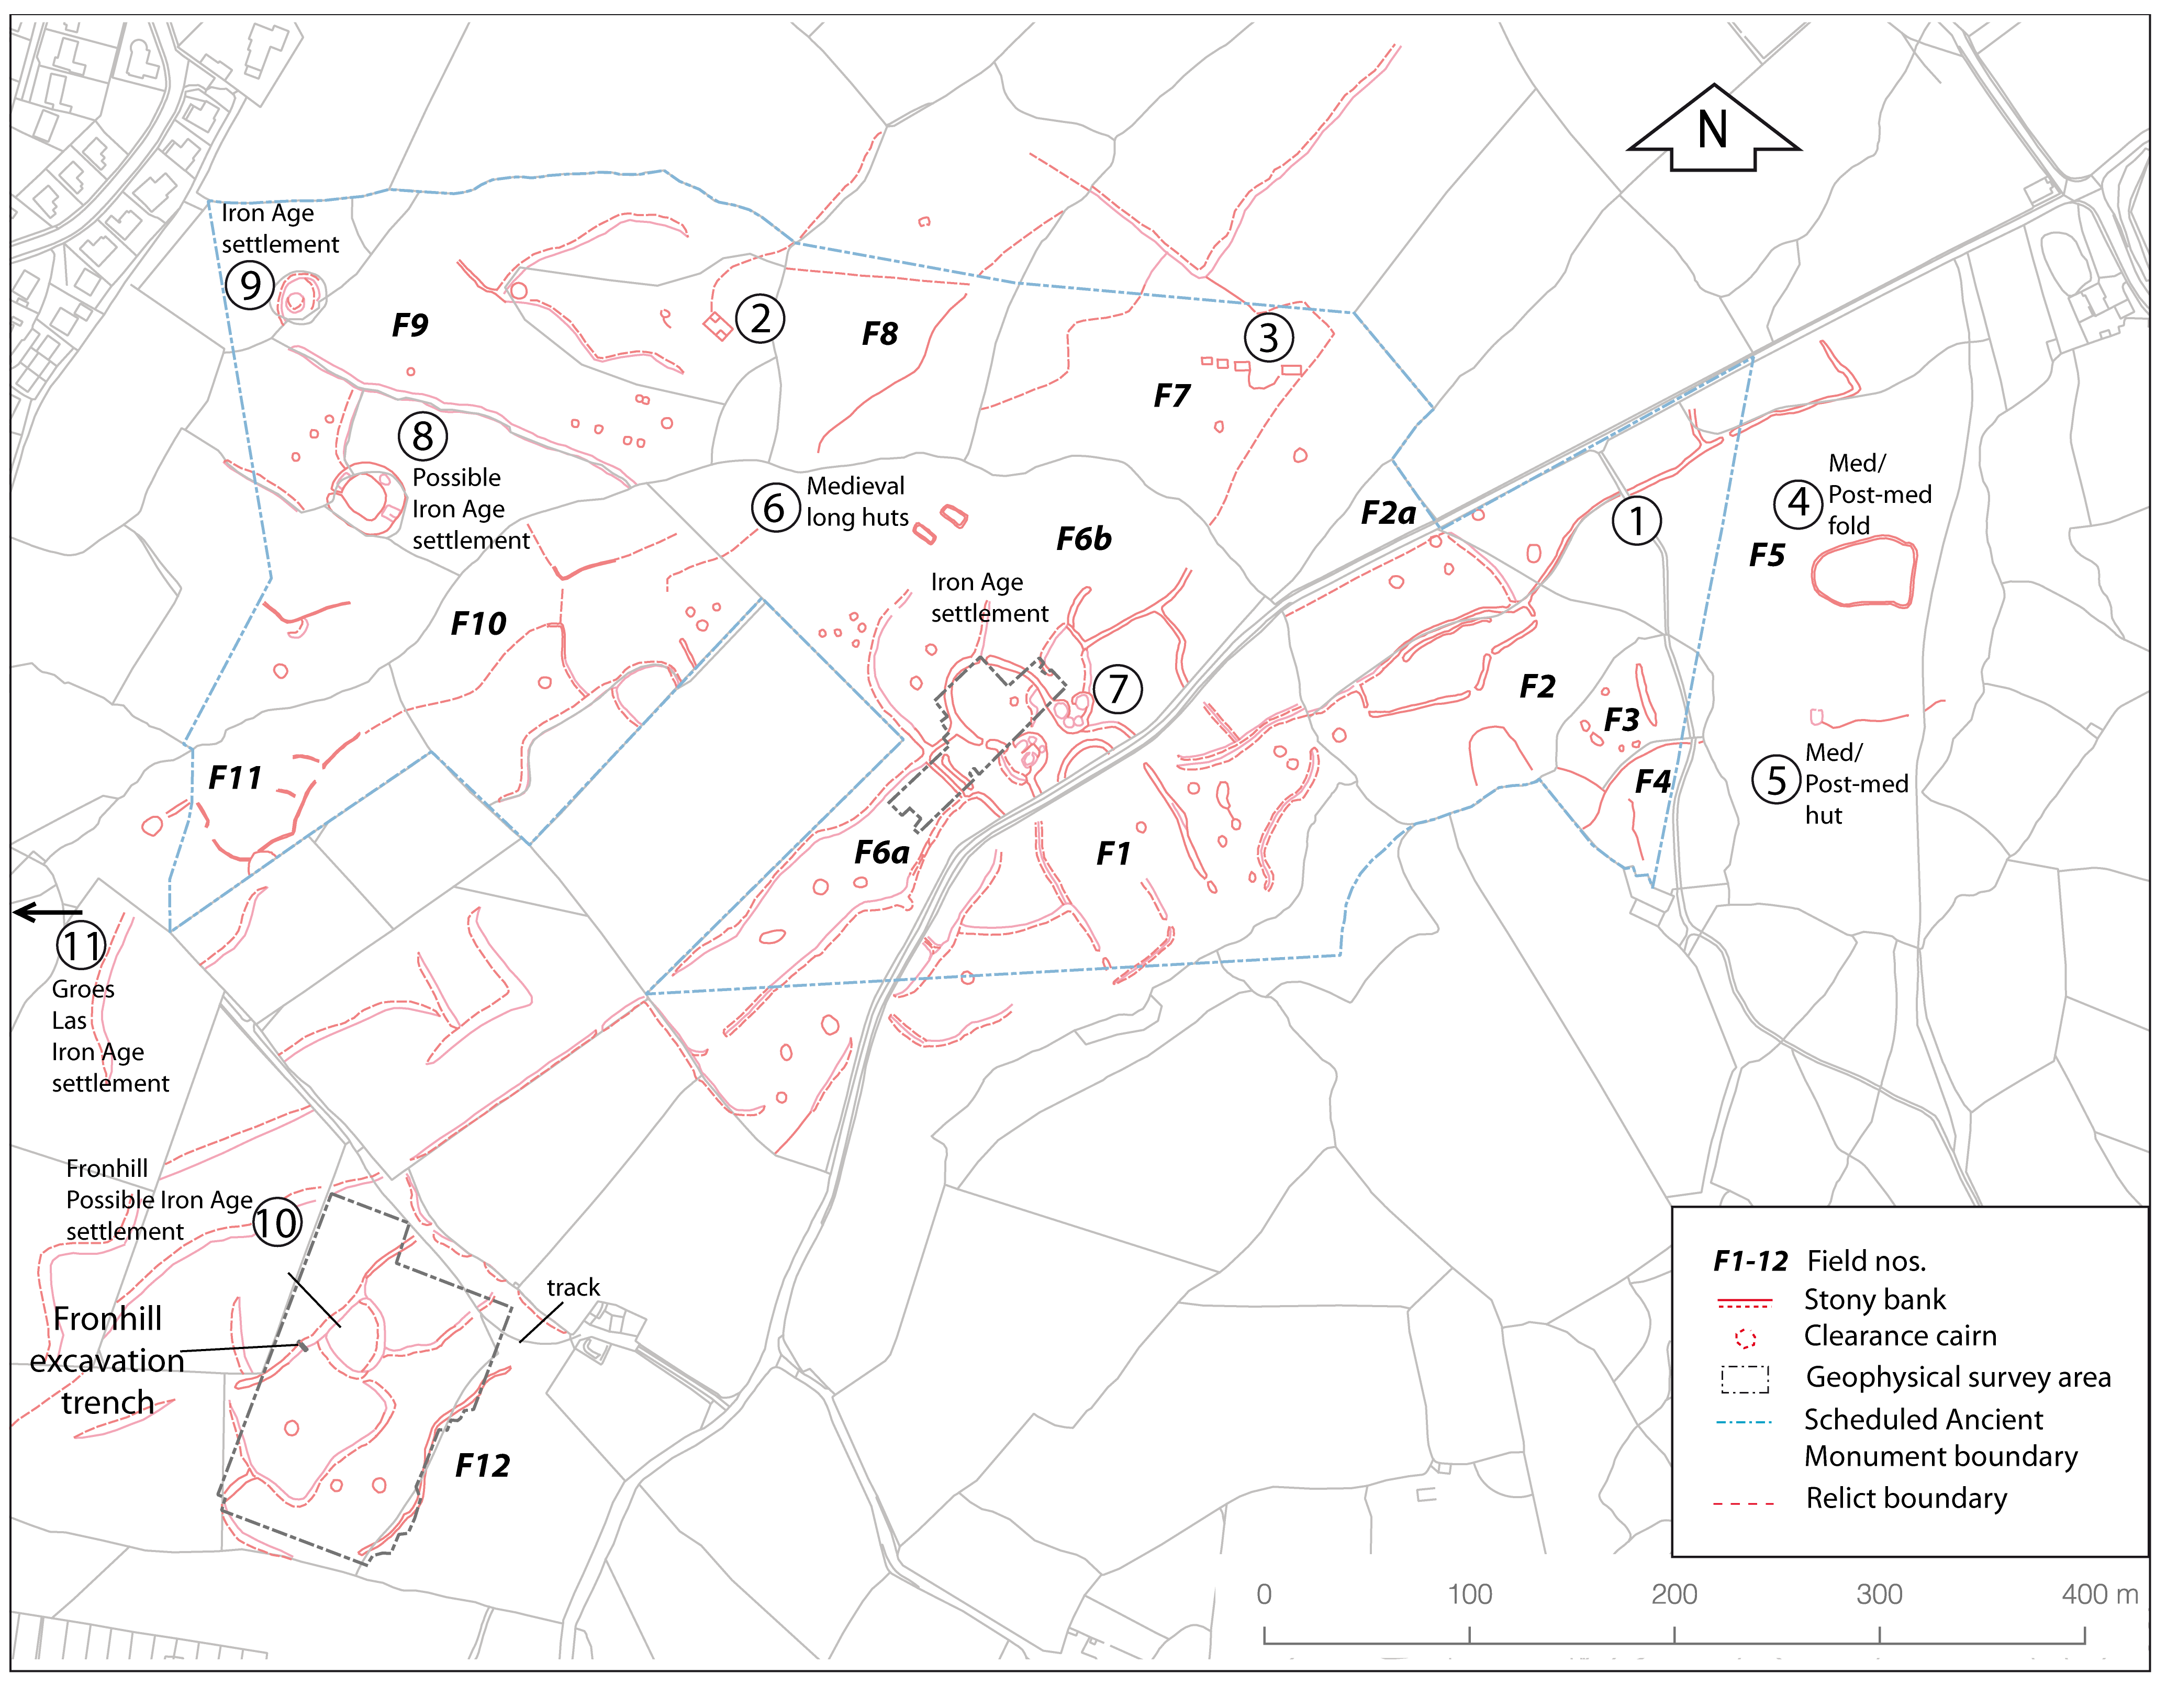
Figure 15: Muriau Gwyddelod. Area survey
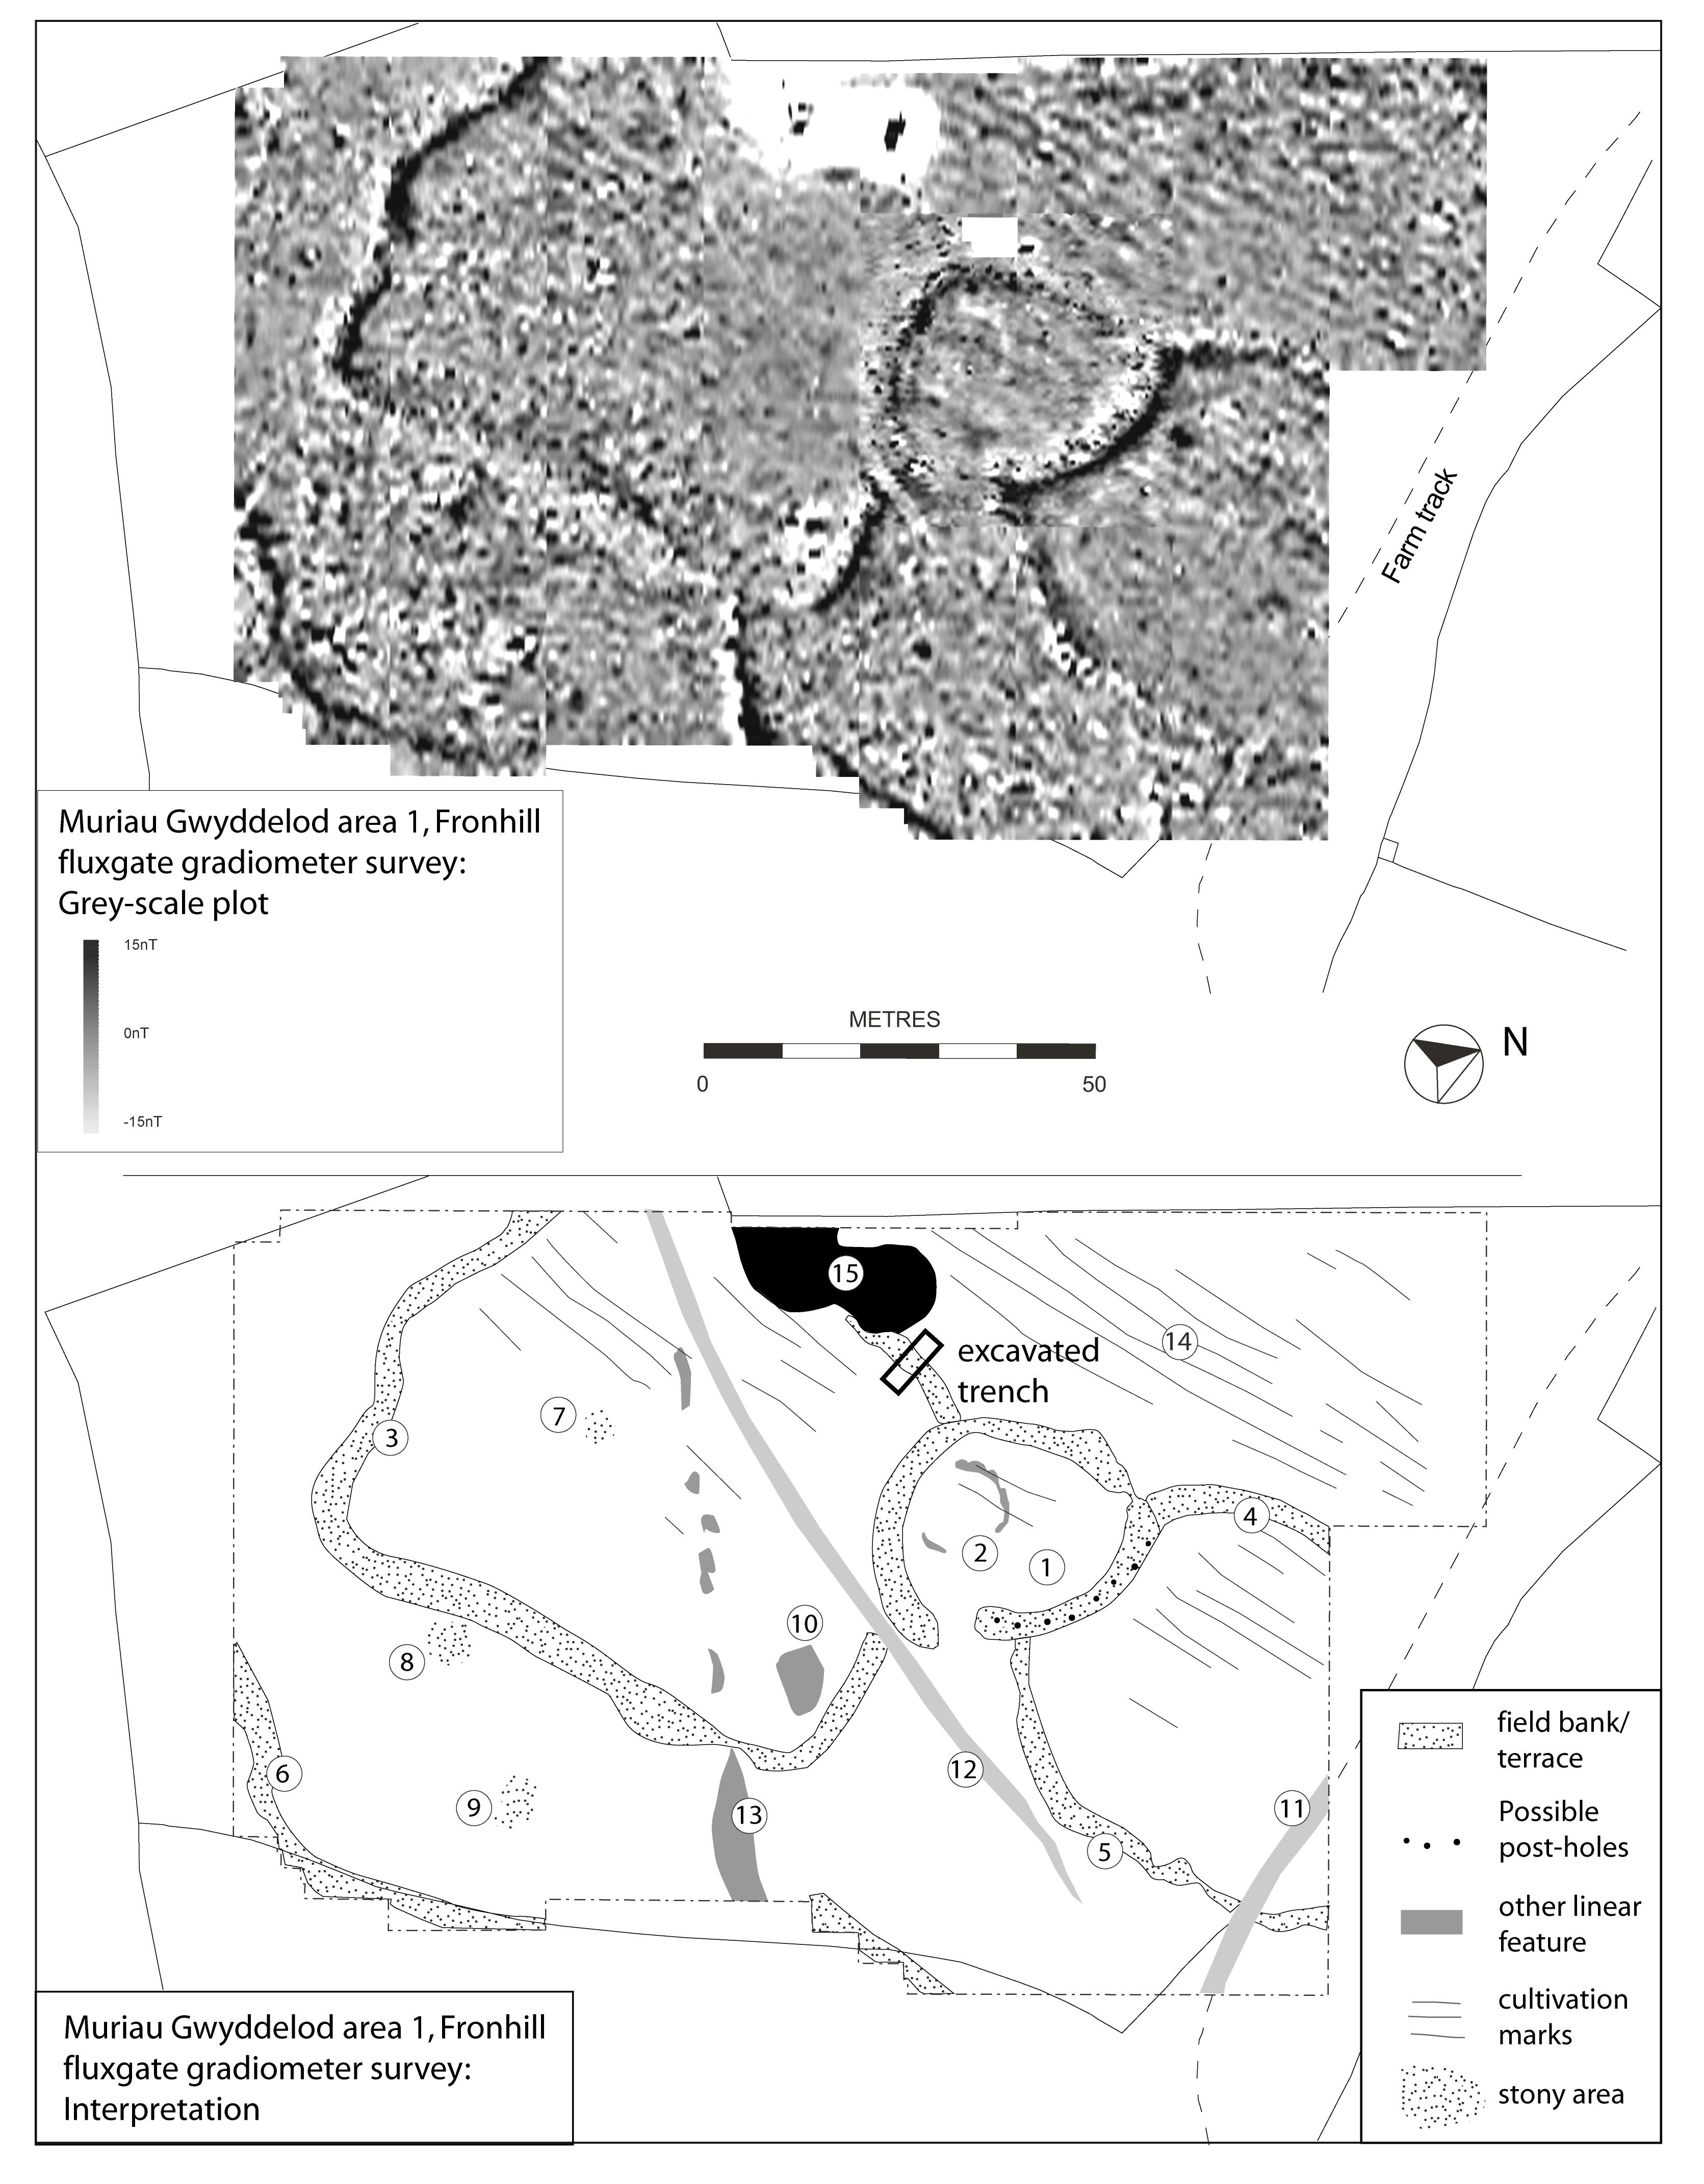
Figure 16: Muriau Gwyddelod. Fronhill. Gradiometer survey, grey-scale plot and interpretation
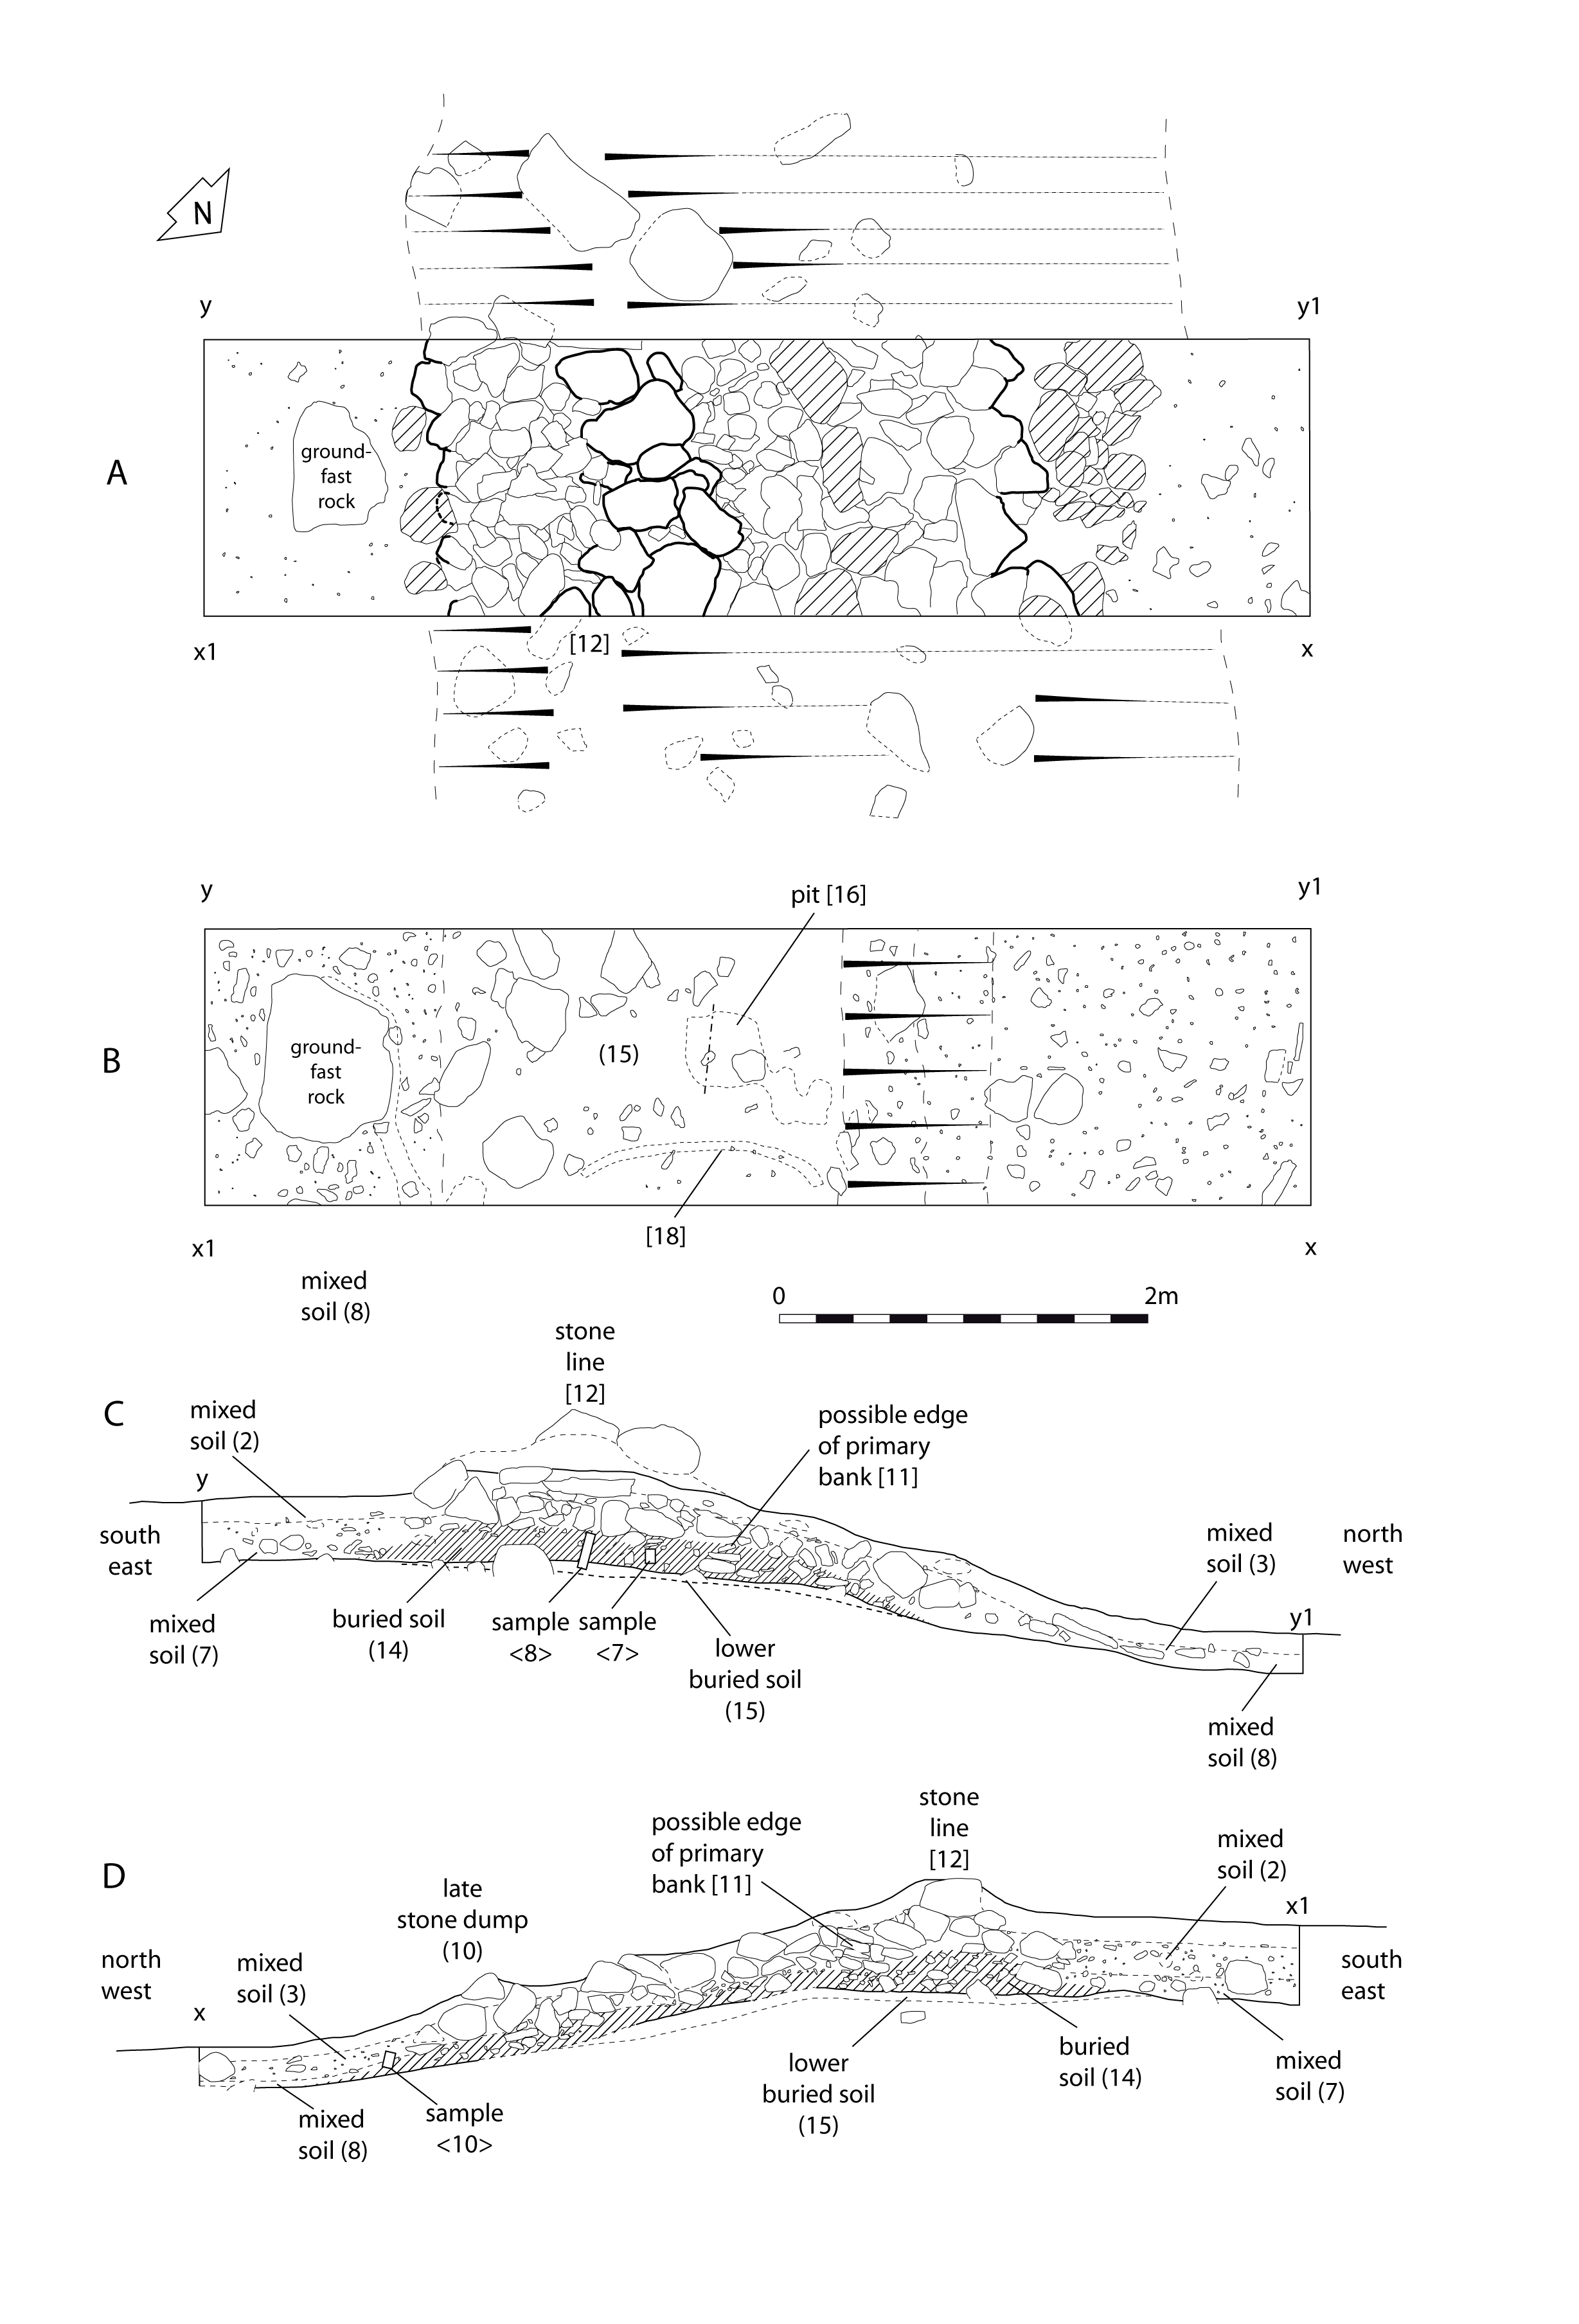
Figure 17: Muriau Gwyddelod. Fronhill. A, Plan of bank after removal of turf and topsoil, tumble hatched; B, Plan after removal of bank, showing buried soil (14) and pit/post-hole (16); C, north-east facing section; D, south-west facing section.
Internet Archaeology is an open access journal based in the Department of Archaeology, University of York. Except where otherwise noted, content from this work may be used under the terms of the Creative Commons Attribution 3.0 (CC BY) Unported licence, which permits unrestricted use, distribution, and reproduction in any medium, provided that attribution to the author(s), the title of the work, the Internet Archaeology journal and the relevant URL/DOI are given.
Terms and Conditions | Legal Statements | Privacy Policy | Cookies Policy | Citing Internet Archaeology
Internet Archaeology content is preserved for the long term with the Archaeology Data Service (ROR). Help sustain and support open access publication by donating to our Open Access Archaeology Fund.