Cite this as: Tyukin, I., Sofeikov, K., Levesley, J., Gorban, A.N., Allison, P. and Cooper, N.J. 2018 Exploring Automated Pottery Identification [Arch-I-Scan], Internet Archaeology 50. https://doi.org/10.11141/ia.50.11
This network has emphasised joint or collaborative papers, and particularly those involving partnerships that offer innovations and further developments for analysing and visualising Roman tableware data. Over the months between the two workshops of this network, from September 2015–July 2016, we had discussions with the Visual Intelligence Laboratory and Data Analytics Group, University of Leicester (Ivan Tyukin, Alexander Gorban, Jeremy Levesley, Konstantin Sofeikov) about how best to combine our respective skills in order to meet this objective and to address some of the network's concerns for improving the processes involved in developing meaningful analyses of large tableware datasets, across sites and regions. We discussed, in particular, the arduous process of classifying pottery by form and fabric, and how it might be improved through automation and digital collection of the resulting information. This cataloguing process was not initially identified as a specific focus for this network. However, speeding up and digitising the initial stage of the ceramic analysis could potentially lead to the more systematic, comprehensive and consistent compilation of large datasets suitable for the types of analyses with which this network is concerned. Such artefact processing has the potential to improve the objectivity of the cataloguing processes and make it more inclusive than is often current practice.
So we started to explore the potential of various types of automated pattern recognition processes, such as geometric morphometric (GMM) analytical tools used for identifying patterns in skeletal remains, or the 3D point cloud processing software Cloud Compare, being used by Jessica Lam (PhD student, School of Archaeology and Ancient History, Leicester), and real-time visual object detection and recognition systems, that might improve the effectiveness and efficiency of cataloguing and collating large datasets of Roman tableware sherds. Tyukin suggested that he could develop an automated scanning process for ceramic sherds and, together with Nick Cooper, Tyukin and Levesley examined some of the pottery in the collections of the School of Archaeology and Ancient History, Leicester, to get a better idea of what this might involve – what sorts of measurements could be taken and what characteristics could be recorded visually so that the resulting scan may be used to identify the vessel form and fabric of a particular sherd. We agreed that samian would be a useful material to start with as the shapes are standardised but usefully also occur in different size categories, especially the cup or bowl forms (e.g. Drag. 27 and 33). At the same time we agreed that a 'proof of concept' should be undertaken to demonstrate that it was possible to develop a process for automating the classification of ceramic vessel forms using this material in time for the second network workshop. The aim was to create dedicated software that could turn commonly available hand-held mobile devices such as smart phones into scanners that could recognise the ceramic vessel forms of the pottery sherds provided. However, because the scanner initially required complete examples of the samian vessels in order to learn what each looked like, and the School's collection lacked them, it was decided to approach the Jewry Wall Museum in Leicester in order to access their collections. Laura Hadland, Senior Curator of History for Leicester City Museum, based at the Jewry Wall was pleased to provide access.
To develop a suitable scanning device for this task, Konstantin Sofeikov created a scanning app for smart phones that can take videos (as sequences of 2-dimensional frames) of objects to learn to detect and recognise similar objects and to classify them accordingly.
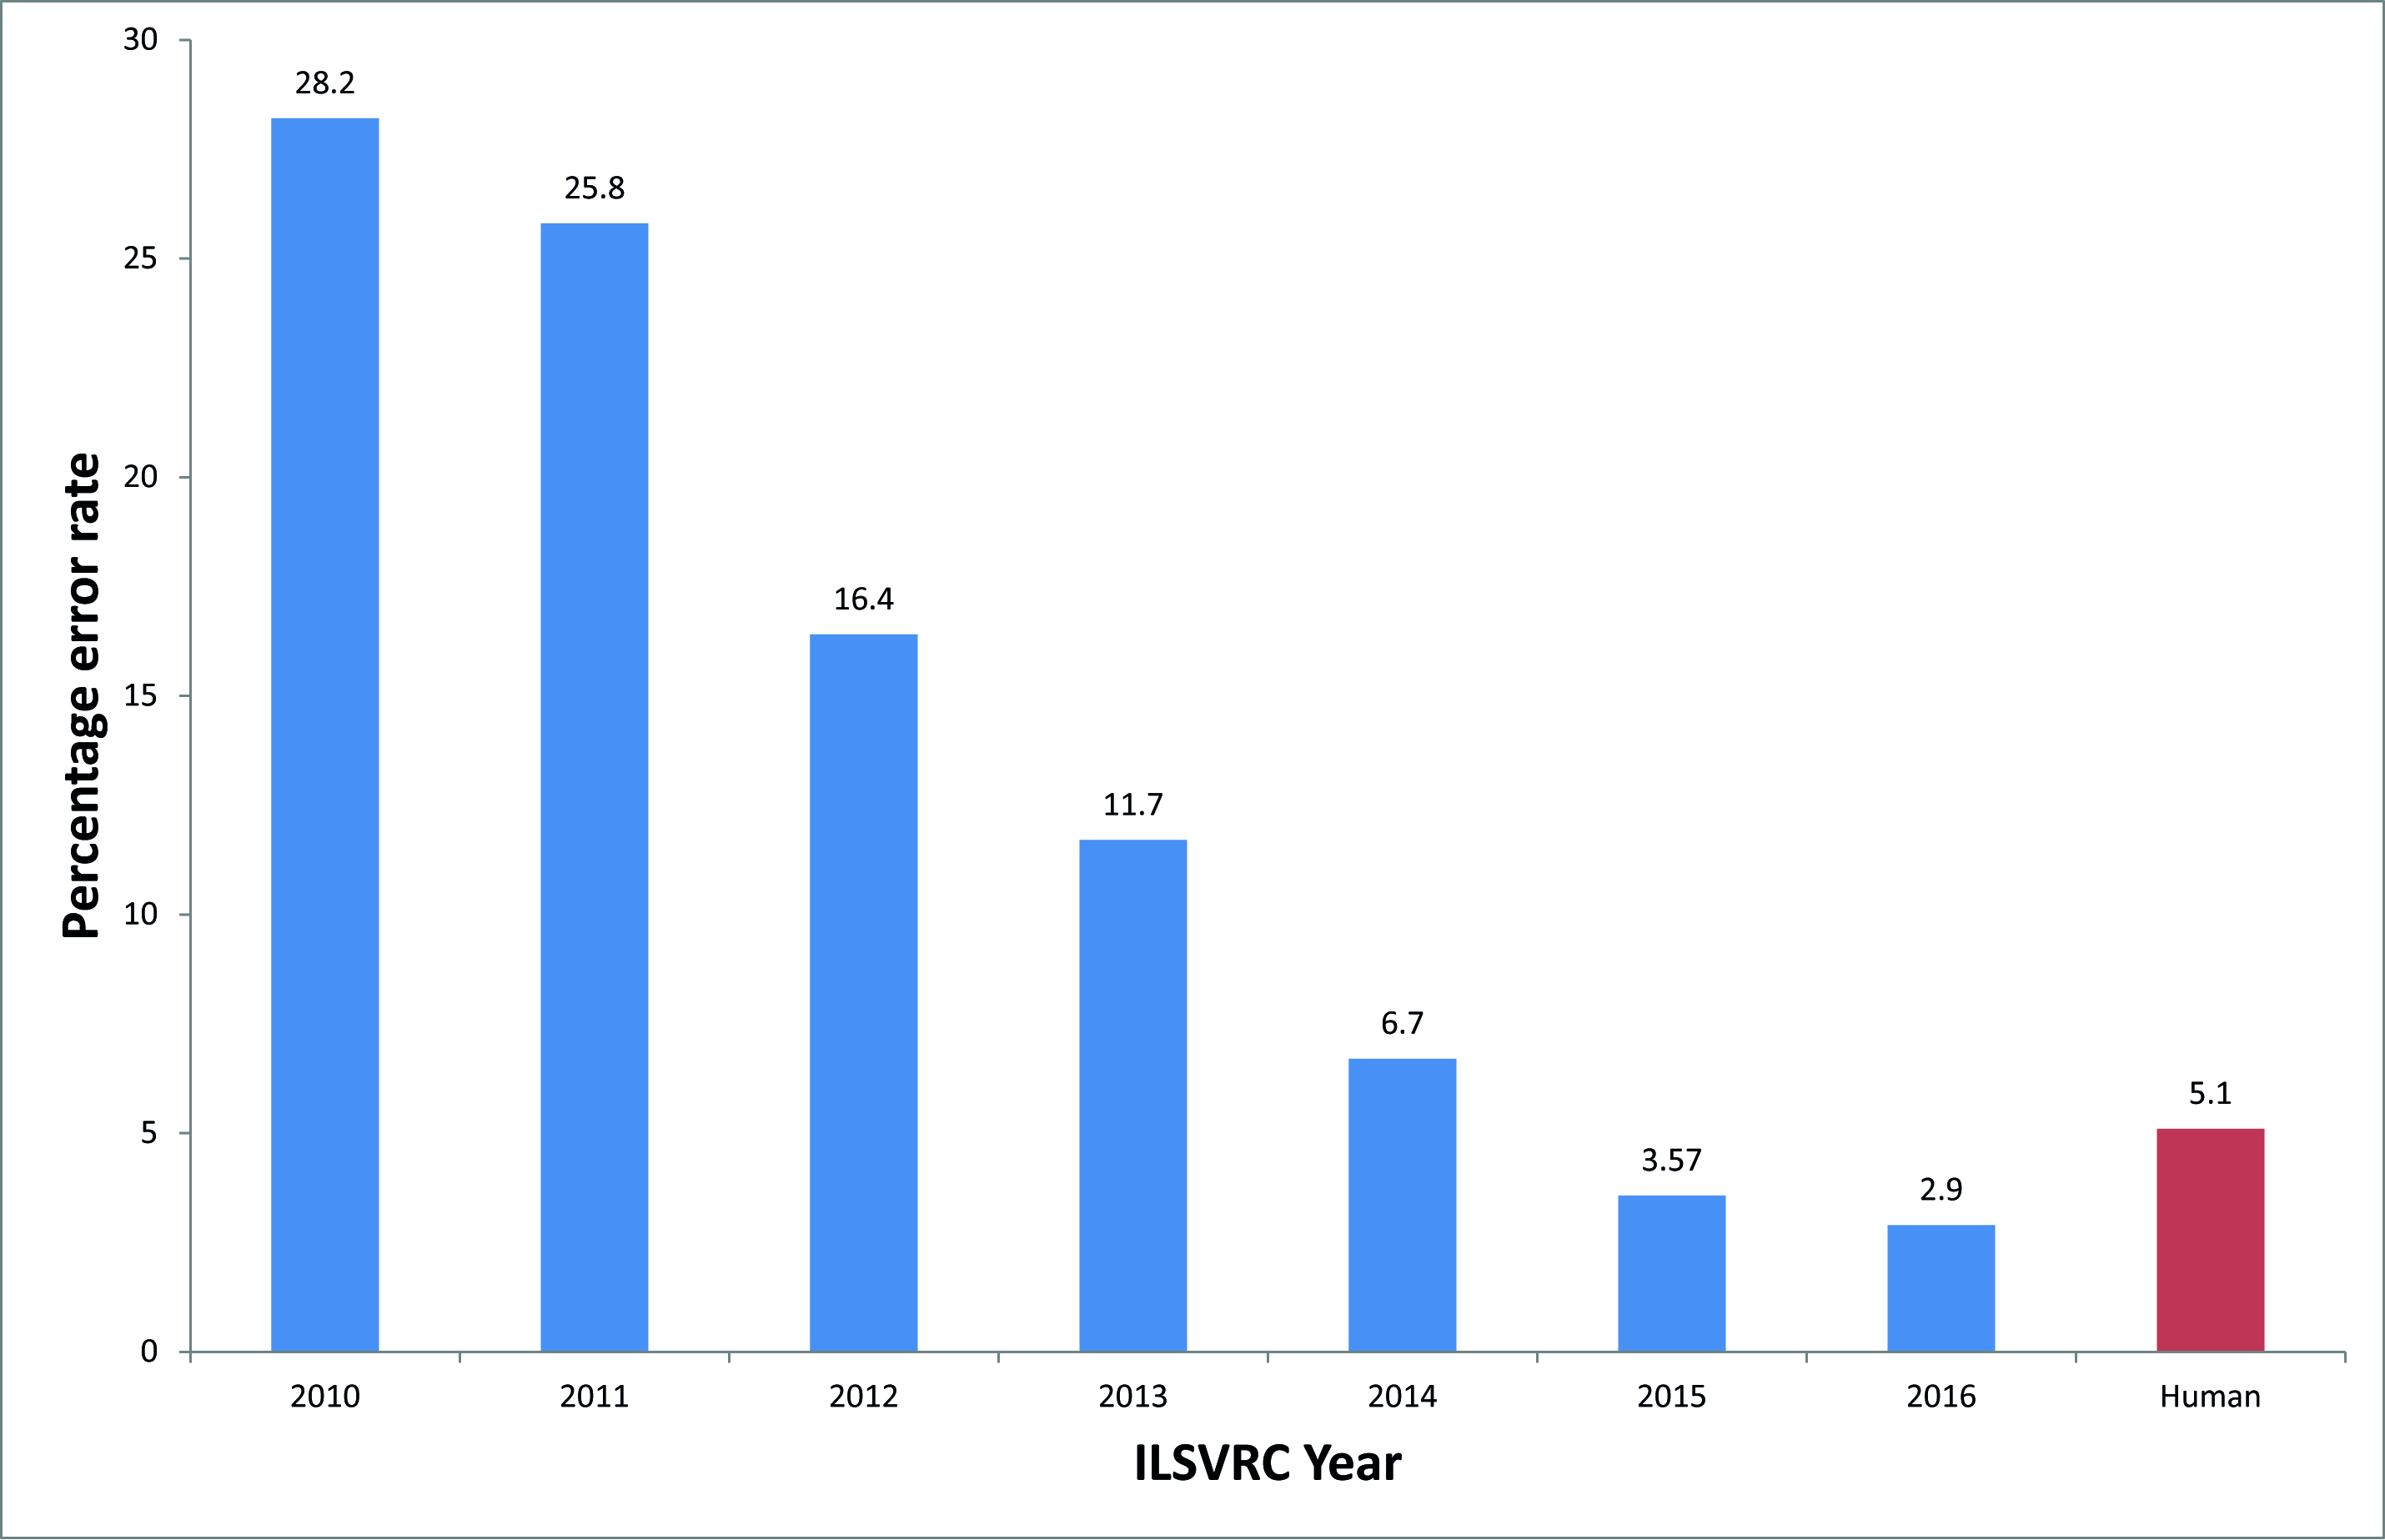
For classification and recognition purposes we initially planned to employ Convolutional Neural Networks (CNNs) as classifiers (LeCun et al. 2010). These classifiers, albeit being perceived as efficient machine vision tools for detection and classification purposes (Figure 1), require significant computational resources. However, such resources are often not available on archaeological sites or in locations where artefacts are sorted. Significant time and resources (i.e. millions of images classified into relevant categories) are also required to develop reliable CNNs-based classifiers, so for the purposes of creating a more feasible prototype we opted to use a hardware feature generating solution that we have been developing over several years jointly with our industrial partners, Apical Ltd (now ARM), which has been successfully benchmarked on various object detection tasks in real-time live video streams.
This hardware feature generating solution uses Histograms of Oriented Gradients (HOGs) (Dalal and Triggs 2005), calculated via overlapping patches of images taken at multiple spatial scales. Even for this simplified case, as compared e.g. to full-scale CNNs, the sheer computational complexity of corresponding computational procedures needed to generate HOGs is huge. This is because we wanted to ensure high invariance to viewing angles, distances, and exact location of objects in the frame at the stage of classification. Note that the computational complexity of processing these samples could be substantially reduced if classification of objects is done in environments where object location and geometrical size in the frame are fixed. For each video frame we generated more than 100,000 feature vectors; the vectors have thousands of attributes which are then used for classification purposes. Despite this apparent difficulty with processing sheer quantities of data, the hardware platform performs these operations in real time for every frame in the video (25 frames per second). The solution is also low-energy and stand-alone. In future, and in cases where substantial computational resources are available on site or where the possibility exists to connect to a computational cloud, we intend to update our feature-generating procedure to that used in CNNs and comparable advanced classifiers.
The prototype implementation of Arch-I-Scan was first tested for our presentation at Workshop 2 of this network (July 2016), which involved recording video footage of (modern) artefacts – a milk carton and a coffee mug – from varying angles and lighting conditions. The footage was first passed through the hardware to generate object representation in HOG feature space. The data were then used to train the classifier.
The advantage of using such an approach for classification is that all relevant combinations of features are learnt from examples. The disadvantage is that this approach traditionally requires thousands of training samples. Varying viewing angles and lighting conditions provided us with a large enough number of data points from an initially limited database of artefacts. An alternative methodology would have been to employ dimensionality reduction prior to classification. The 'dimensionality', in terms of the number of attributes recorded for an object, is discussed in Section 3. This process, comparable to that of object detection in computer vision, provided on its output an object type and its score (a similarity measure corresponding to the likelihood of that object being of that type). An example of one way of deriving this score is provided in Section 3.
In November 2016 we visited the Jewry Wall Museum storerooms to scan complete Roman ceramic vessels (Figure 2). For experimental purposes we scanned ten vessels. As mentioned above, we used a self-written smart-phone application that allows the creation of a large set of pictures of the artefact of interest, in this case a complete or near-complete ceramic vessel. There is little difference here between taking individual stills and a video sequence; the main advantage of the former being that shooting a sequence of stills allows the angle of view and camera position to be changed without capturing unnecessary frames. Videos must be edited in order to cut out redundant frames. Potentially, the process of video editing could take a lot of time when scaling up this experiment.

At this stage in the testing of the device, the scanning process itself was relatively simple although it still involved a number of steps. The vessels were first placed on a table against a mainly plain light background to simplify the recognition task. The second step was to run the scanning application and shoot sequences of pictures of each artefact, keeping the artefact in the centre of the frame and making it occupy as much of the picture as possible, at a consistent, although not specifically measured, distance from the artefact. This reduced the number of possible visual appearances of the object to be learned and recognised by an AI (Artificial Intelligence) system. Some examples of artefact placements, showing the types of shots that were taken, can be found in Figure 3. The third step was to upload pictures to an available cloud service. This step can be done automatically by the application. This concluded the scanning process for the initial testing of the approach and technology. From this point the application was not used again and we switched our attention to the process of building recognition models.
There are two possible levels on which automated computer recognition can be performed. One approach is to build detectors that will identify the object of interest – e.g. a complete vessel – in a picture. In such a case, we create a separate detector for each artefact. Therefore, if one of the detectors finds something in a picture comprising more than one vessel, we assume that this picture contains an artefact of a certain previously identified type. Since we know exactly which detector fired, we know the artefact type and this step completes the recognition process. This would be a low-level recognition. The opposite approach is to build a detector that can 'find' all types of objects of interest in a picture of more than one artefact. In this case, if the detector fires we still do not know exactly which artefact was found. However, each candidate is sent to the second stage, where a specially trained AI system identifies which type of object it is, according to existing visual taxonomies. In contrast to the low-level approach, this one would be a high-level one. In the second case a Convolution Neural Network is a quite common choice nowadays since this approach has proved its efficiency in many tasks, which include, but are not limited to, object and face recognition, and object detection and sequence modelling (LeCun et al. 2010).
For this 'proof of concept' we decided to follow the first approach and build a low-level recognition system, as the time required is considerably less than for the second one. Also, the second approach, as discussed, requires much more initial data than the first. For building a detector we defined the sets of variables:
 ,
, 
and collated them into a single table X, with Xi being the i -th row in the table. For each row, the variable yi is a 'label' associated with  in this row. In our setting, yi can be the registration, or catalogue, number of an artefact. This variable is used to clearly identify the object or type of object we are referring to by reference to associated catalogue information collected by archaeologists. Variables
  are called 'object attributes' that describe the object in one way or another. The number of attributes of an object is referred to as the dimensionality of the attribute space. The higher the dimensionality of space the more attributes are used to describe the objects.
For our experiments we numbered our whole vessels from 1 to 10. These numbers were assigned to yi and we refer to these artefacts through these registration or catalogue numbers. Let us now consider in more detail how we form object attributes. For this purpose, we used the Histogram of Oriented Gradients (HOG) descriptor. The HOG construction process is well described and studied in the literature (e.g. Dalal and Triggs 2005). In our experiments, we used 6-bin HOG and rectangular 11x11 object geometry. The total number of attributes was 2400.
If one follows the above processes for data collection from each artefact, the feature extraction process and filling of the table X are routine and can be automated. For each artefact, we take an already recorded picture of this artefact and pass it through the HOG extraction procedure. This results in a table, each row of which corresponds to the picture taken and has 2400 columns. The total number of rows, Nn, corresponds to the number of pictures of the artefact. For our experiments an average value of Nn was about 100, and for each row constructed that way we set yi to be that object's catalogue number. For building a detector we also needed so-called negative descriptors. These were obtained by passing any image that does not contain any vessels of the type we were interested in though the HOG extraction procedure. We then also put these negative examples into the table X, and for each of this new samples we put yi=0. We recommend that the size of the set of negative examples is at least ten times larger than that of positive examples for each vessel. In principle, negative examples can be automatically generated from pictures not containing full images of the artefacts in question. Furthermore, these negative sets can be prepared a priori once and/or reused for other experiments later.
After obtaining both positive and negative sets combined into a single table, one can build a detector. The detector is built in the following form:
where the above angled brackets denote the Euclidean inner product
 ,
,
and where x is a vector that contains object attributes (a row from table X), w is a 'weight' vector and b is a 'bias' term. The vector w and the number b are parameters of the detector. These parameters are derived via a separate computational procedure, i.e. detector training. Values of D(x) can be greater or smaller than zero. If, for a given vector x, the value of D(x) is greater than zero, then we say that we have a 'positive' response from the classifier, otherwise we declare the response as 'negative'. Note that the value of D(x) can also be used as the x's score. The larger the value – the higher the score of x is.
Many procedures for finding the values of w and b from empirical data have been developed to date. Among the most popular are the Fisher Linear Discriminant (Fisher 1936) and Support Vector Machines (SVM) (Cortes and Vapnik 1995). In our experiments we used SVM.
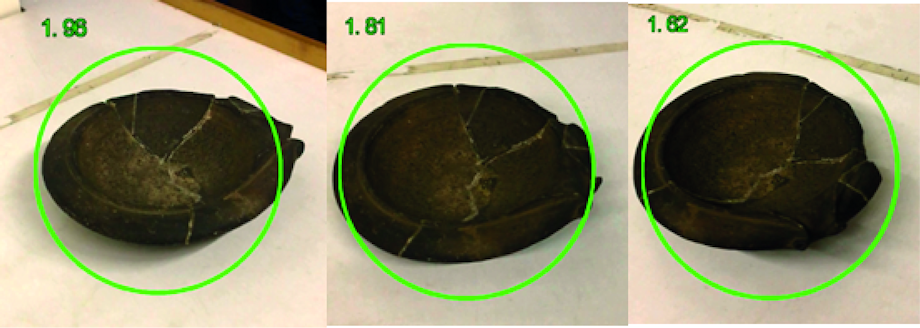
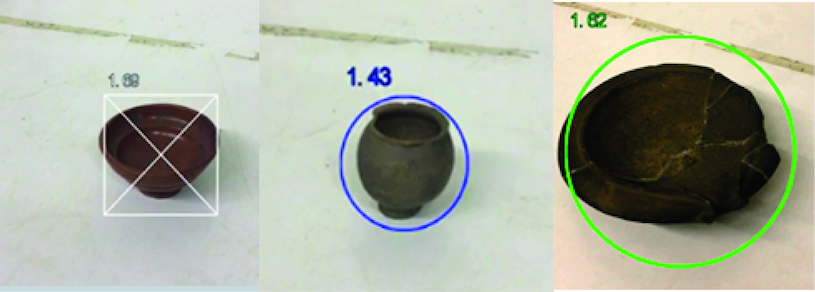
Repeating the detector construction procedure for all ten vessels we scanned in the Jewry Wall Museum would have produced ten detectors. The recognition procedure would then amount to running all ten detectors over a given image. As an initial experiment, we took three vessels presented individually in three different video sequences and ran our recognition procedure on them. The three objects we chose can be found in Figure 4.
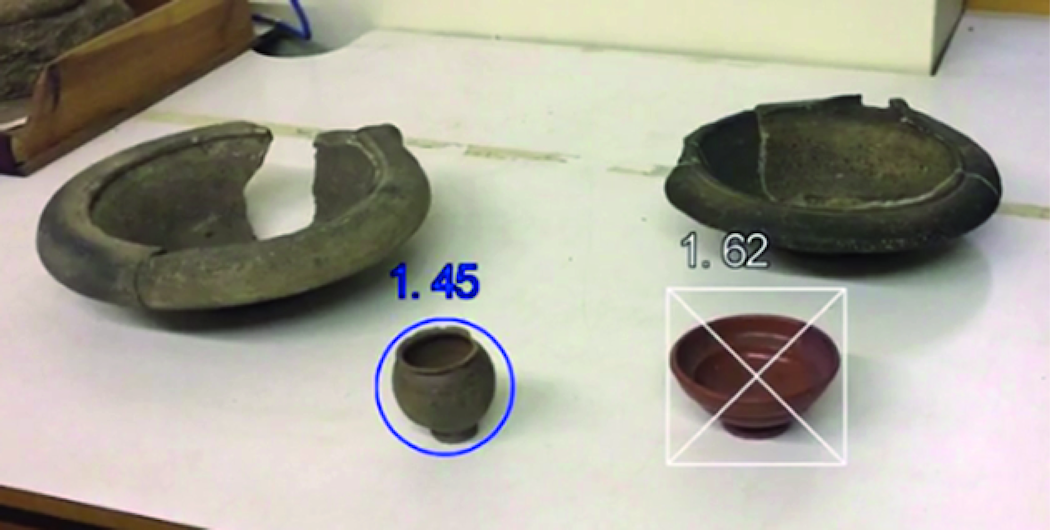
For the second part of this experiment, we took two of these vessels again, and put them together with other vessels in the same video sequence and then ran our recognition procedure. Figure 5 shows that two different vessels in a single video sequence have been correctly identified as two of the separately videoed vessels in Figure 4.
Interestingly, in this experiment we did not observe a significant number of false positives. At the first glance, this is very surprising behaviour. The behaviour, however, can be explained via measure concentration theory, detailed theoretical justifications of which are beyond the scope of this article (see Gorban et al. 2016; Gorban and Tyukin 2017). We would like to note that these new results are viable not only for the class of linear classifiers investigated in this work, but also are applicable to classifiers based on CNNs as well as to legacy AI systems as long as their feature space has the structure of linear topological space and its dimension is sufficiently high.
The development of the prototype (comprising a standalone device and smart phone app) and the scanning and learning processes, are in their early stages so it is not yet possible to evaluate the full potential of this approach to automated pottery classification and information storage and retrieval. The device, which uses an AI developed for general object detection, has shown that it can instantaneously identify different complete and near-complete vessels, irrespective of the precise scale at which they were scanned. An important aspect of the success of this or any other prototype will be its ability to distinguish between the different variations and sizes of particular vessel forms, such as between Conspectus 46 and 47 vessels or between different-sized Drag. 27 vessels, and also between fabric variations, and to be able to codify the results as appropriate for archaeological approaches to artefact collation. Indeed, we can perhaps be optimistic that, in the case of vessel forms, with a more comprehensive and focused approach to the scanning (e.g. of vessel profiles, underbase details, and decoration etc.), it will be able to provide better distinctions than can be identified using traditional visual methods. It is also anticipated that this will apply to fabric and fabric composition. The second important, and essential, aspect of the success of this device will be its ability to identify individual sherds belonging to those recognised forms, in a similar manner to using an image of a nose to identify a known face.
Other research is being carried out in this general area of pottery scanning and recognition, for example by a team in Israel (Karasik and Smilansky 2008; Karasik et al. 2014), and also by the more recent European Research Council funded ArchAIDE project, initiated since this current project in June 2016 and due for completion in May 2019. However, the advantages of Arch-I-Scan include its potential for speedy and comprehensive artefact scanning and classification, without needing drawings (see Christmas and Pitts, this volume), and its learning capabilities. We believe that Arch-I-Scan has the potential to produce classification outputs similar to those of these other projects, and to collect a massive amount of classificatory information from each actual sherd, including e.g. texture and fabric of the material it is composed of, but in a matter of seconds and by people with relatively low levels of expertise who will be able to scan pottery in the field, or in a pottery sorting shed, rather than needing to use specialist expertise and equipment. That is, students and volunteers, with hand-held devices, will be able to take a greater role in artefact cataloguing, and profit from the learning processes involved. This means that a much greater volume of pottery, and much higher percentages of the pottery from each excavation than is often current practice, can be scanned and catalogued, leaving ceramics experts, and potentially other finds specialists, greater opportunities for more specialist and comprehensive analyses, such as are needed for the consumption approaches of this network. That is, it will become viable to catalogue large ceramic datasets more comprehensively to provide a greater degree of quantifiably reliable and analysable 'big data'.
A significant capability of Arch-I-Scan is its ability to learn and to keep learning. In particular, Arch-I-Scan can be used to build up a 'knowledge base' of complete, or near-complete, Roman ceramics, and particularly tablewares (e.g. from the collections such as those of the Museum of London (MOLA); University of Leicester Archaeological Services; and the Sagalassos Archaeological Research Project). This 'knowledge base' can then be added to with more fragmentary pottery sherds from such collections. The more vessels and sherds Arch-I-Scan 'sees' the more it 'learns', the more efficient it becomes, and the greater is its ability to detect, recognise and classify ceramic sherds. As Arch-I-Scan 'learns' an adequate number of vessel forms, sizes and fabrics, and a wide range of sherds of these vessels, it can make pottery cataloguing a less specialist task, as outlined above.
Thus, this collaboration provides an opportunity for a new and exciting development in archaeology. Arch-I-Scan has the potential to revolutionise approaches to artefact processing. The scanning and recognition process can form a conduit for developing greater research use of large datasets of pottery often left out of more creative and innovative archaeological investigation. For example, the recent report of the excavations in the garden of the Casa di Marcus Fabius Rufus, in Pompeii (Grimaldi 2014) includes no utilitarian ceramic wares, although one would expect some at least to have been excavated. By automating, or semi-automating, the cataloguing process for ceramics – the main 'big data' in Roman archaeology and in much of the archaeology of more recent periods – this procedure will facilitate the cataloguing of all such ceramic remains, allowing ceramic specialists, academic and professional, to focus their skills on less manual and more sophisticated analytical and interpretative tasks in pottery studies. In particular, their time would be freed up to use these artefacts to greater effect for addressing the research-driven, and more social-orientated, questions that are the concern of this network.
By using Arch-I-Scan it will be feasible to build Roman pottery datasets whose 'knowledge' can be shared by all. The data descriptions, or data attributes, and the emerging features of particular sherds that best distinguish one type of artefact from another will evolve from the data collection. Thus, information characterised by the significance of various parameters in a deep learning network can be made widely available. Such large and characterised datasets have great potential for addressing a wide range of questions but we are often hamstrung by the overwhelming tasks involved in primary data identification and collation.
Internet Archaeology is an open access journal based in the Department of Archaeology, University of York. Except where otherwise noted, content from this work may be used under the terms of the Creative Commons Attribution 3.0 (CC BY) Unported licence, which permits unrestricted use, distribution, and reproduction in any medium, provided that attribution to the author(s), the title of the work, the Internet Archaeology journal and the relevant URL/DOI are given.
Terms and Conditions | Legal Statements | Privacy Policy | Cookies Policy | Citing Internet Archaeology
Internet Archaeology content is preserved for the long term with the Archaeology Data Service (ROR). Help sustain and support open access publication by donating to our Open Access Archaeology Fund.