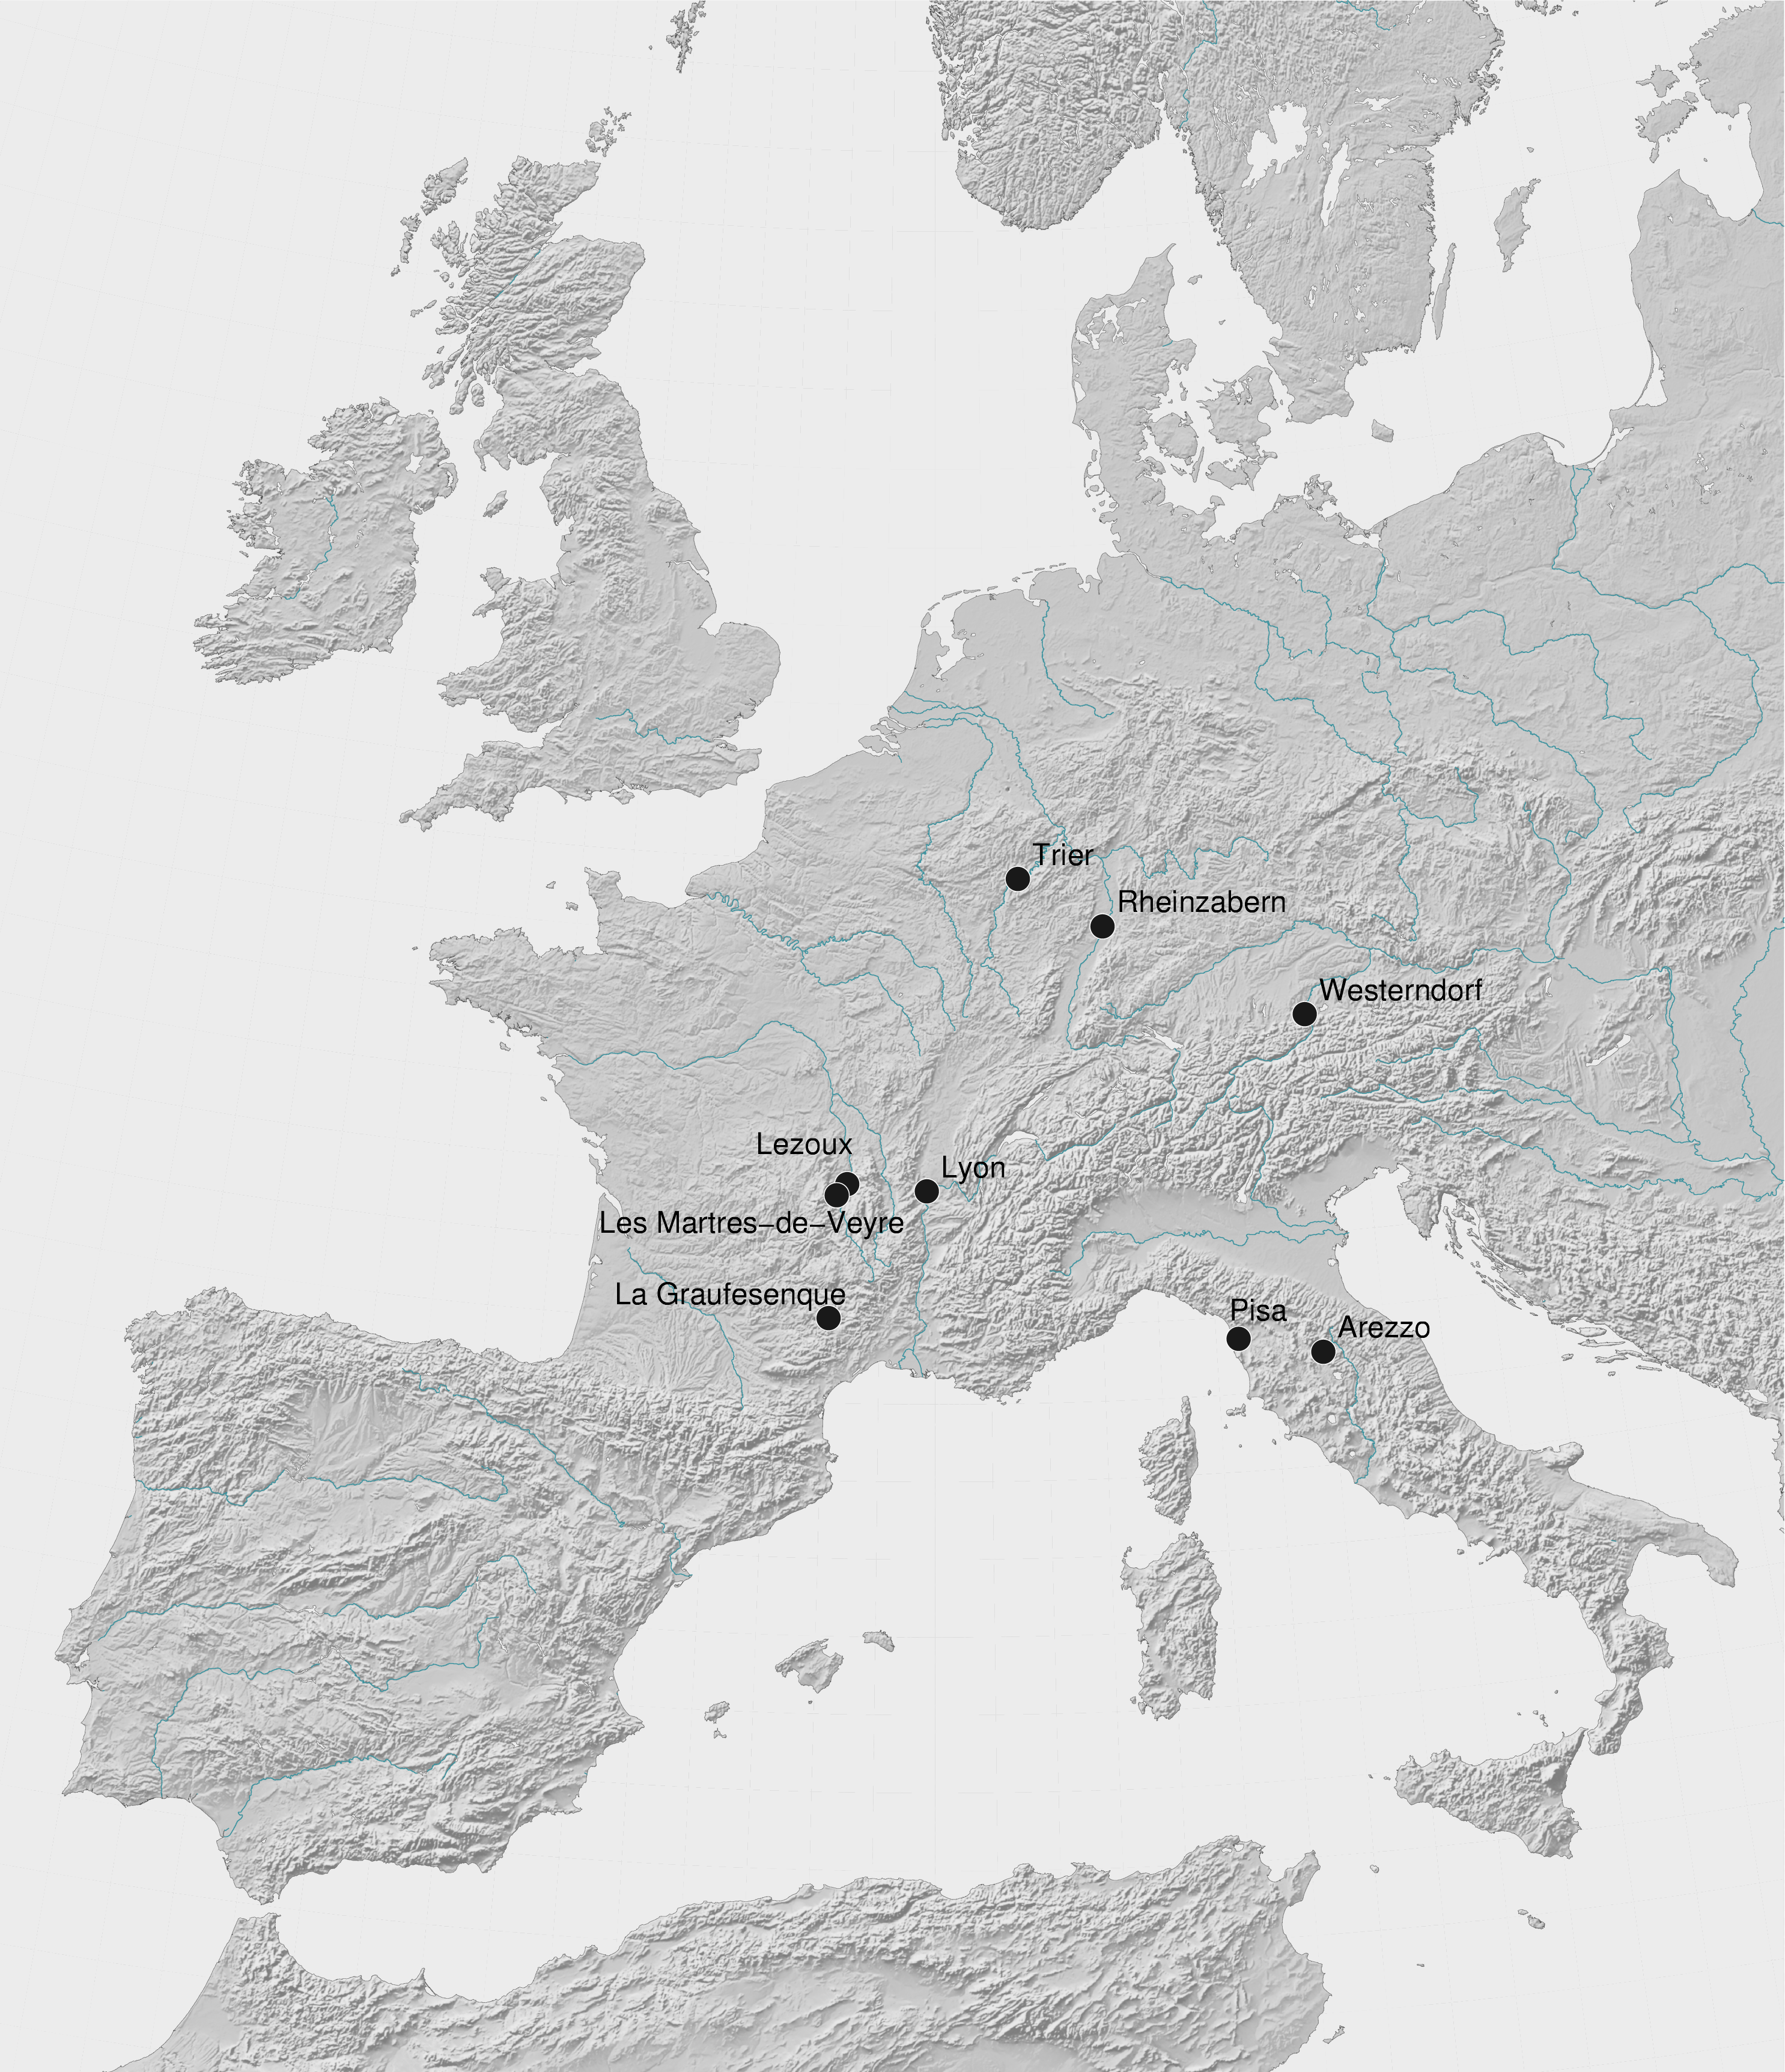
Figure 1: Distribution of the principal samian kiln sites in Italy and the north-west Roman Empire.
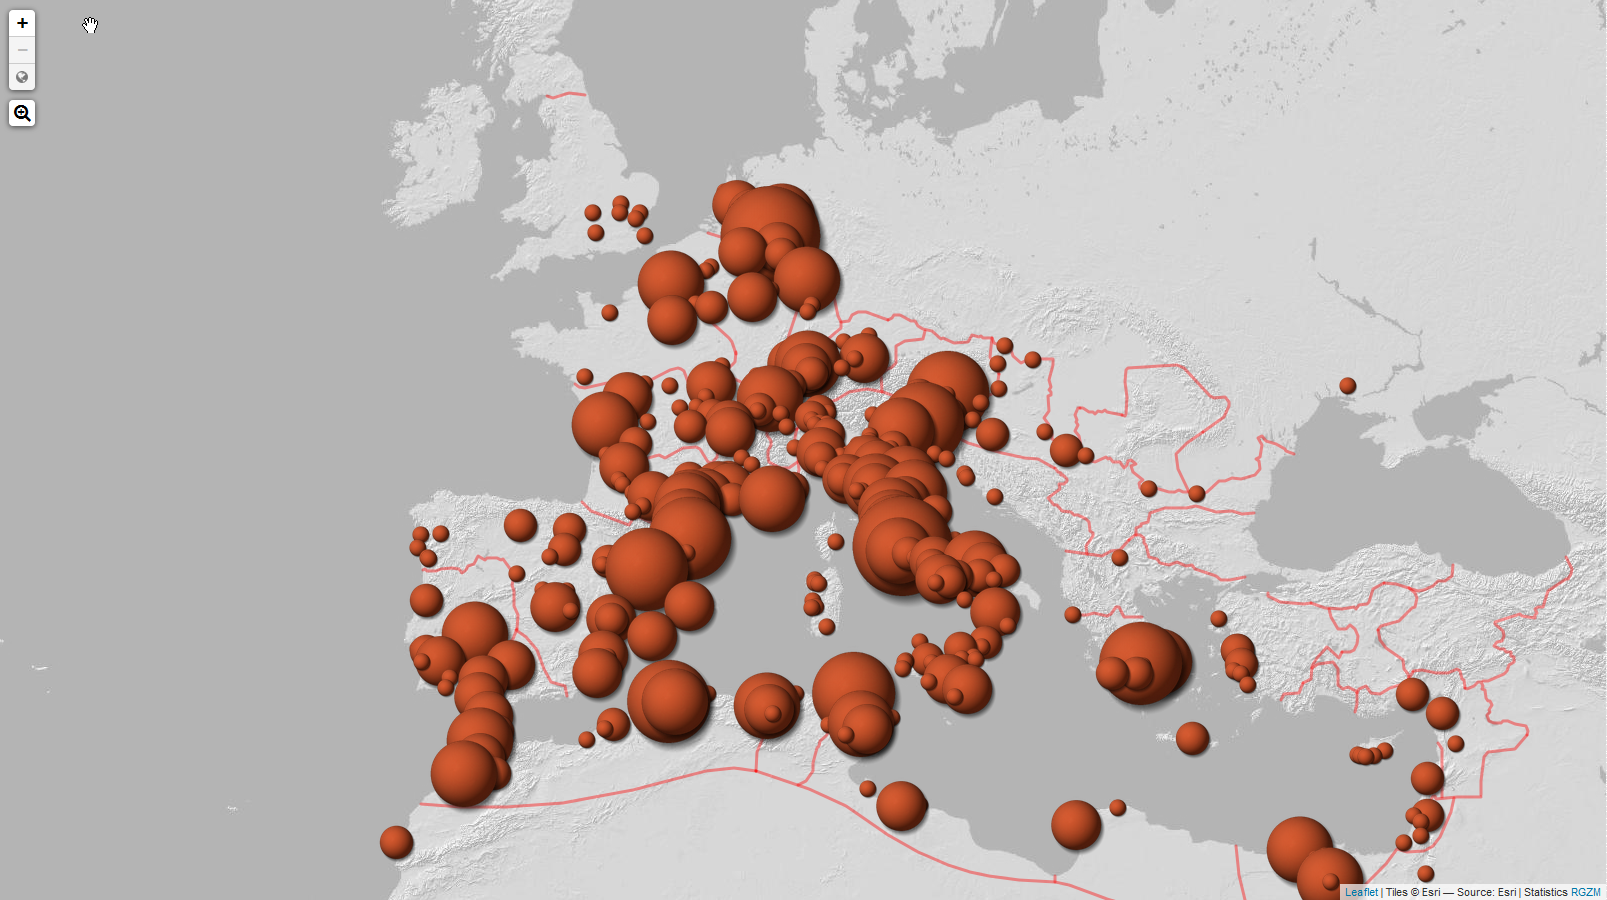
Figure 2: Distribution map of the samian stamps produced at Arezzo (eastern Tuscany, Italy) showing relative frequencies. Maps generated at http://www.rgzm.de/samian (02.12.2016).
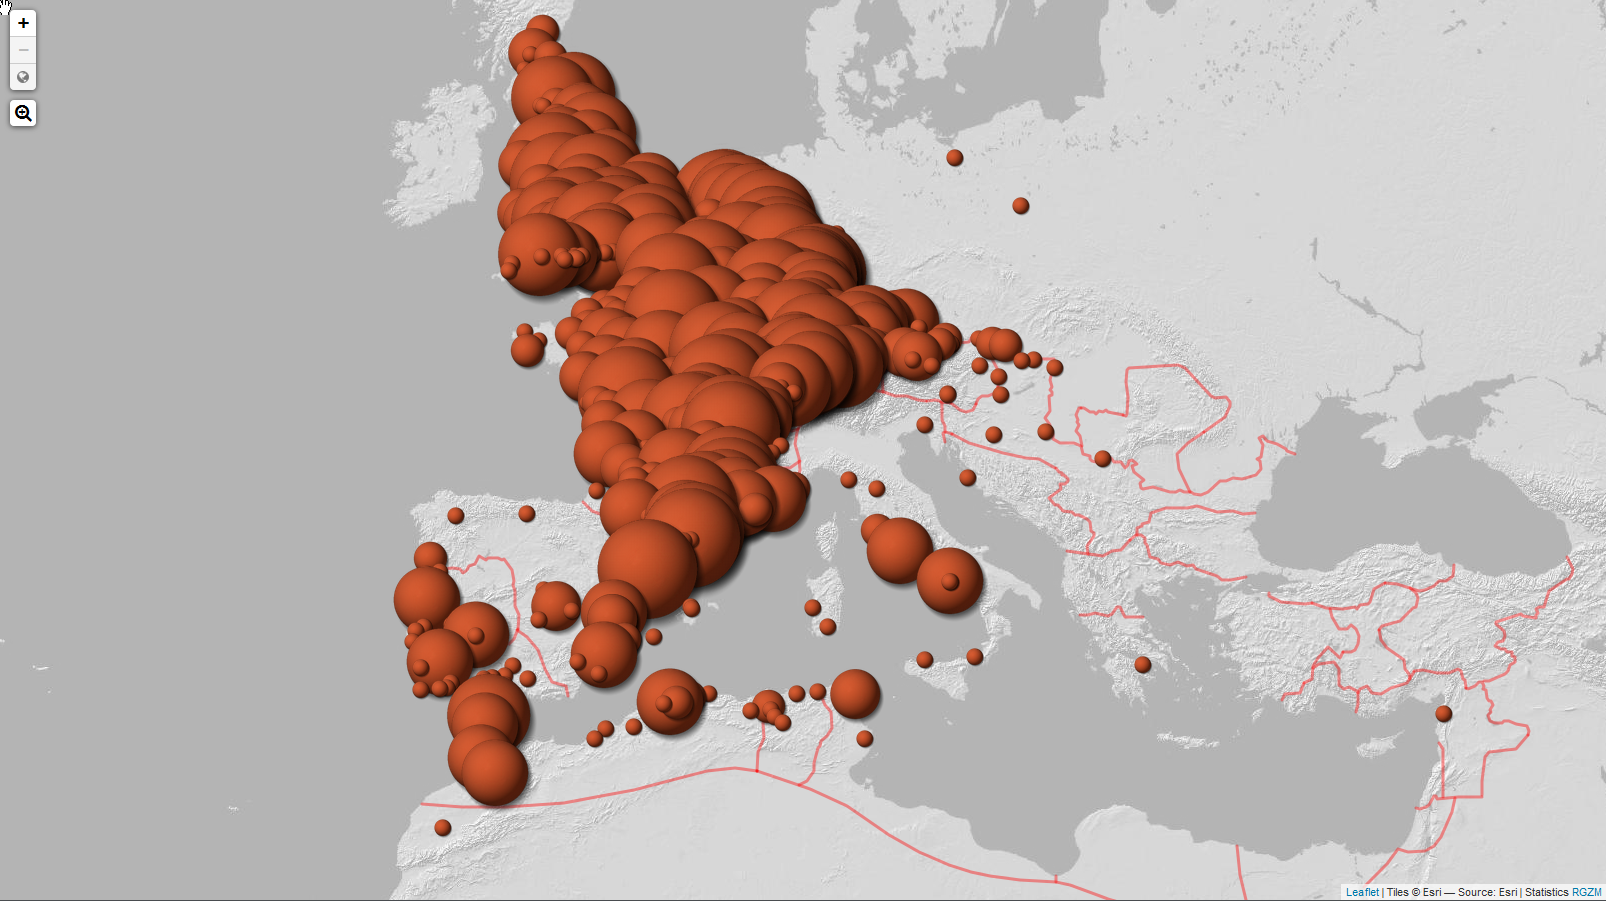
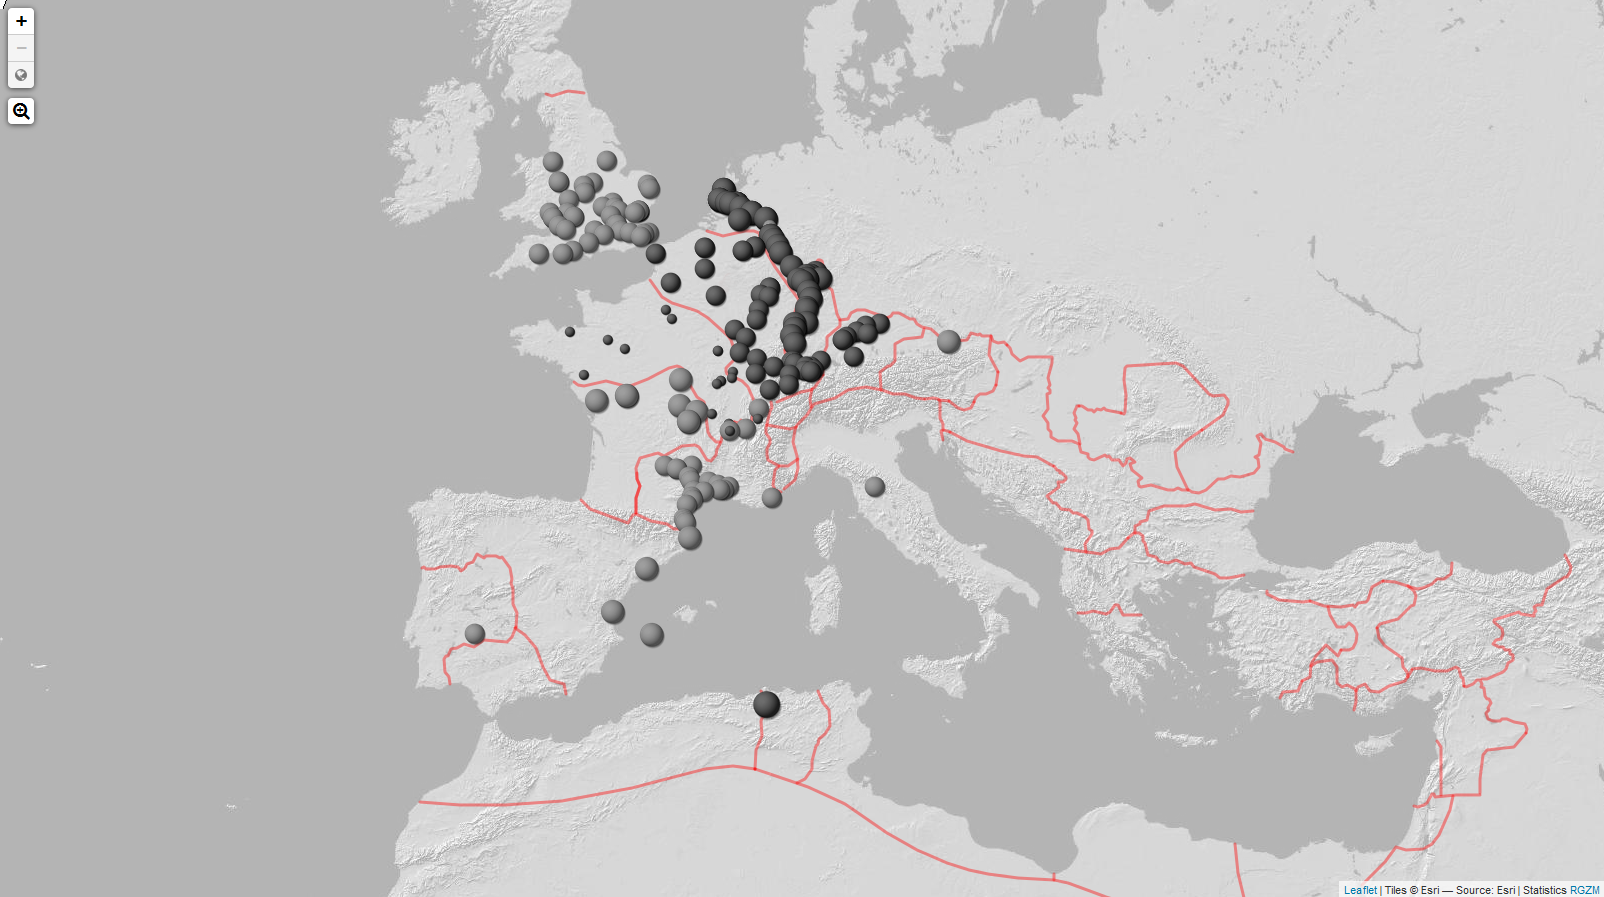
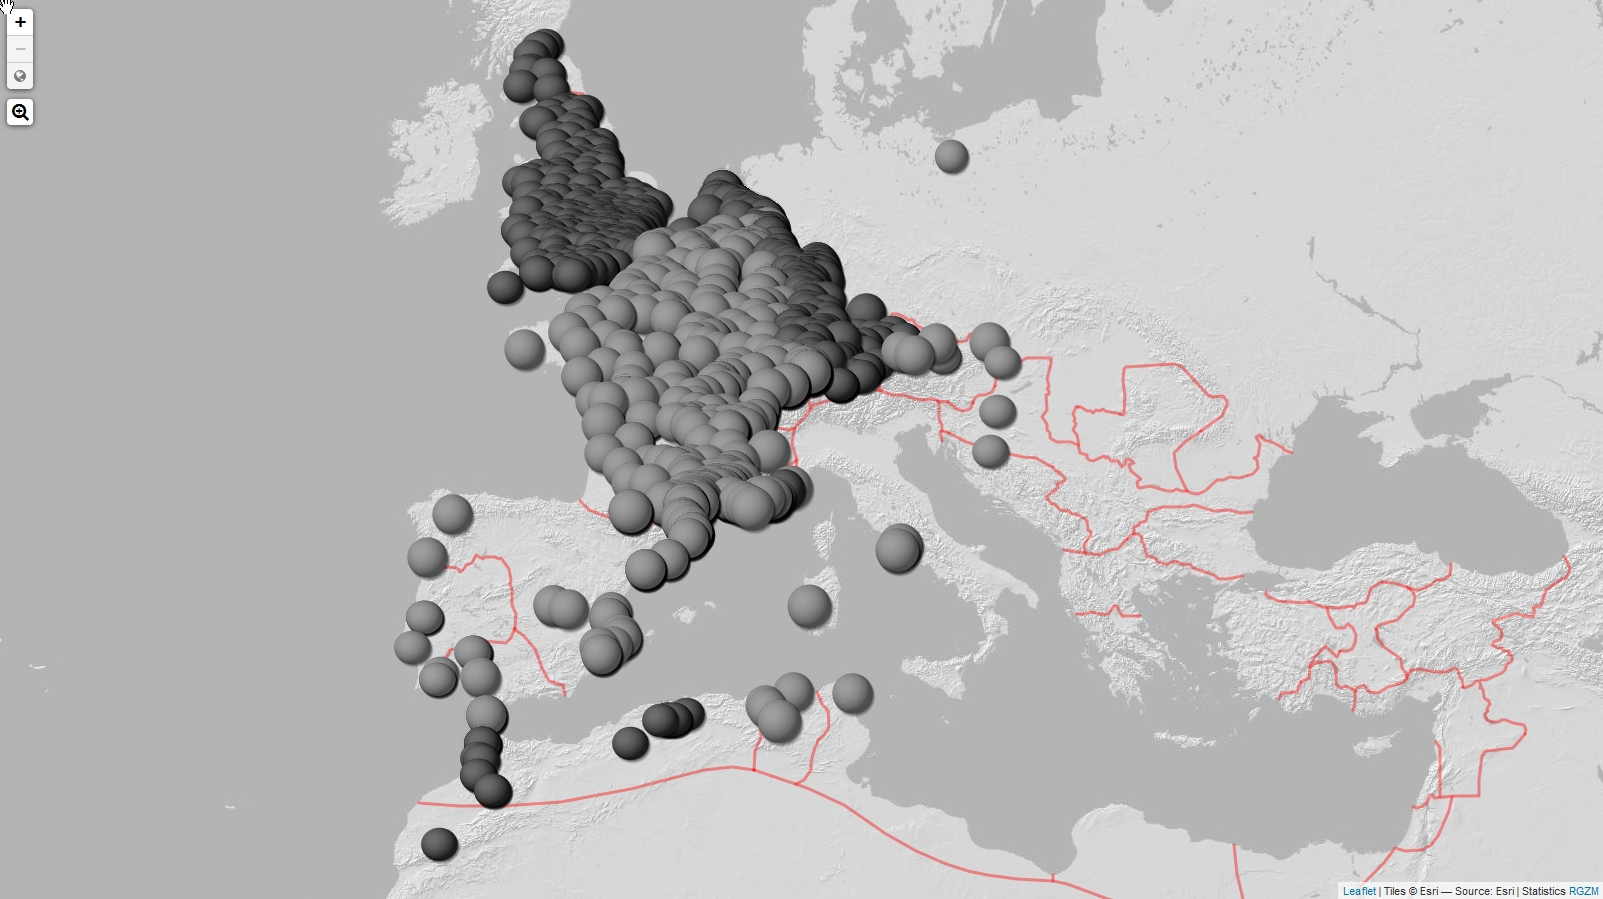
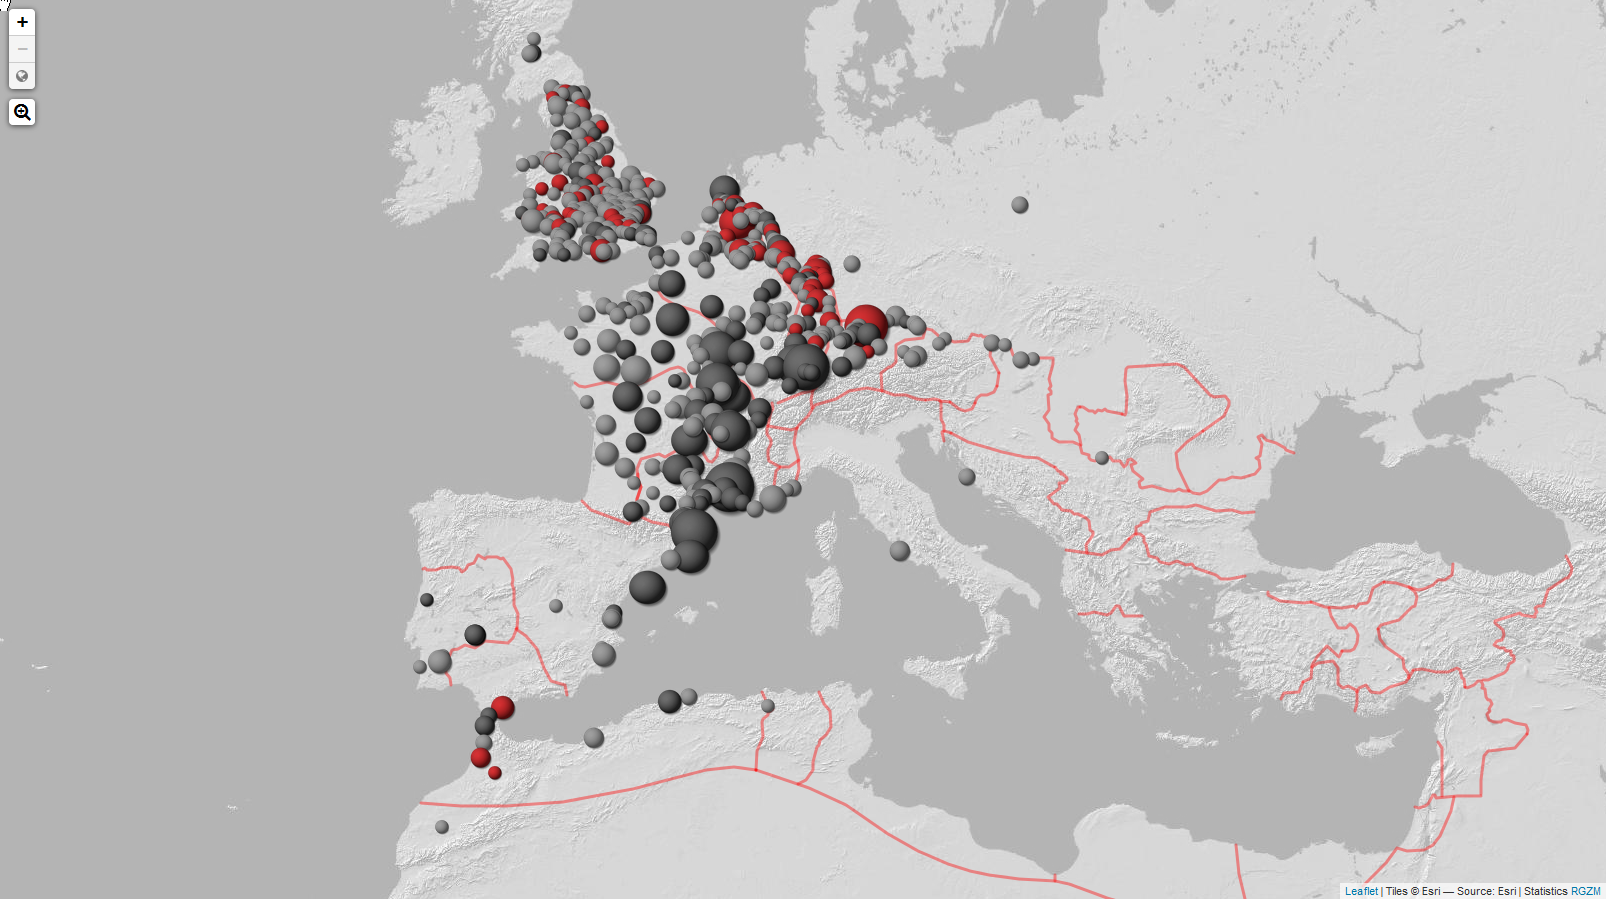
Figure 3: Distribution map of the samian stamps produced at La Graufesenque (southern France) showing relative frequencies. Maps generated at http://www.rgzm.de/samian (02.12.2016).
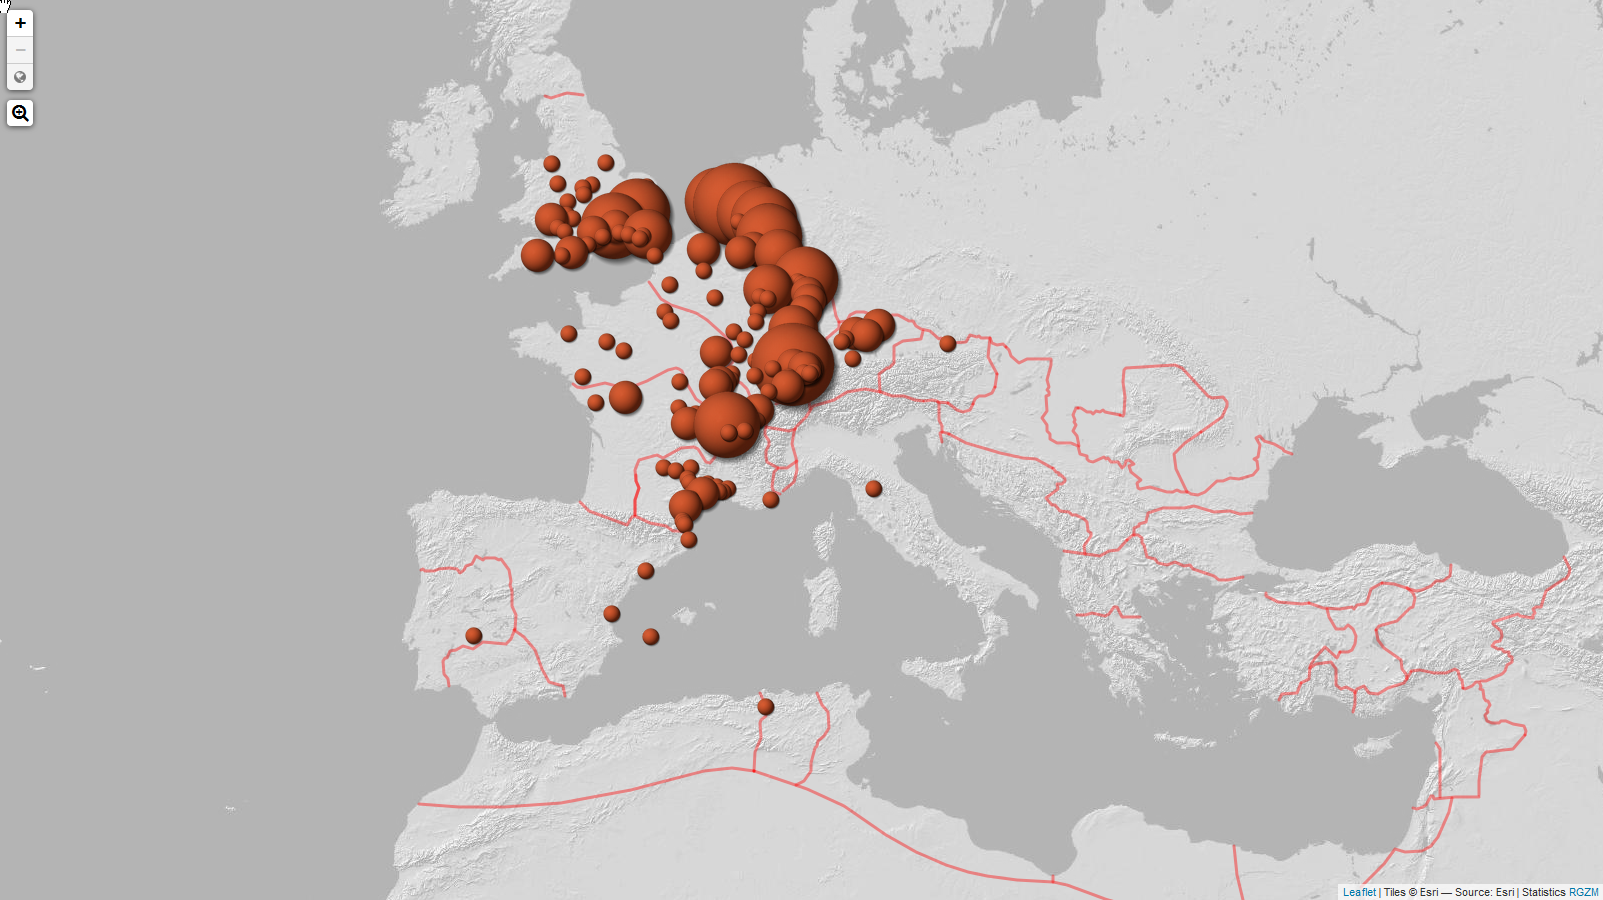
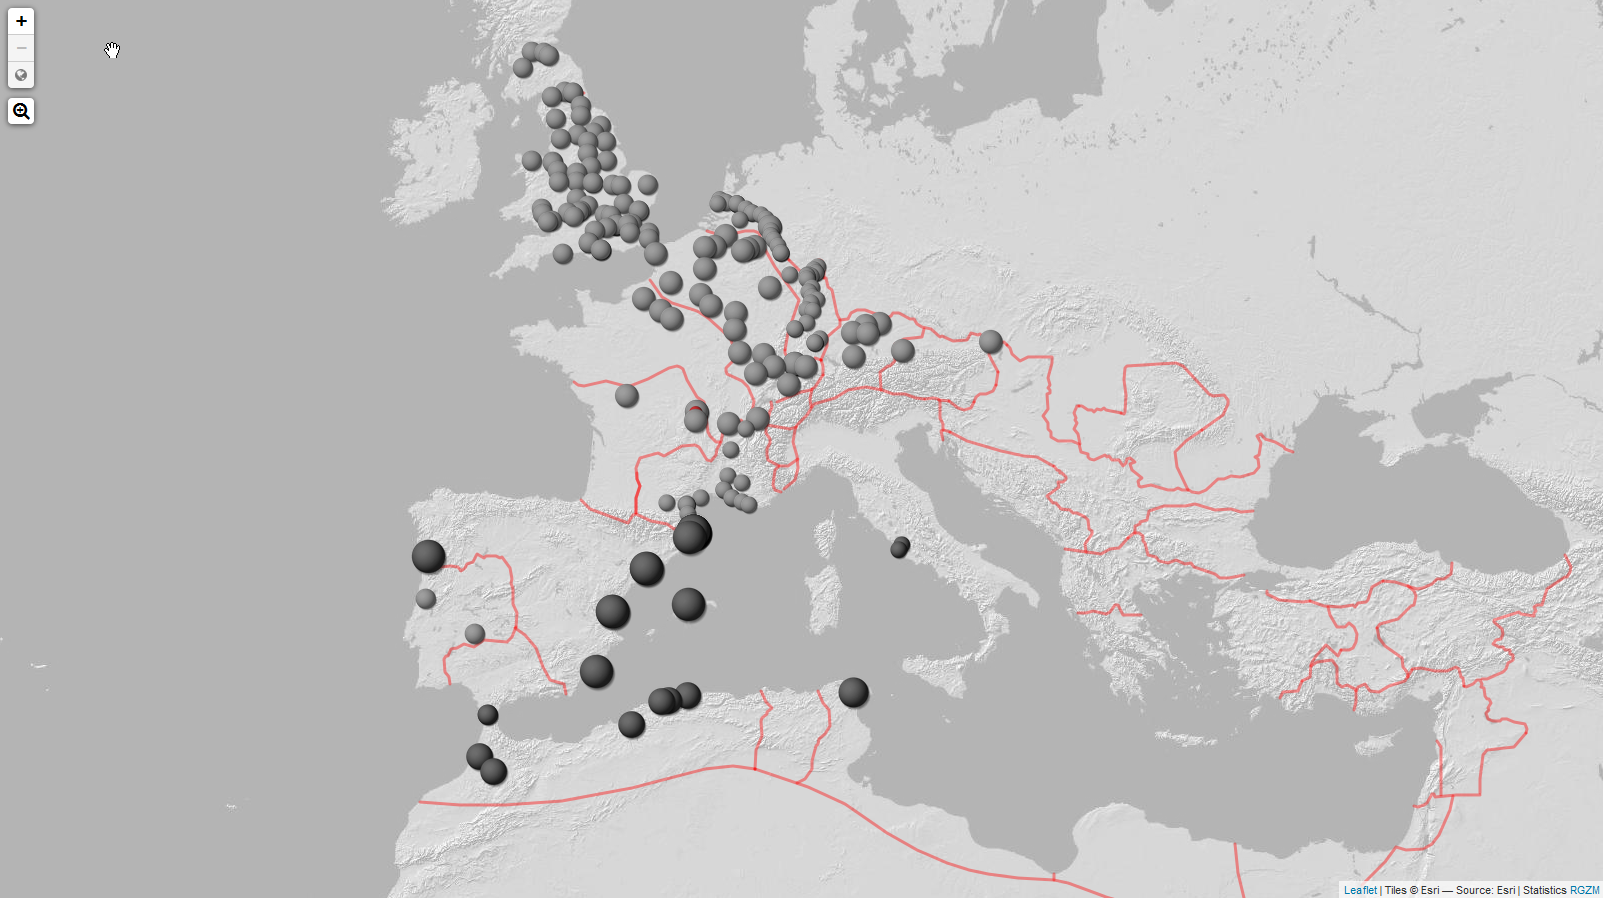
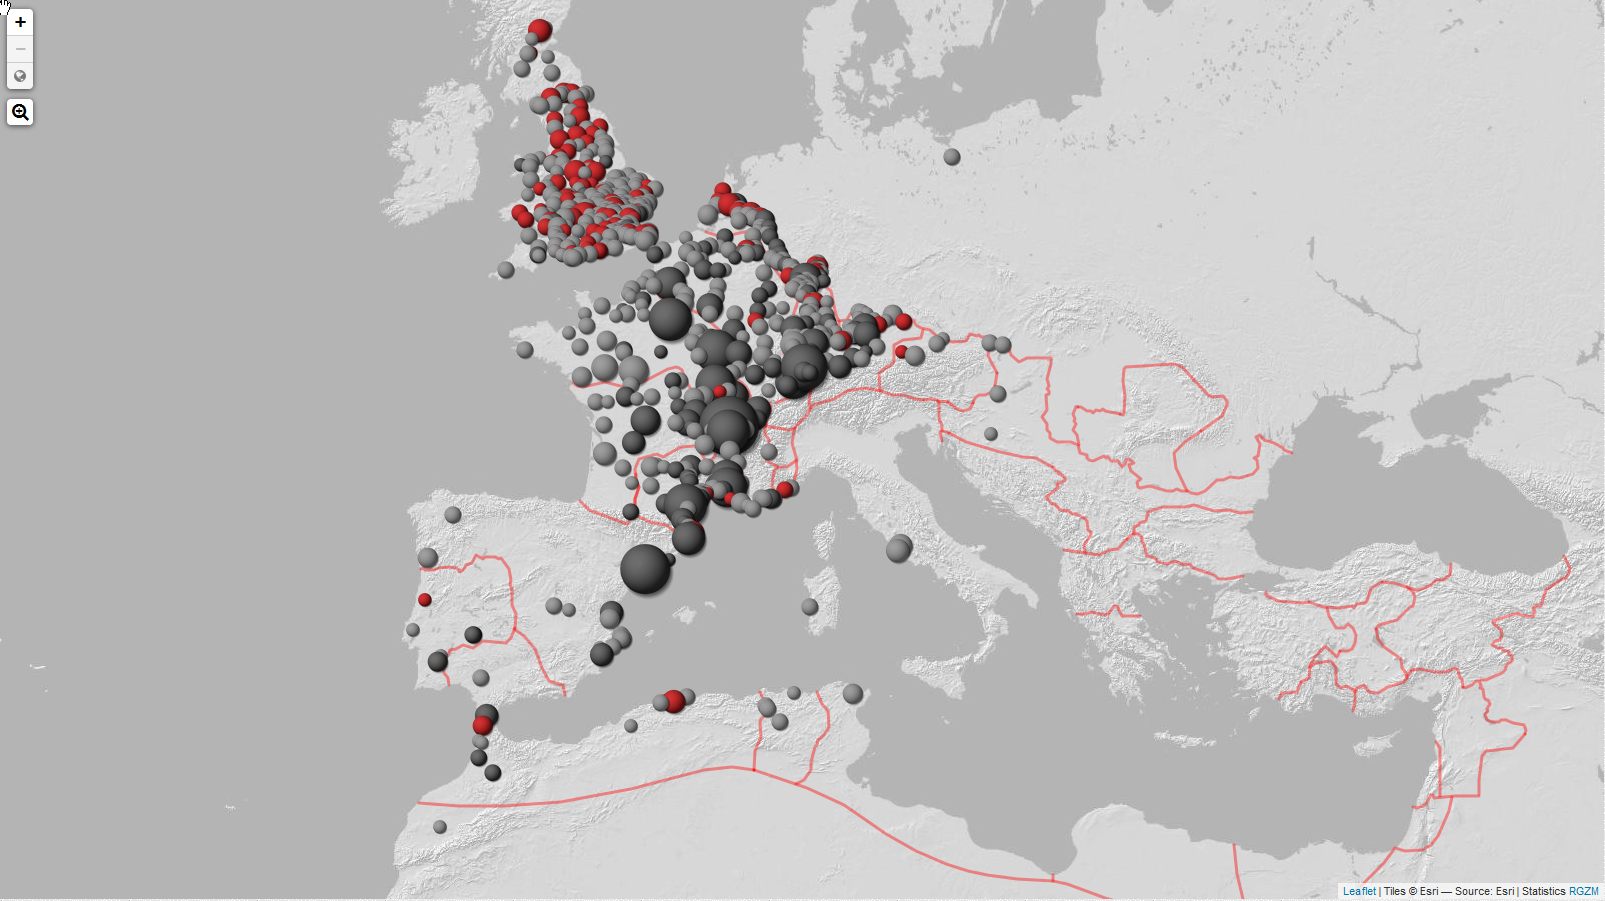
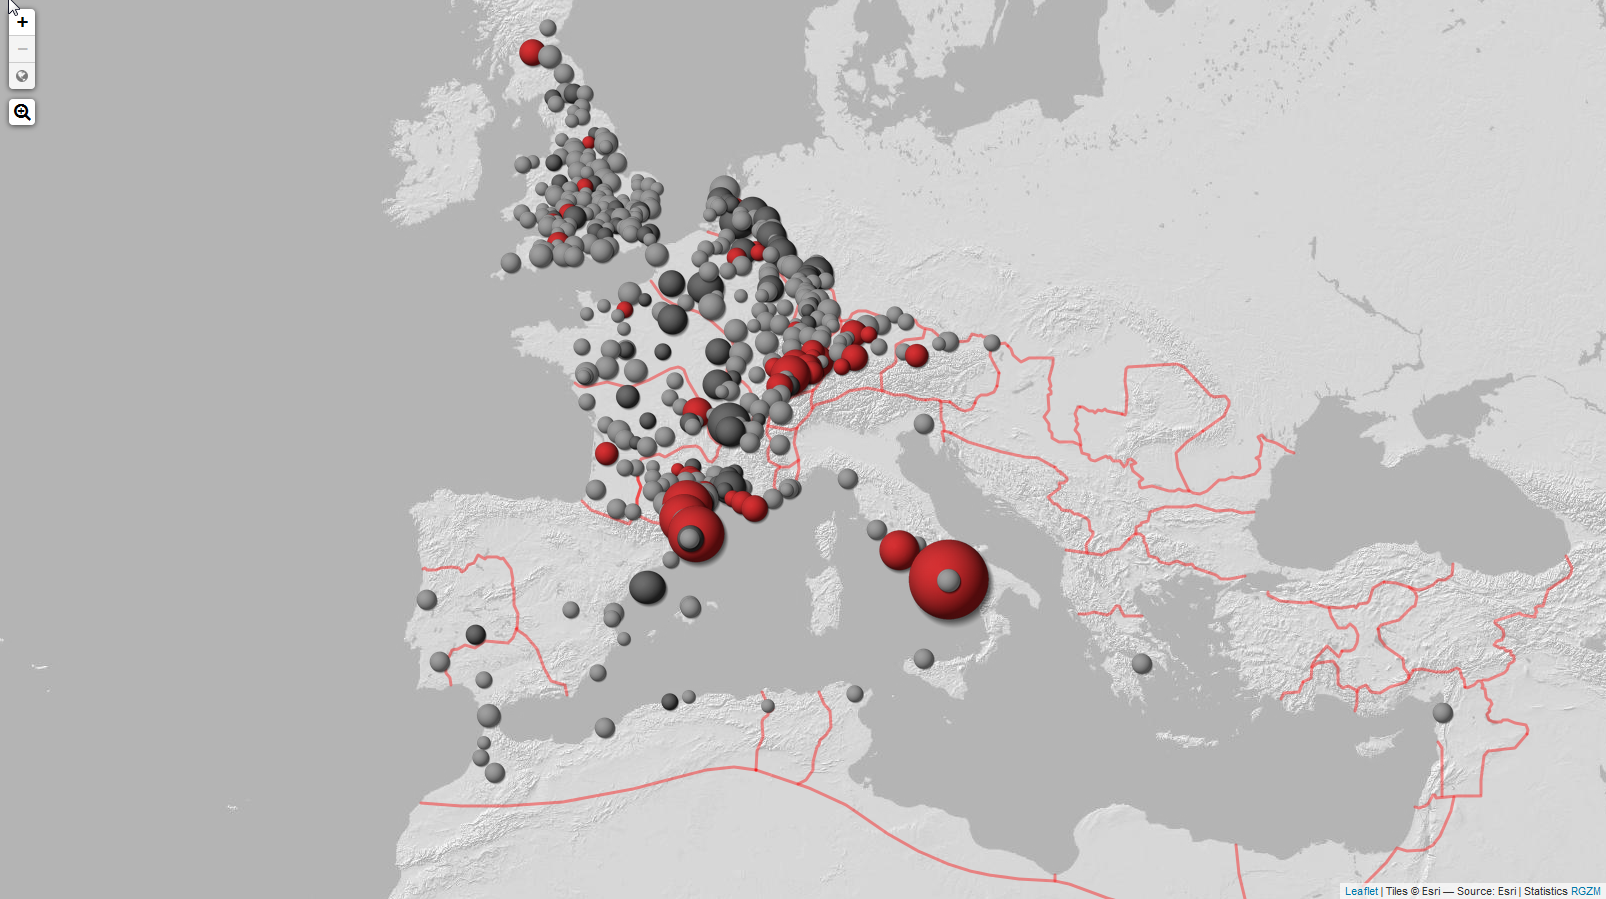
Figure 4: Distribution map of the samian made by the potter Aquitanus, from La Graufesenque (southern France), showing relative frequencies. Maps generated at http://www.rgzm.de/samian (02.12.2016).
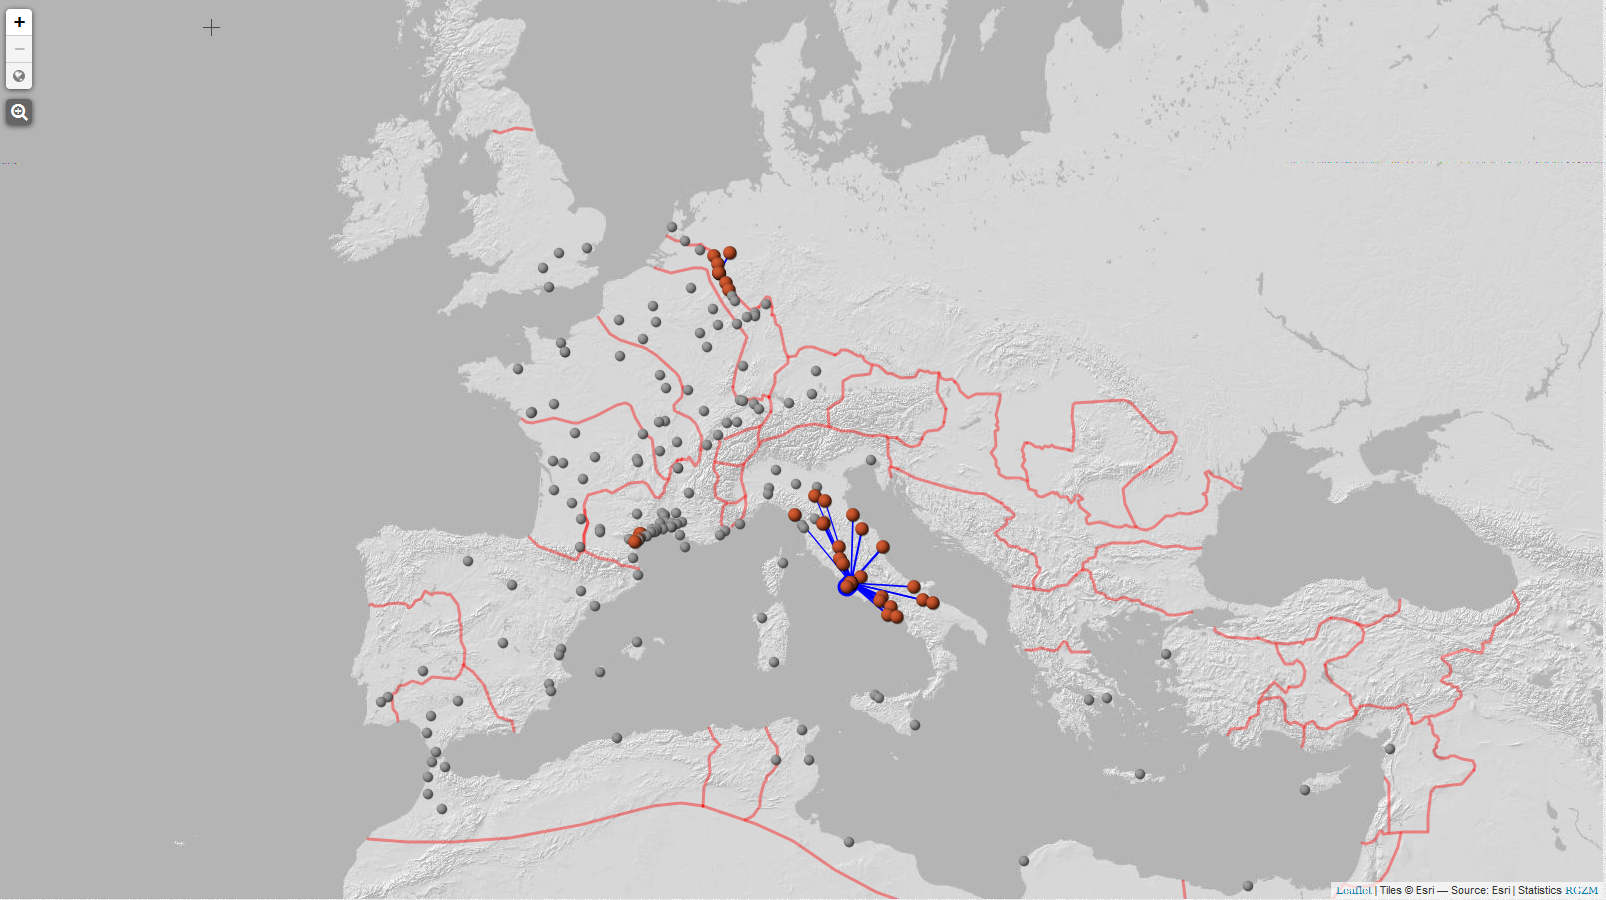
Figure 5: Network analysis map of the stamped exported samian of Ateius (5), from Arezzo (eastern Tuscany, Italy). Sites with an observed number of pots greater than the expected value and a 'Network Density Value' of 0.8 are indicated with a red dot and a blue line is drawn between the two sites. Hubs of samian trade with high correlations with adjacent sites comprising significant frequencies of Ateius (5) can be distinguished at Rome, Narbonne and Neuss. Sites with less than 5 occurrences are ignored (cf. Section 3). Red lines indicate province boundaries. Maps generated at http://www.rgzm.de/samian (02.12.2016).
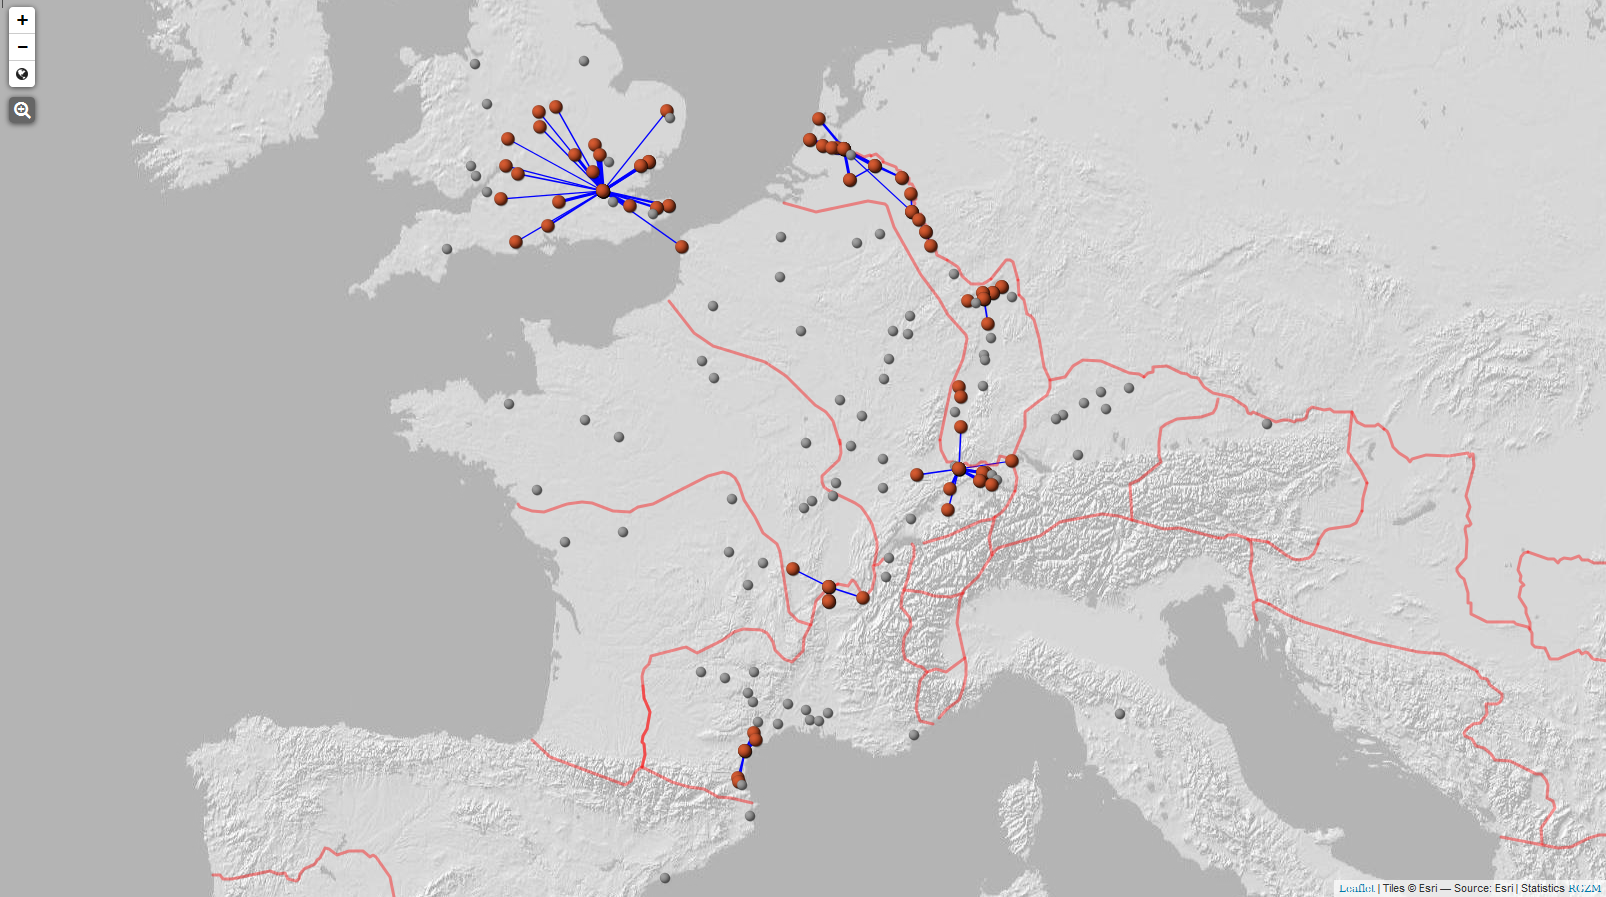
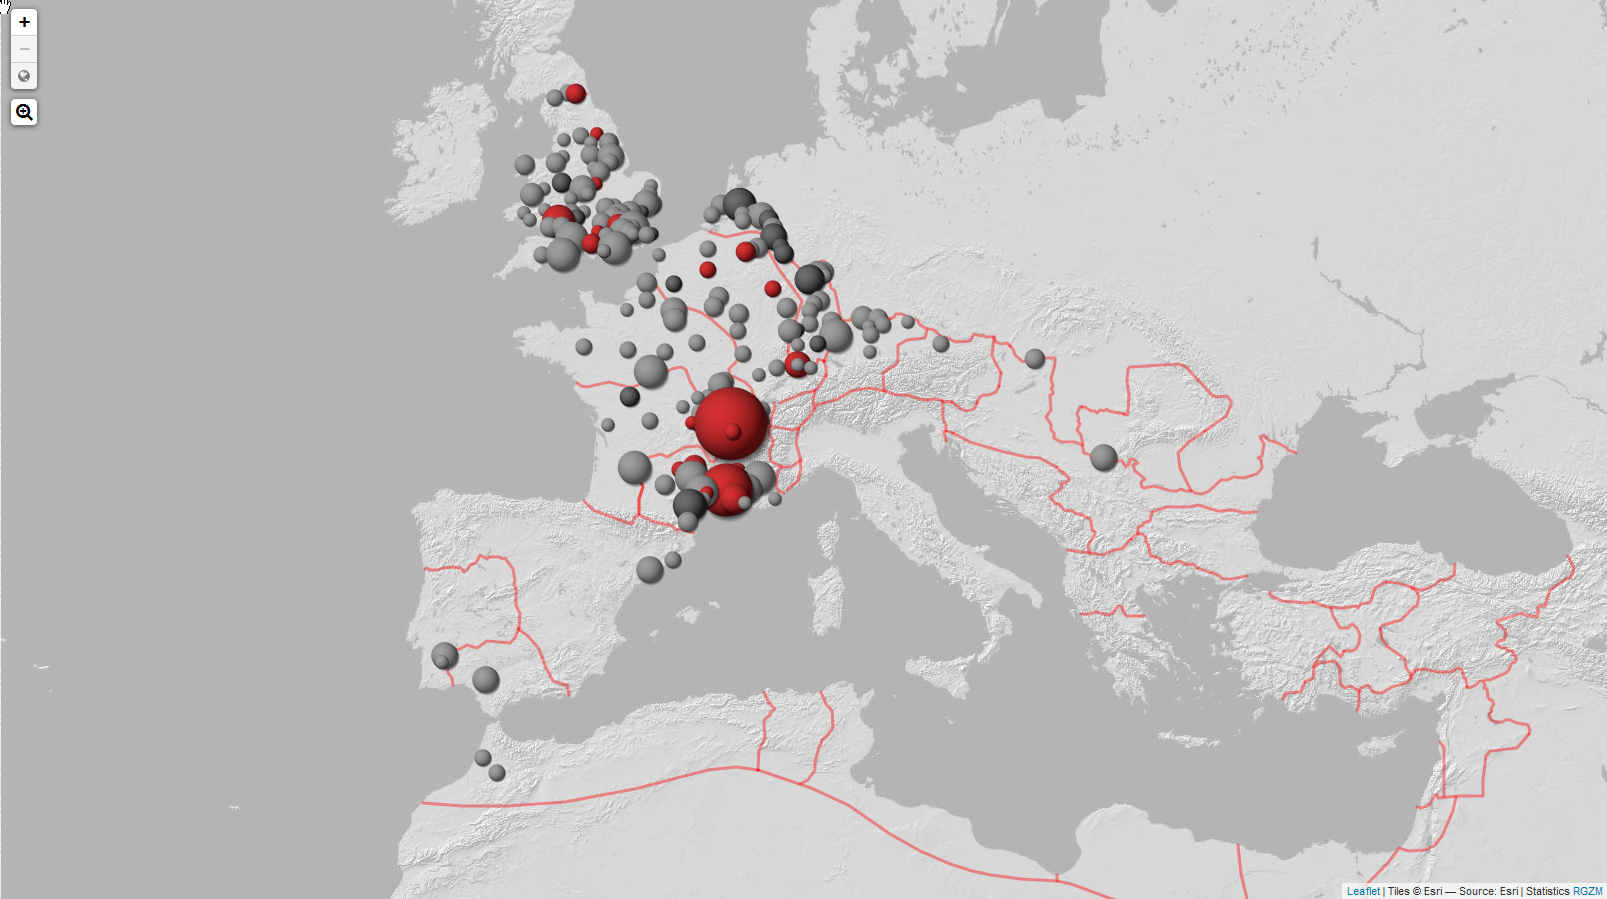
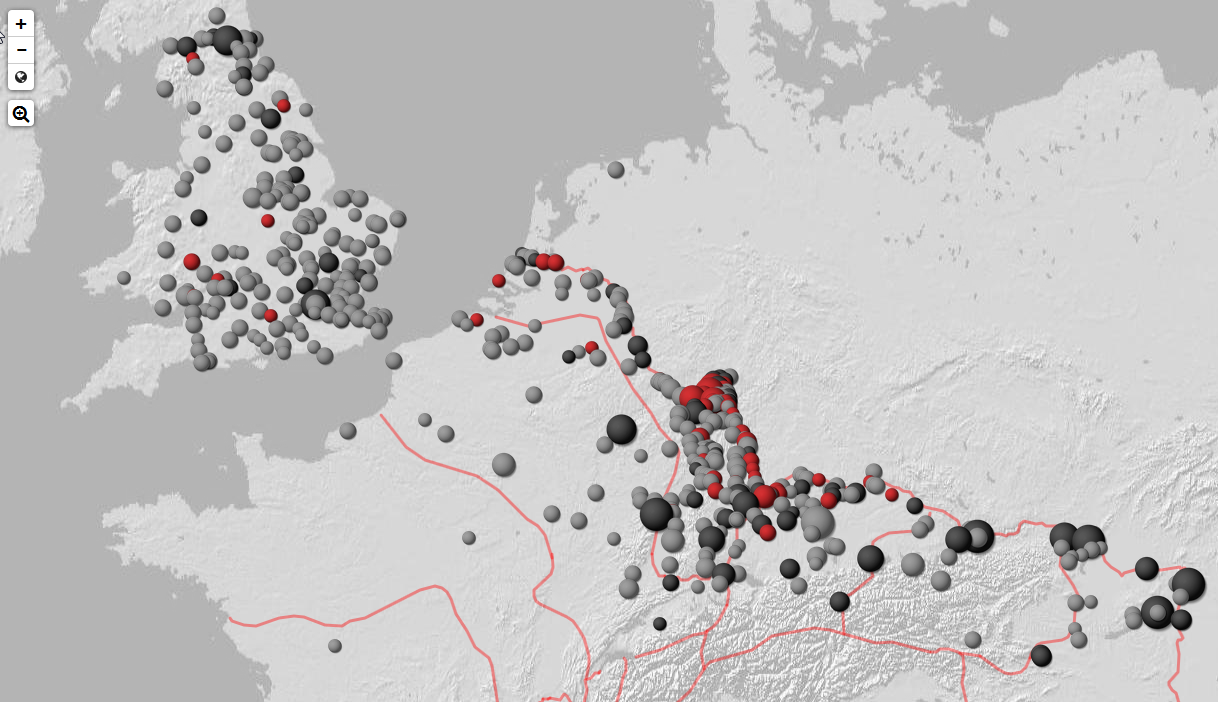
Figure 6: Network analysis map of the stamped exported samian of Aquitanus, from La Graufesenque (southern France). Sites with an observed number of pots greater than the expected value and a 'Network Density Value' of 0.4 are indicated with a red dot and a blue line is drawn between the two sites. Hubs of samian trade with high correlations with adjacent sites comprising significant frequencies of Aquitanus can be distinguished at London, Vechten, Mainz, Augst, Lyon and Narbonne. Sites with less than 5 occurrences are ignored (cf. Section 3). Red lines indicate province boundaries. Maps generated at http://www.rgzm.de/samian (02.12.2016).
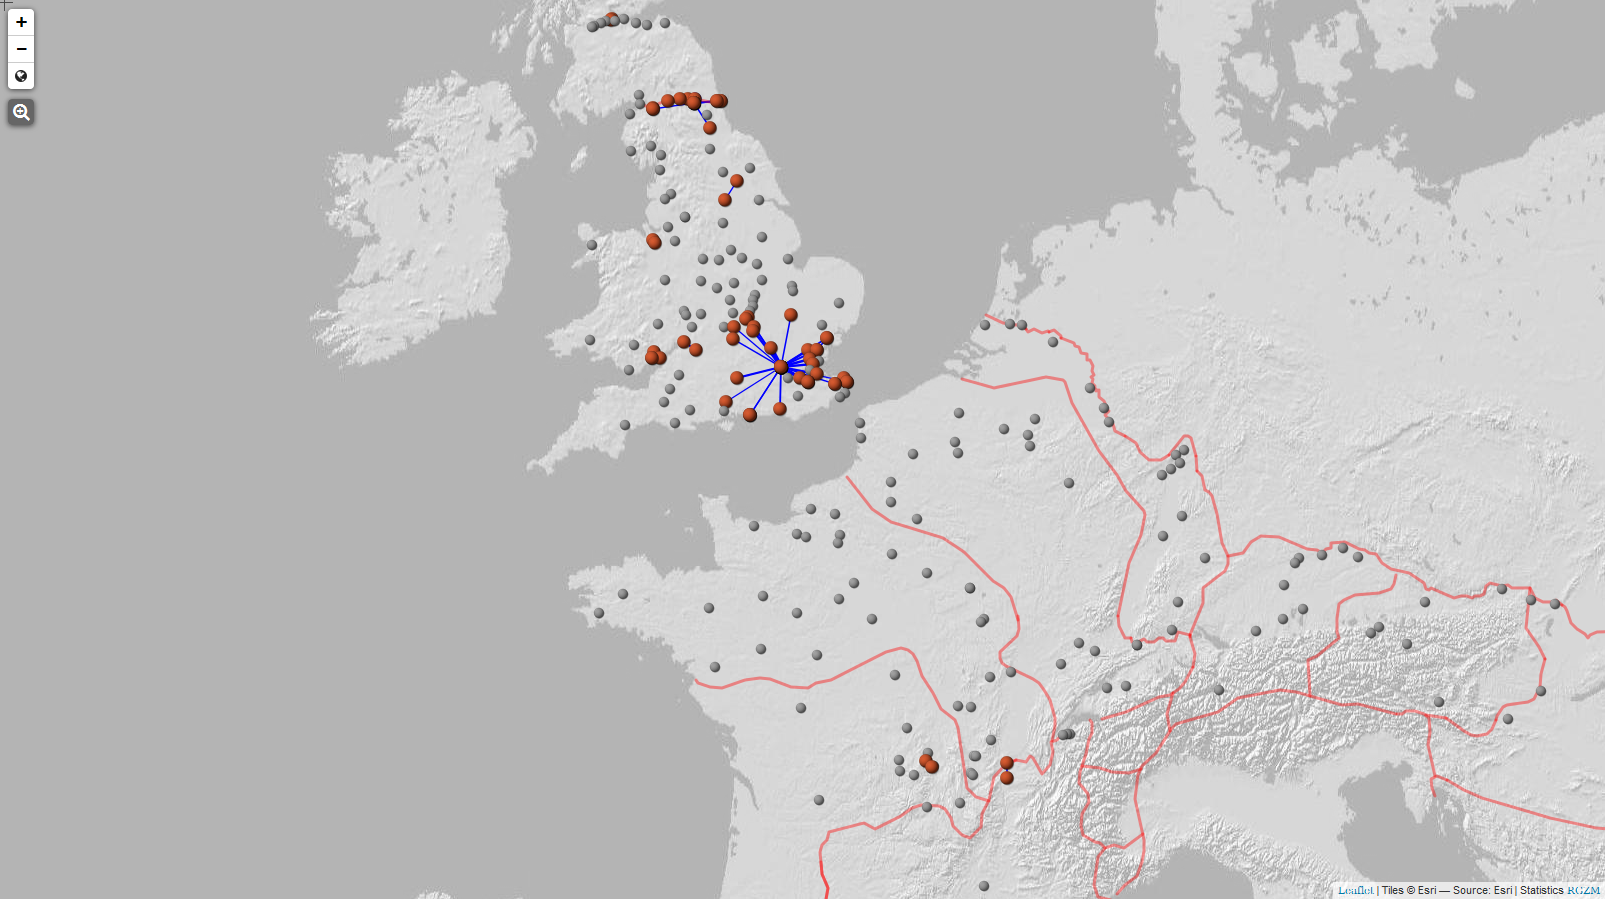
Figure 7: Network analysis map of the stamped exported samian of Cinnamus ii, from Lezoux (central France). Sites with an observed number of pots greater than the expected value and a 'Network Density Value' of 0.6 are indicated with a red dot and a blue line is drawn between the two sites. Hubs of samian trade with high correlations with adjacent sites comprising significant frequencies of Cinnamus ii can be distinguished at London and Corbridge. Sites with less than 5 occurrences are ignored (cf. Section 3). Red lines indicate province boundaries. Maps generated at http://www.rgzm.de/samian (02.12.2016).
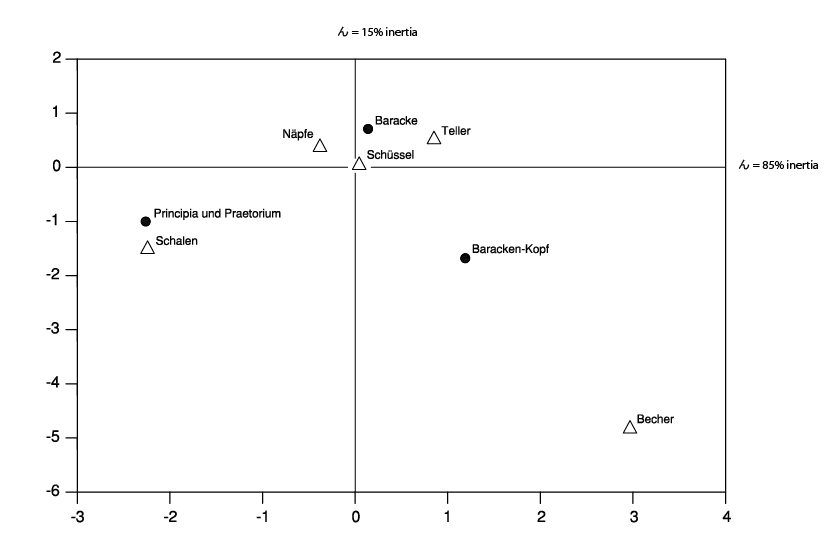
Figure 8: Correspondence Analysis of the occurrences of samian form categories in different parts of the Roman military camp Hofheim-Steinkastell. The inertia values explain the amount of variety explained by the two principal axes (Mees 2012, 74, fig. 27).
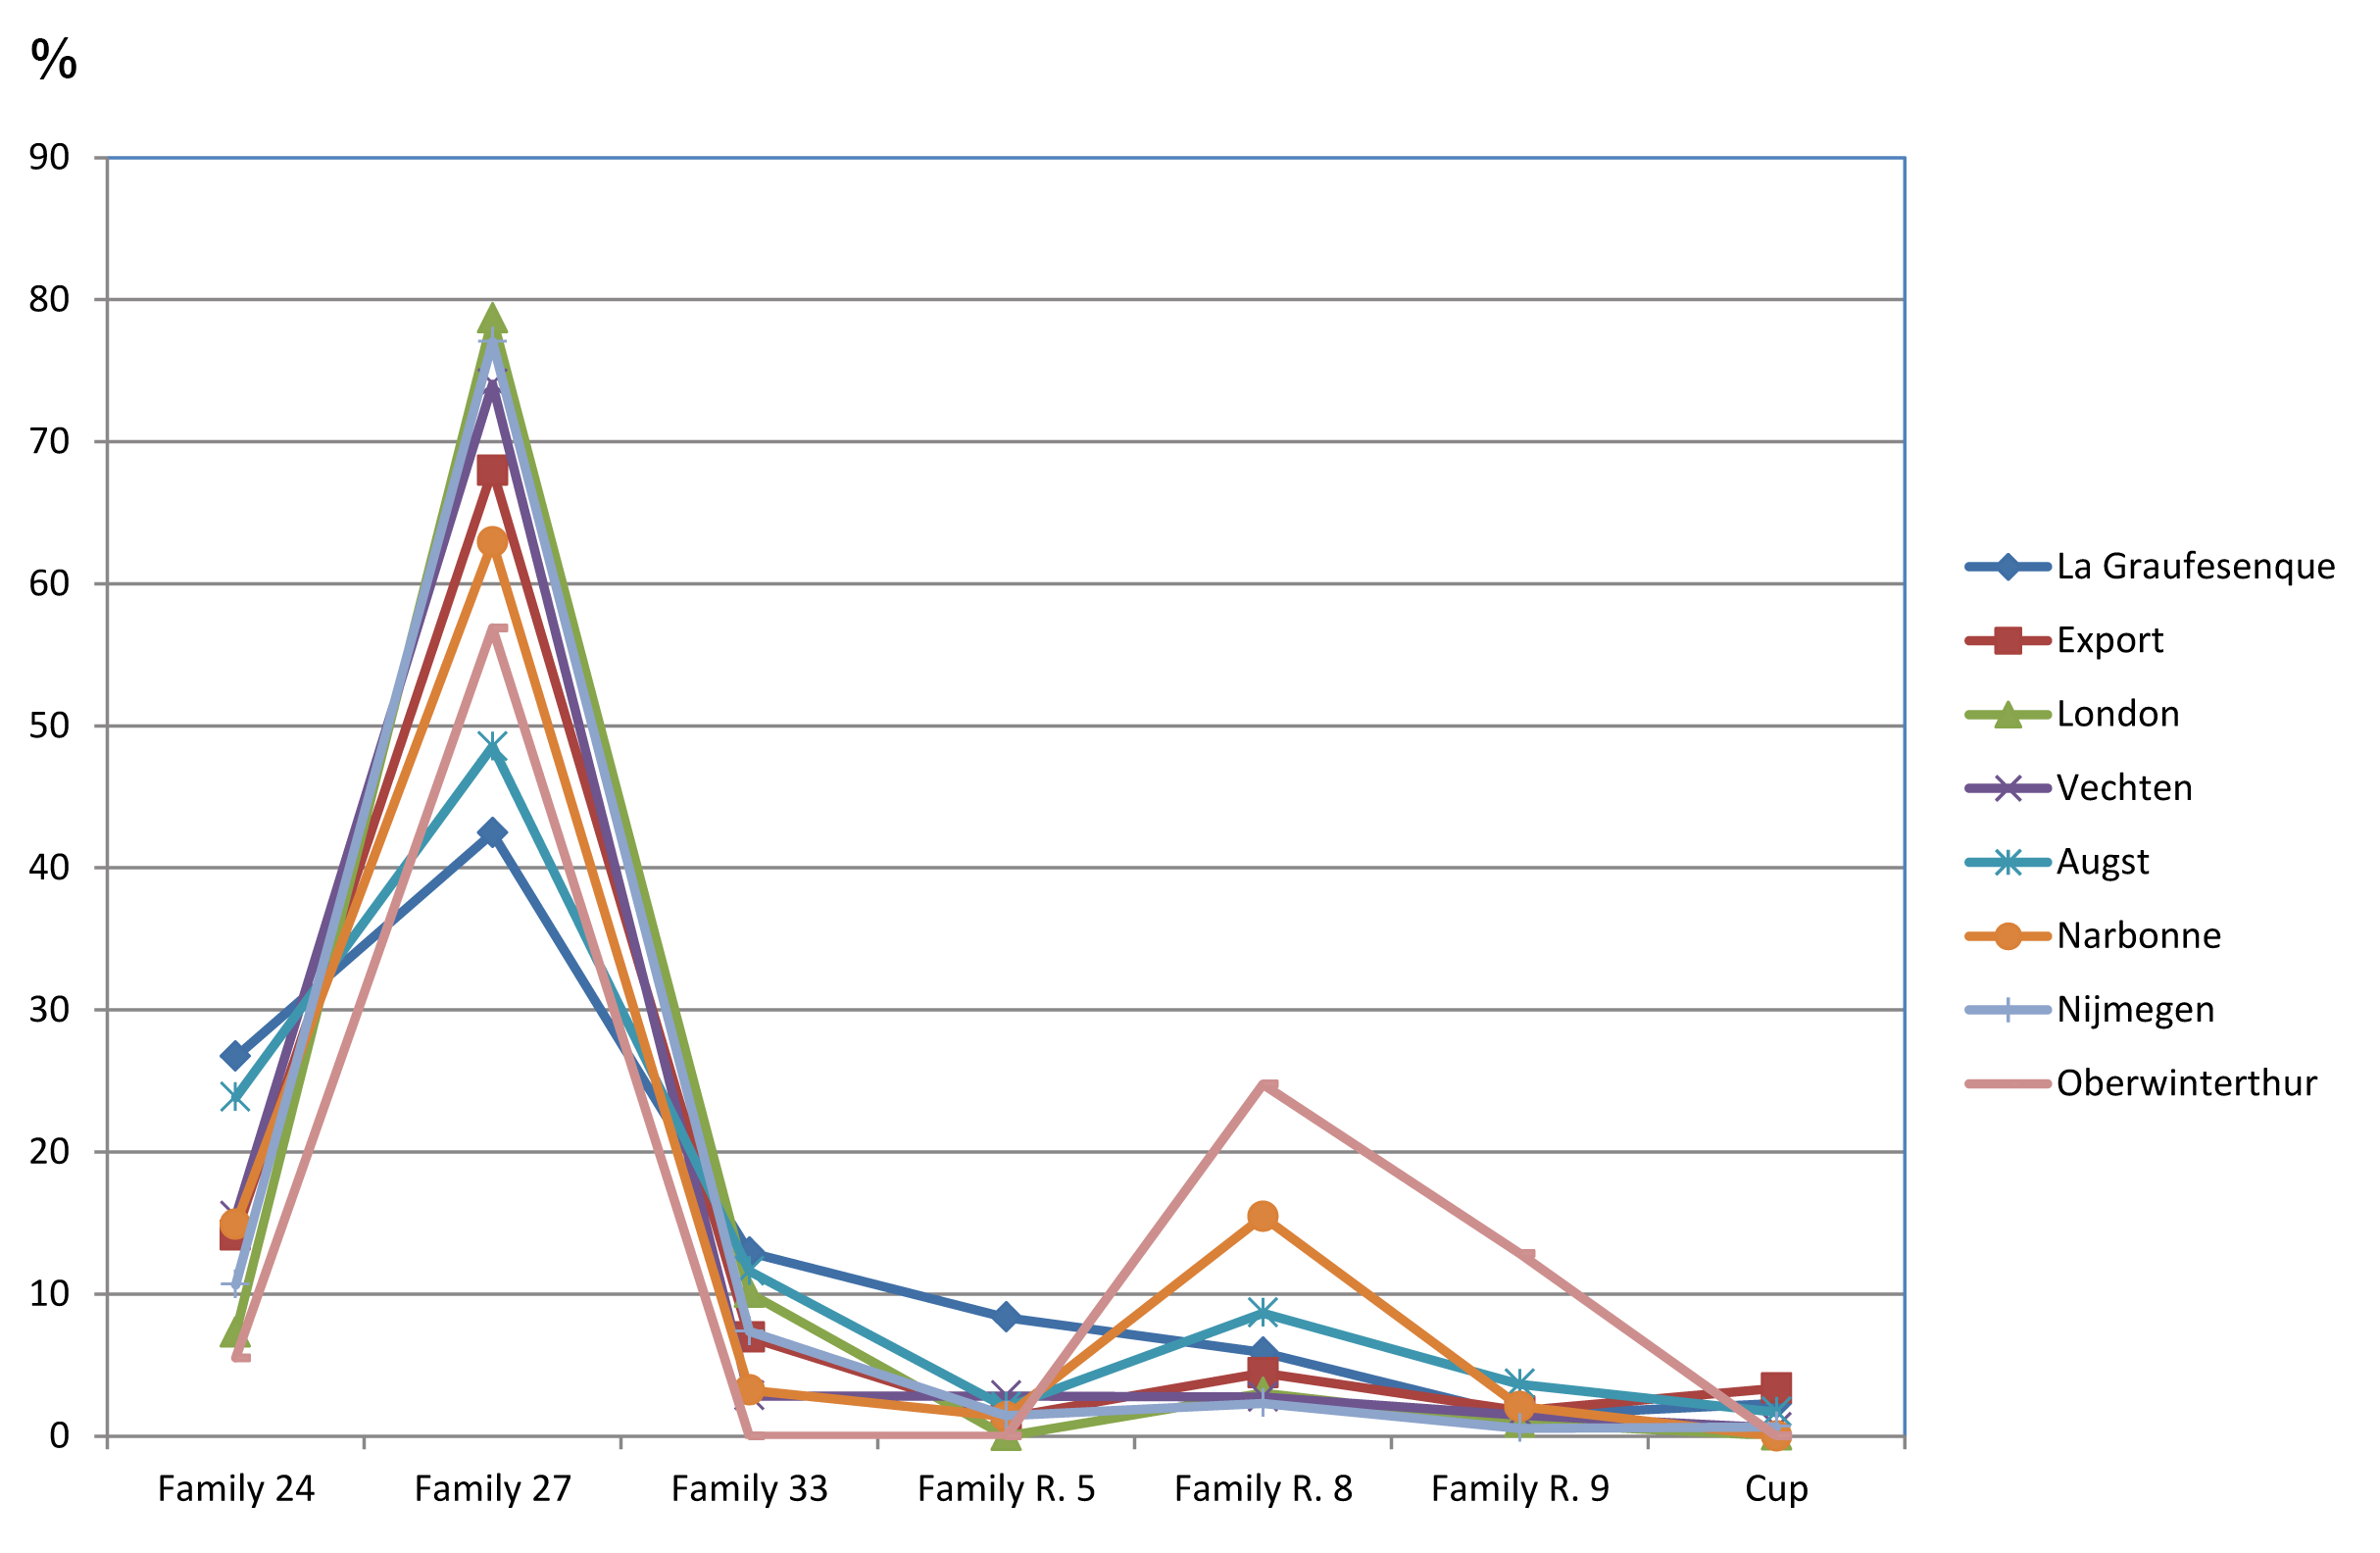
Figure 9: Overall percentages of general stamped samian vessel forms made in La Graufesenque on civil and military sites: London, Vechten, Augst, Narbonne, Nijmegen and Oberwinterthur. Chart generated at http://www.rgzm.de/samian (02.12.2016).
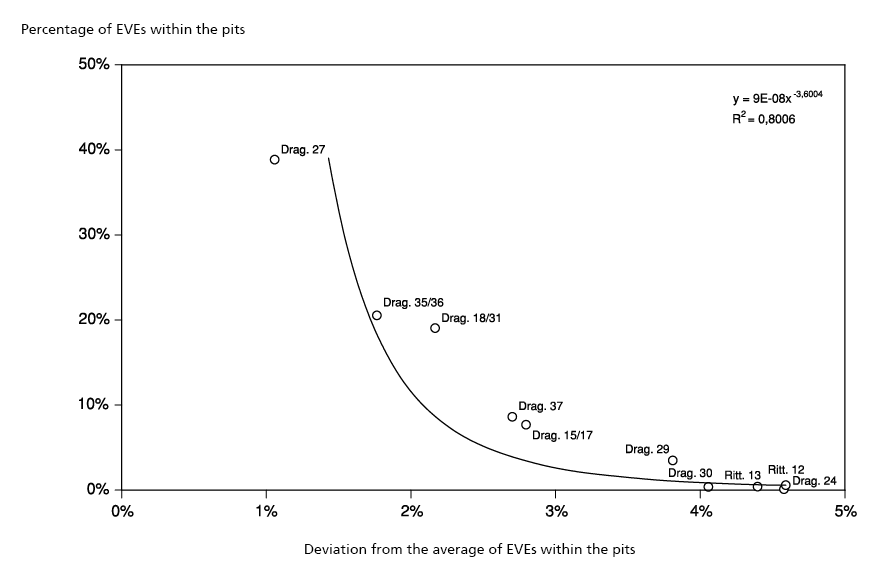
Figure 10: Percentages of vessel forms: average deviation in excavation pits in Hofheim-Steinkastell (after Mees 2012, fig. 26).
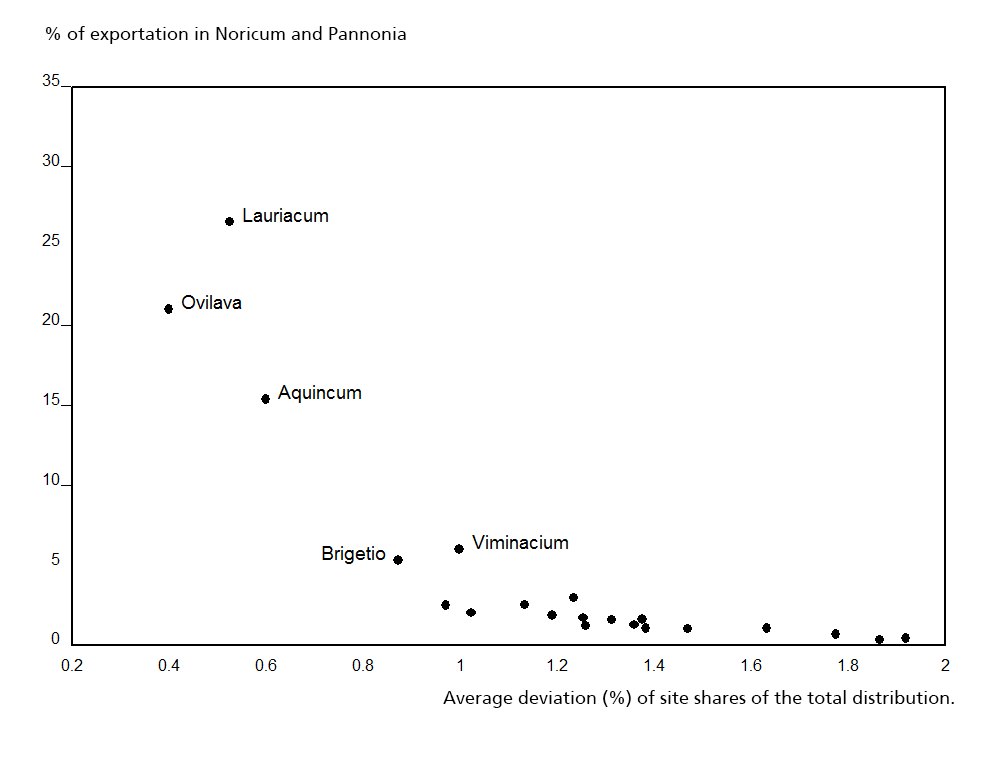
Figure 11: Percentages of the second and third century decorated samian distribution (y axis) and the volatility (x axis) within the Danube sites (after Mees 2002, 160, fig. 116).
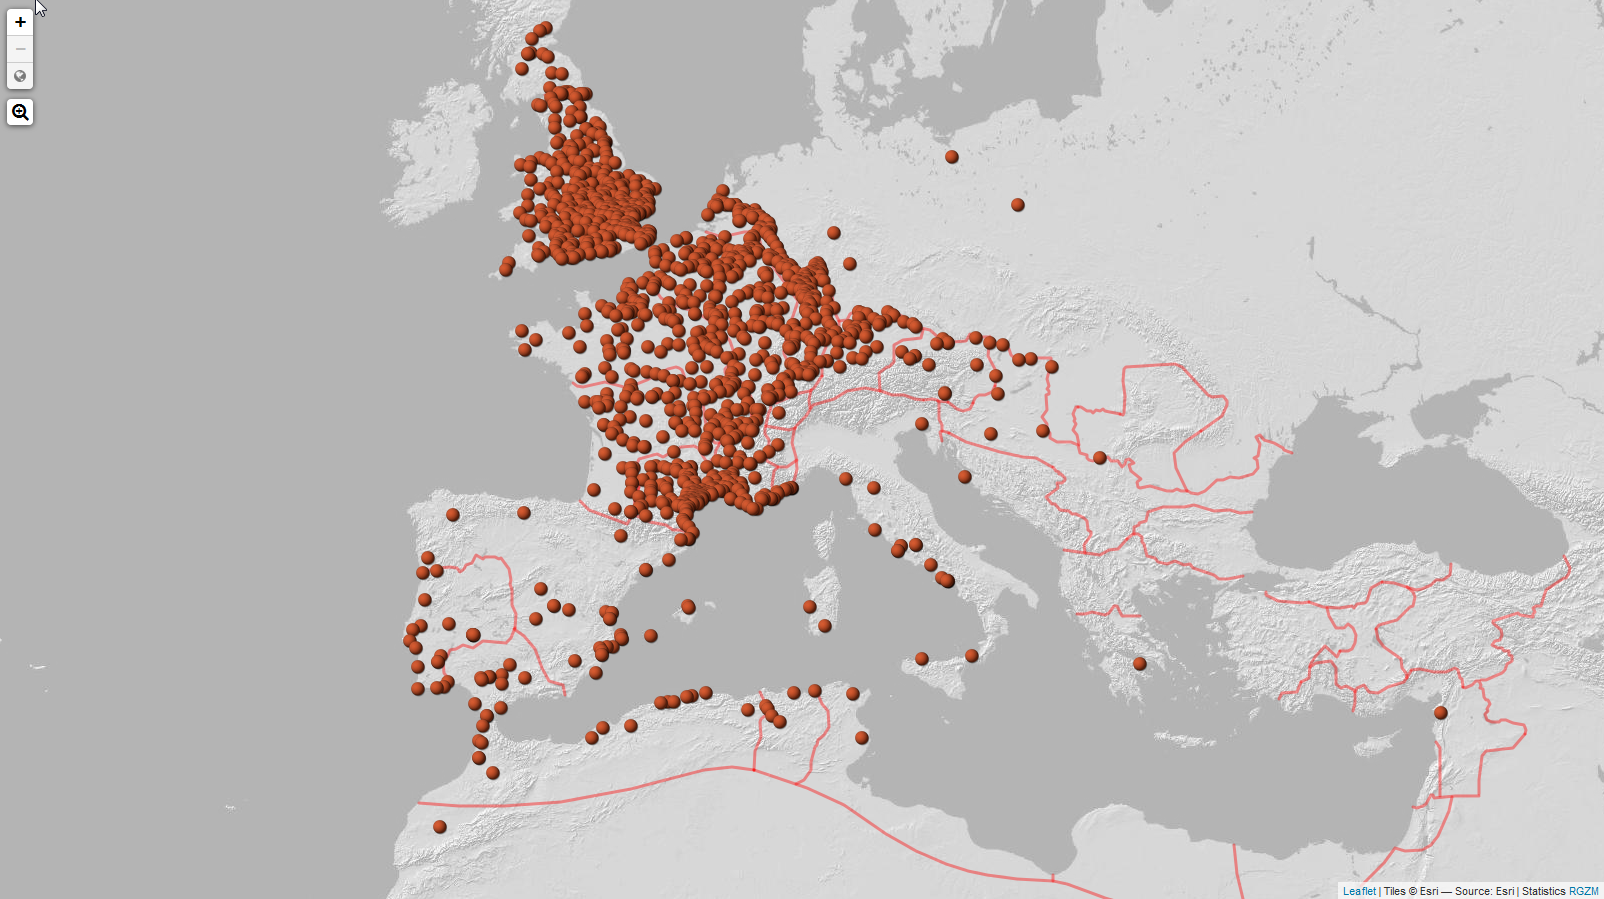
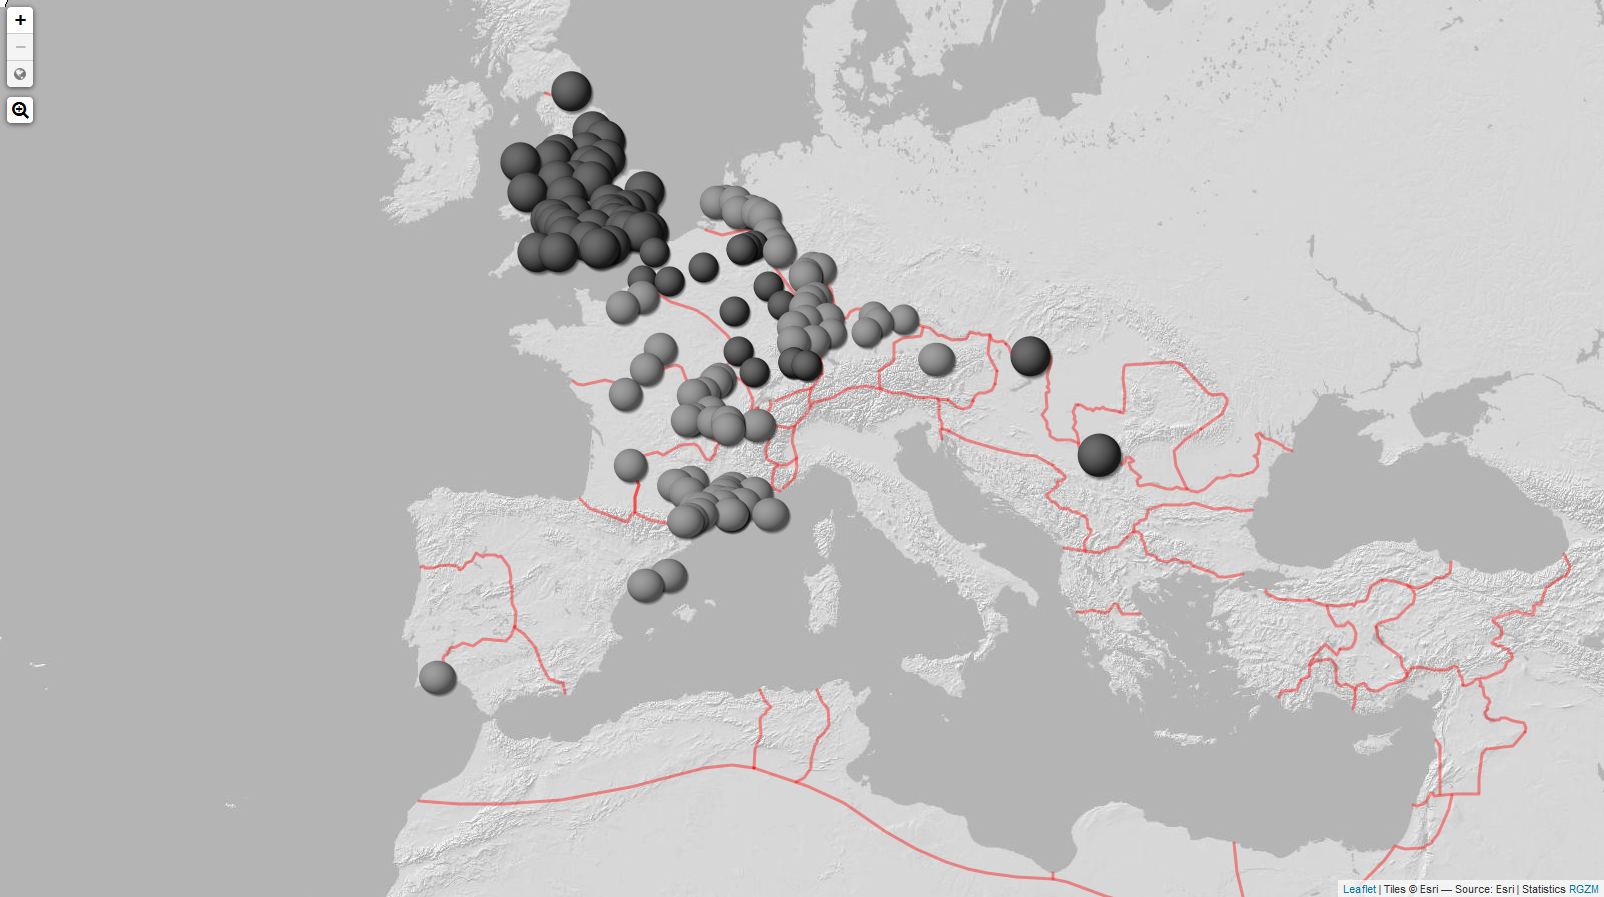
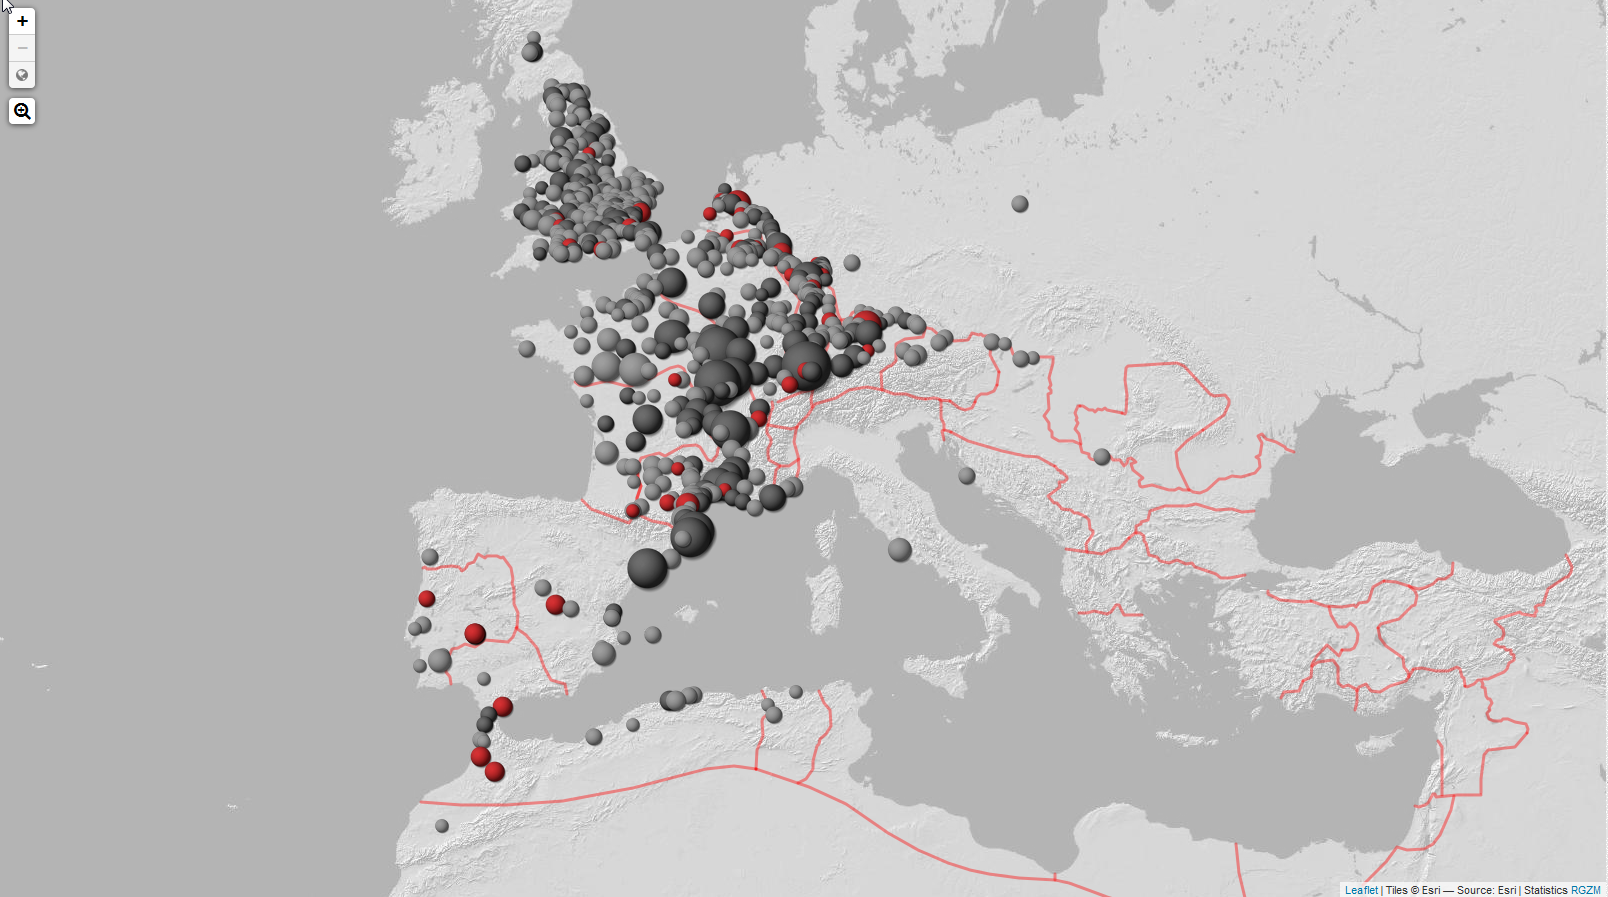
Figure 12: General distribution of La Graufesenque stamped vessels. Maps generated at http://www.rgzm.de/samian (02.12.2016).
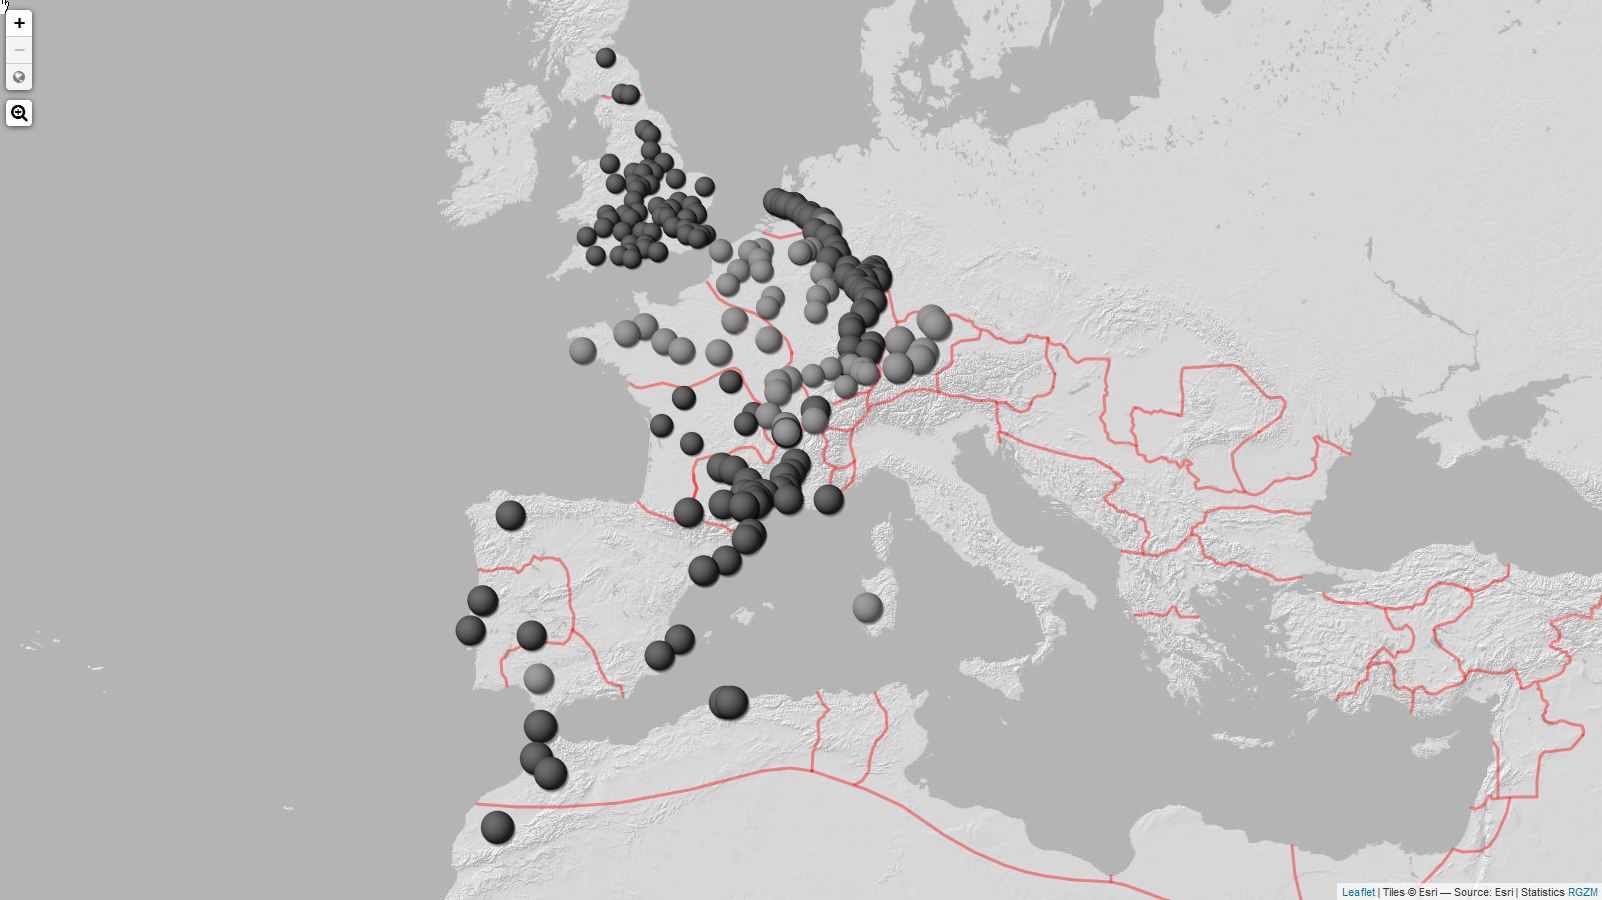
Figure 13: General distribution of Aquitanus stamps from La Graufesenque, province values according to the Mócsy coefficient. Black dots = above province norm; grey dots = below province norm. Maps generated at http://www.rgzm.de/samian (02.12.2016).
Figure 14: General distribution of the stamps of Iucundus iii from La Graufesenque, province values according to the Mócsy coefficient. Black dots = above province norm; grey dots = below province norm. Maps generated at http://www.rgzm.de/samian (02.12.2016).
Figure 15: General distribution of form Drag. 33 made in La Graufesenque, province values according to the Mócsy coefficient. Black dots = above province norm; grey dots = below province norm; red dot = geographical midpoint of the potters' distribution. Maps generated at http://www.rgzm.de/samian (02.12.2016).
Figure 16: General distribution of form Drag. 15/17 made in La Graufesenque, province values according to the Mócsy coefficient. Black dots = above province norm; grey dots = below province norm. Maps generated at http://www.rgzm.de/samian (02.12.2016).
Figure 17: General distribution of dishes made in La Graufesenque, province values according to the Mócsy coefficient. Black dots = above province norm; grey dots = below province norm. Maps generated at http://www.rgzm.de/samian (02.12.2016).
Figure 18: General distribution of dishes made in La Graufesenque, site values according to Chi-Square-based statistics. Red dots = more than expected; black dots = less than expected; grey dots = statistically irrelevant quantities. Maps generated at http://www.rgzm.de/samian (02.12.2016).
Figure 19: General distribution of cups made in La Graufesenque, site values according to Chi-Square-based statistics. Red dots = more than expected; black dots = less than expected; grey dots = statistically irrelevant quantities. Maps generated at http://www.rgzm.de/samian (02.12.2016).
Figure 20: General distribution of Drag. 33 made in La Graufesenque, site values according to Chi-Square-based statistics. Red dots = more than expected; black dots = less than expected; grey dots = statistically irrelevant quantities. Maps generated at http://www.rgzm.de/samian (02.12.2016).
Figure 21: General distribution of Drag. 27 made in La Graufesenque, site values according to Chi-Square-based statistics. Red dots = more than expected; black dots = less than expected; grey dots = statistically irrelevant quantities. Maps generated at http://www.rgzm.de/samian (02.12.2016).
Figure 22: General distribution of bowls made in La Graufesenque, site values according to Chi-Square-based statistics. Red dots = more than expected; black dots = less than expected; grey dots statistically irrelevant quantities. Maps generated at http://www.rgzm.de/samian (02.12.2016).
Figure 23: General distribution of dishes made in Lezoux, site values according to Chi-Square-based statistics. Red dots = more than expected; black dots = less than expected; grey dots statistically irrelevant quantities. Maps generated at http://www.rgzm.de/samian (02.12.2016).
Figure 24: General distribution of dishes made in Rheinzabern, site values according to Chi-Square-based statistics. Red dots = more than expected; black dots = less than expected; grey dots statistically irrelevant quantities. Maps generated at http://www.rgzm.de/samian (02.12.2016).
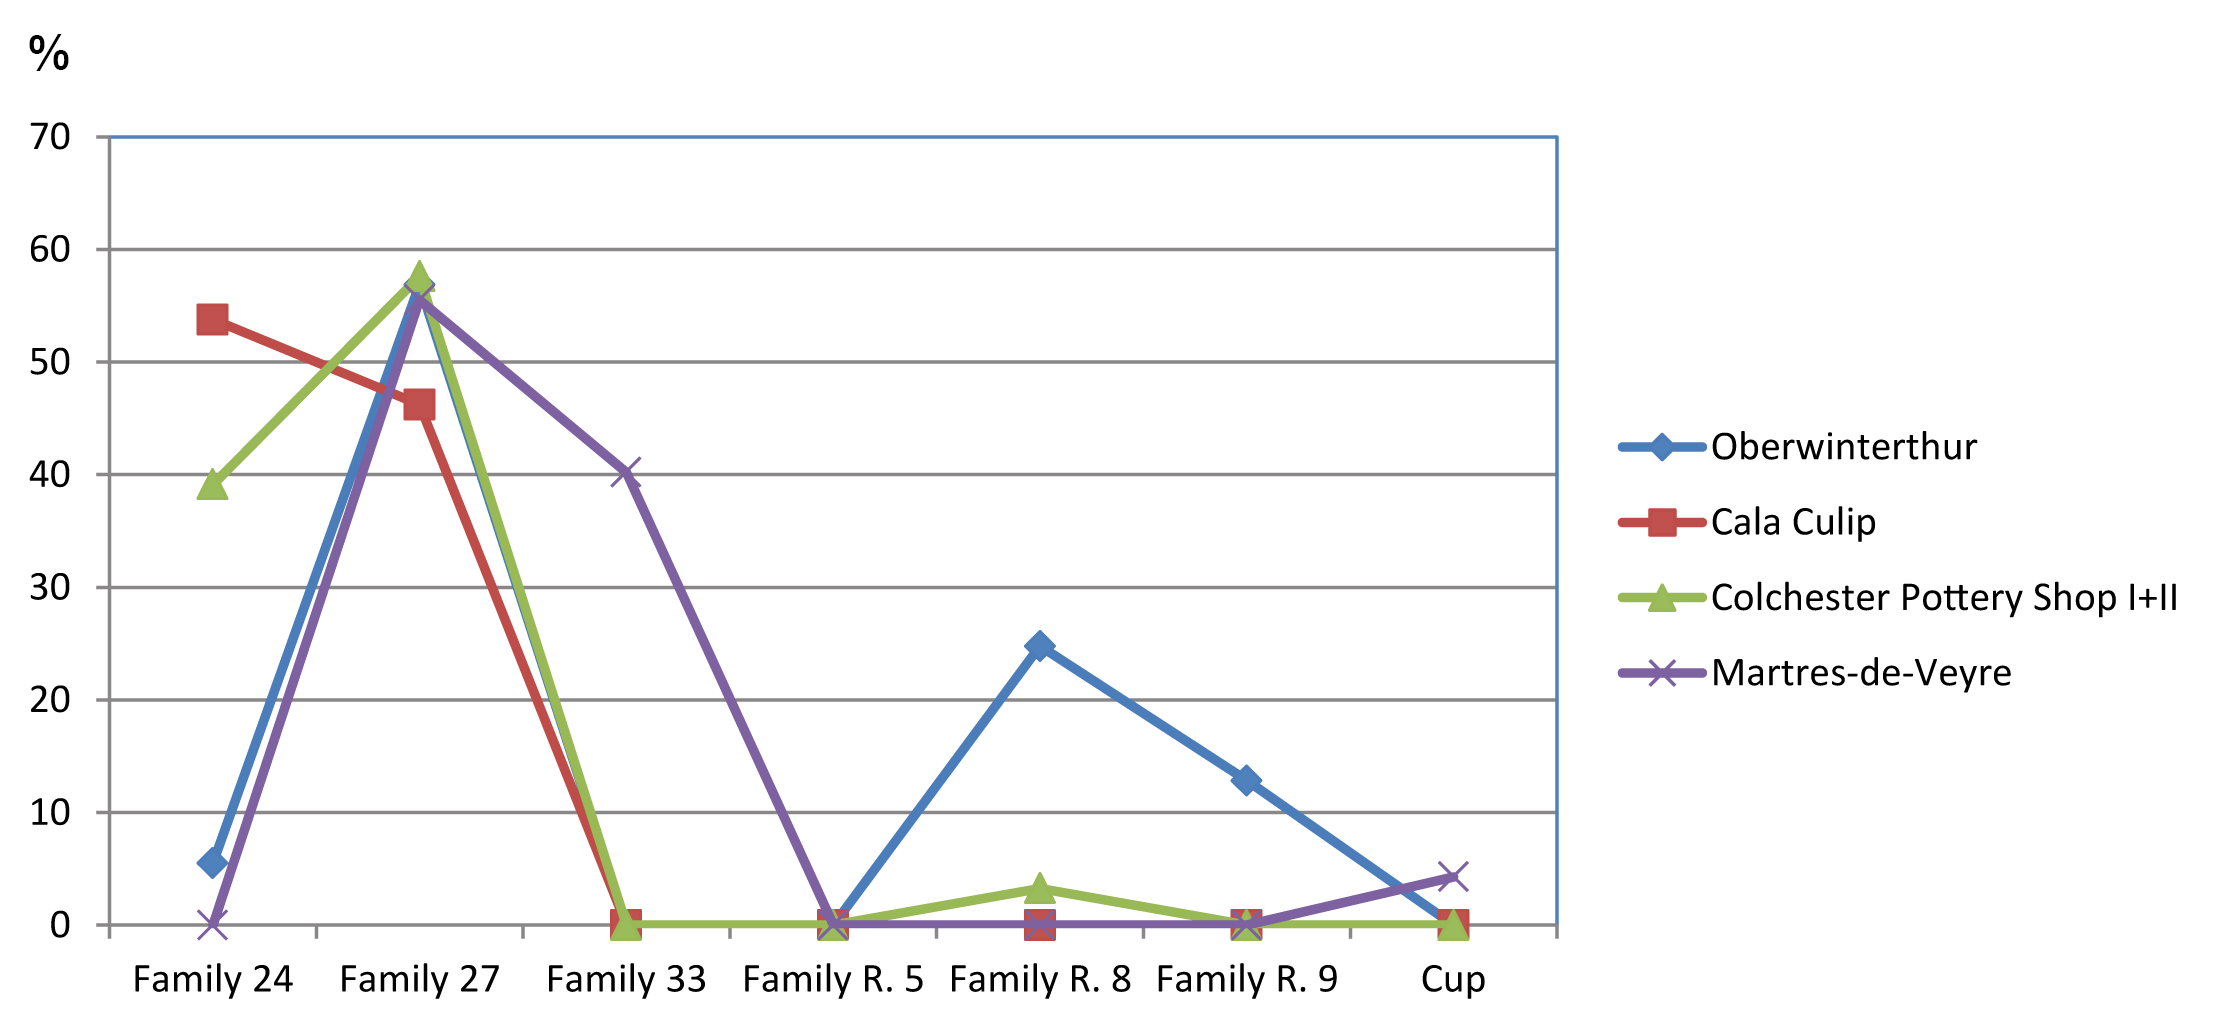
Figure 25: Percentages of samian forms in depots. 'Family' indicates including rouletted or incised form varieties. Values generated at http://www.rgzm.de/samian (02.12.2016).
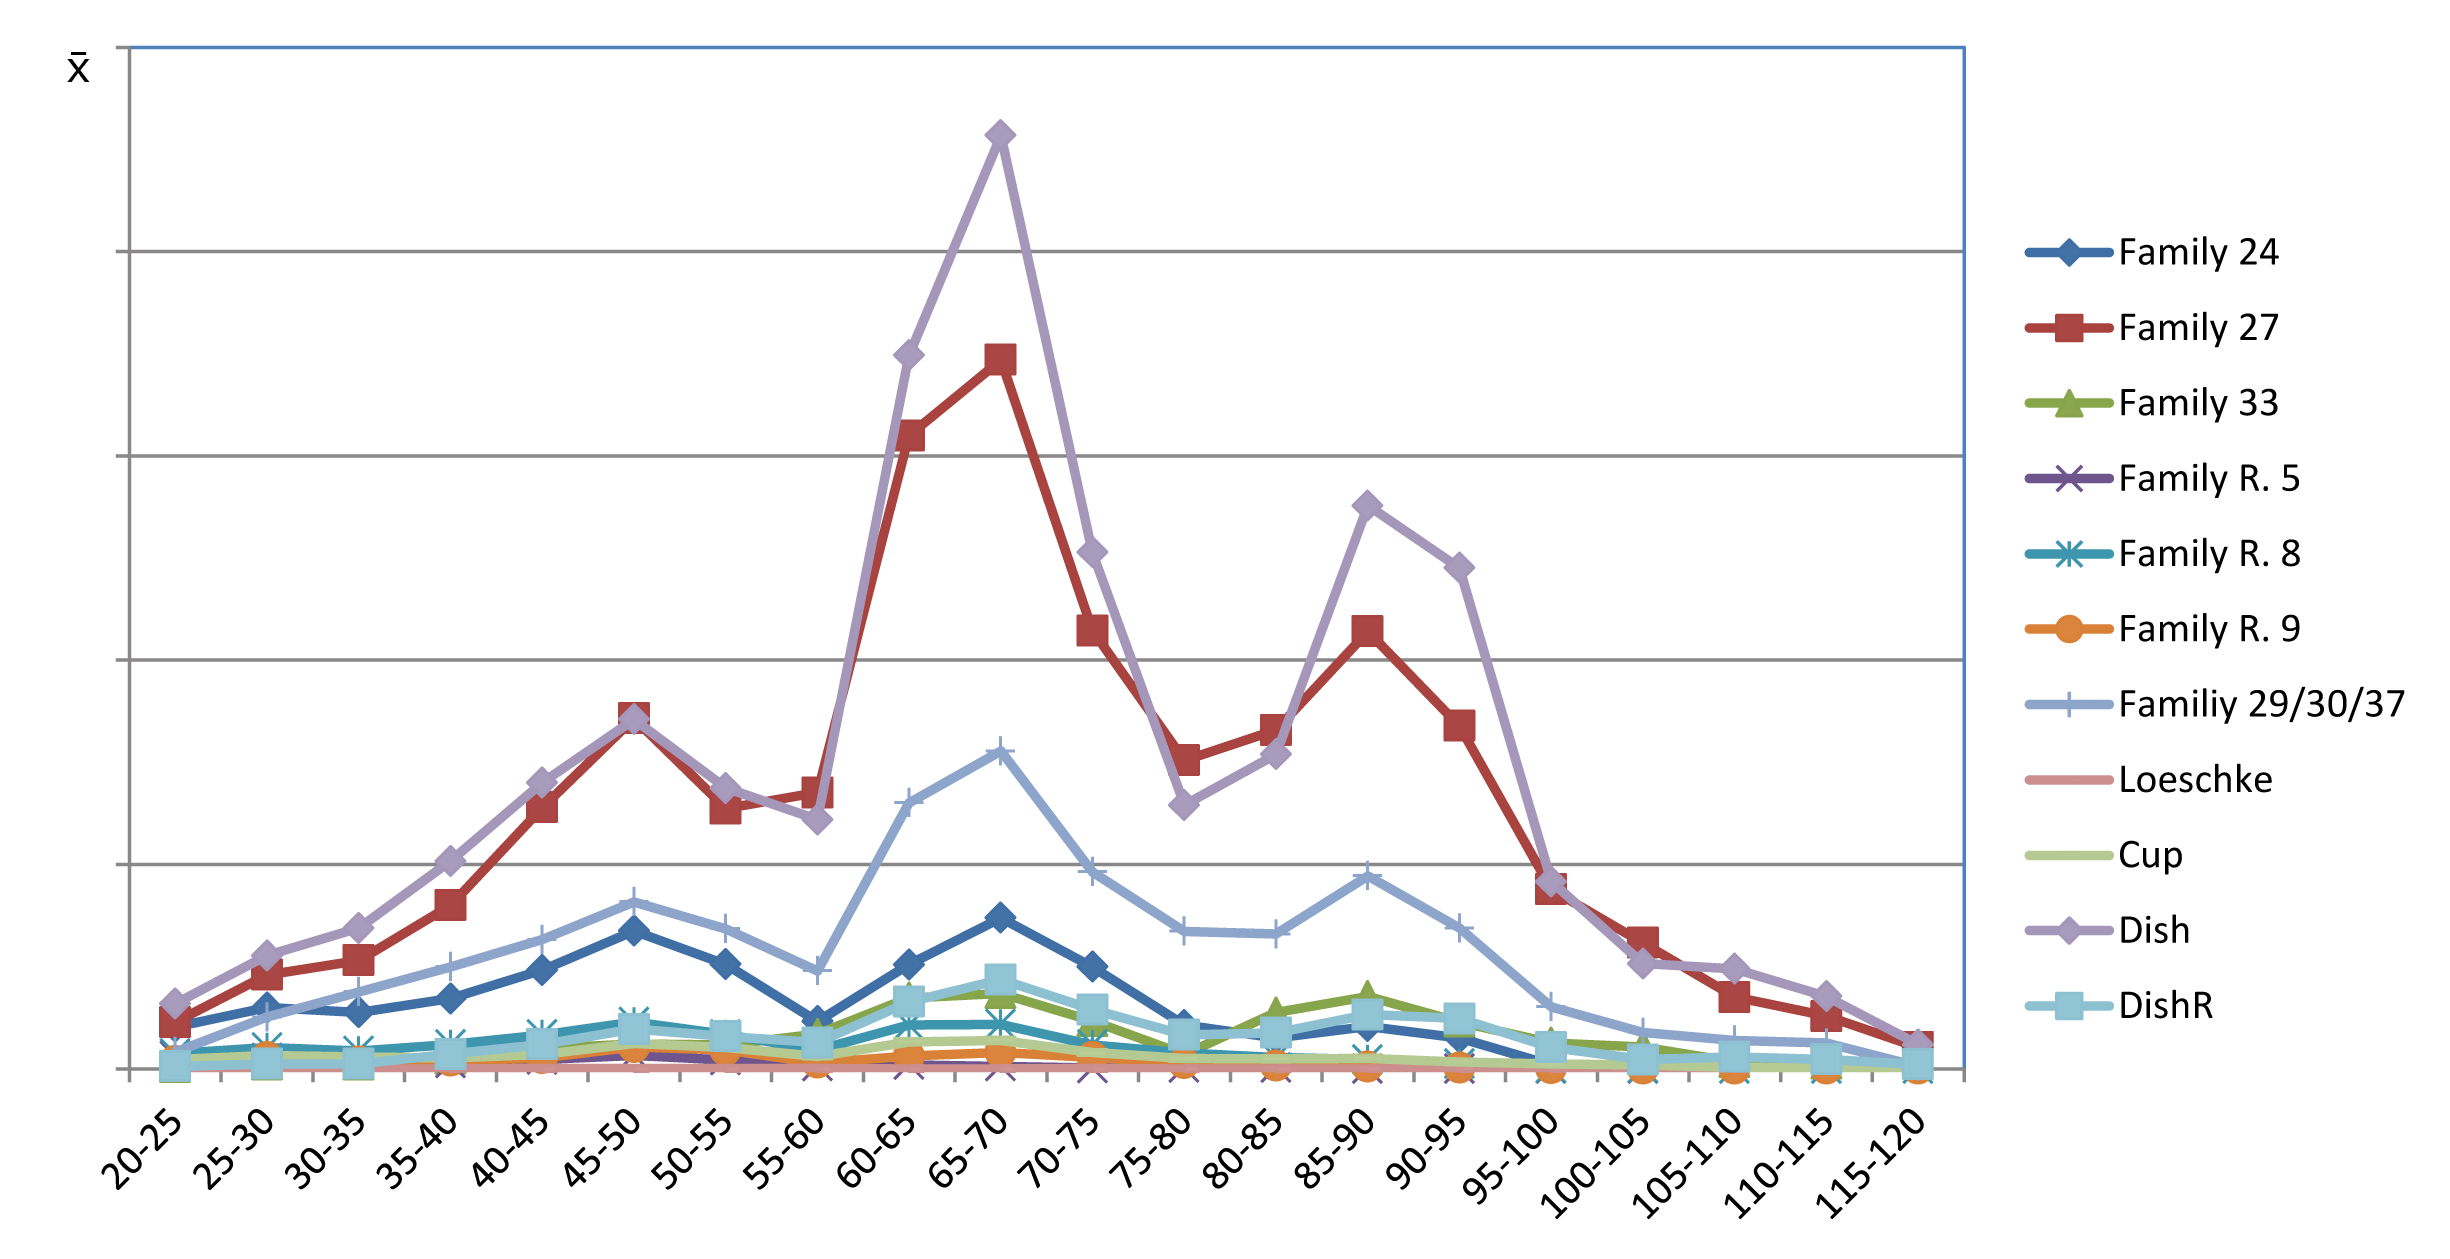
Figure 26: Average frequencies per interval of 5 years during the first century. 'Family' indicates including rouletted form varieties. Values generated at http://www.rgzm.de/samian (02.12.2016).
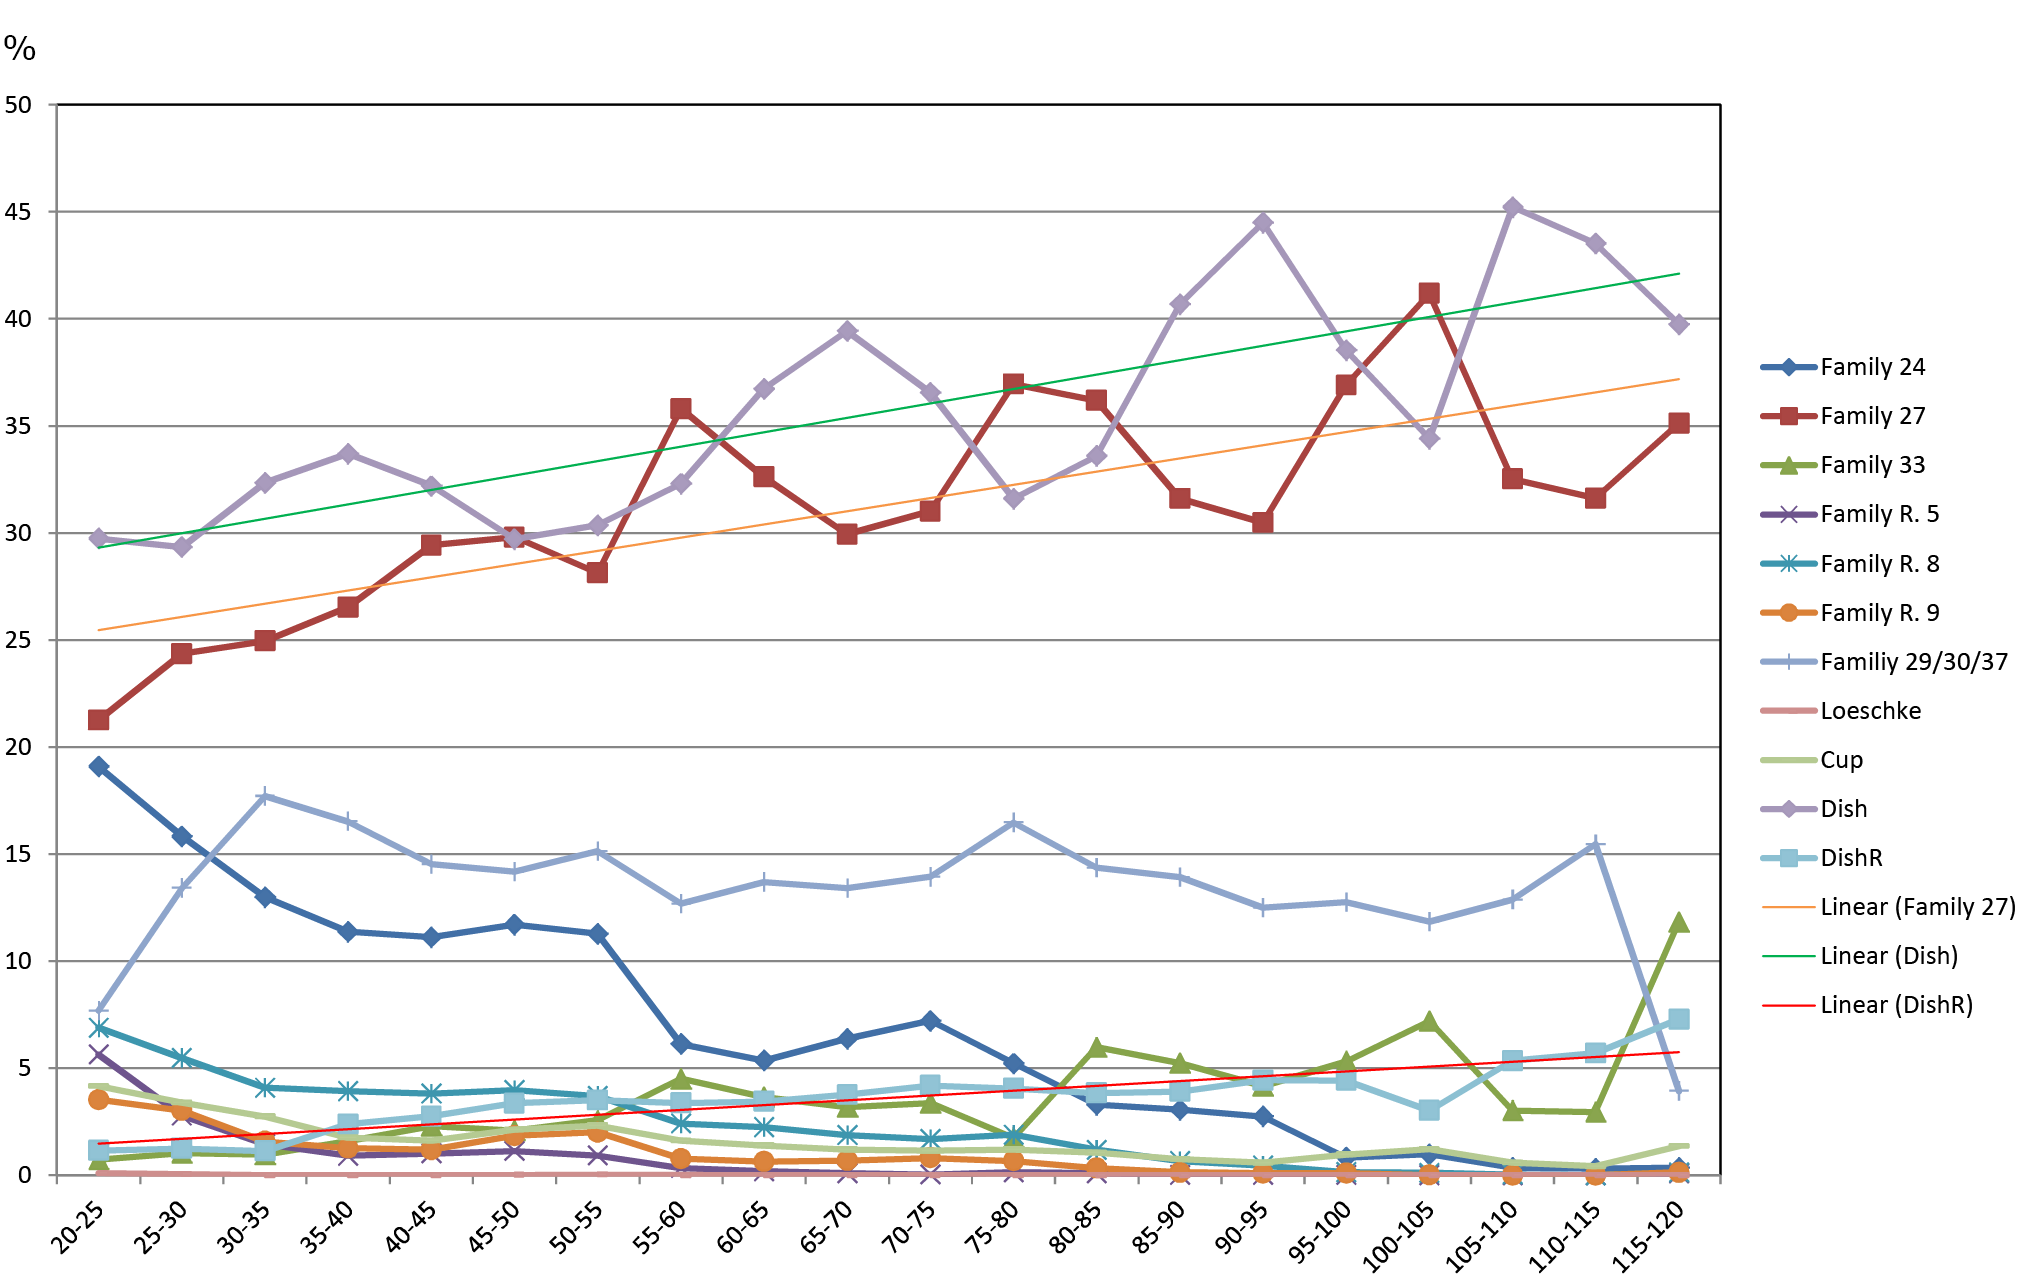
Figure 27: Timeline of form types produced by potters found on export sites in percentages. 'Family' indicates including rouletted form varieties. Quantities based on average potter datings per decade. Values generated at http://www.rgzm.de/samian (02.12.2016).
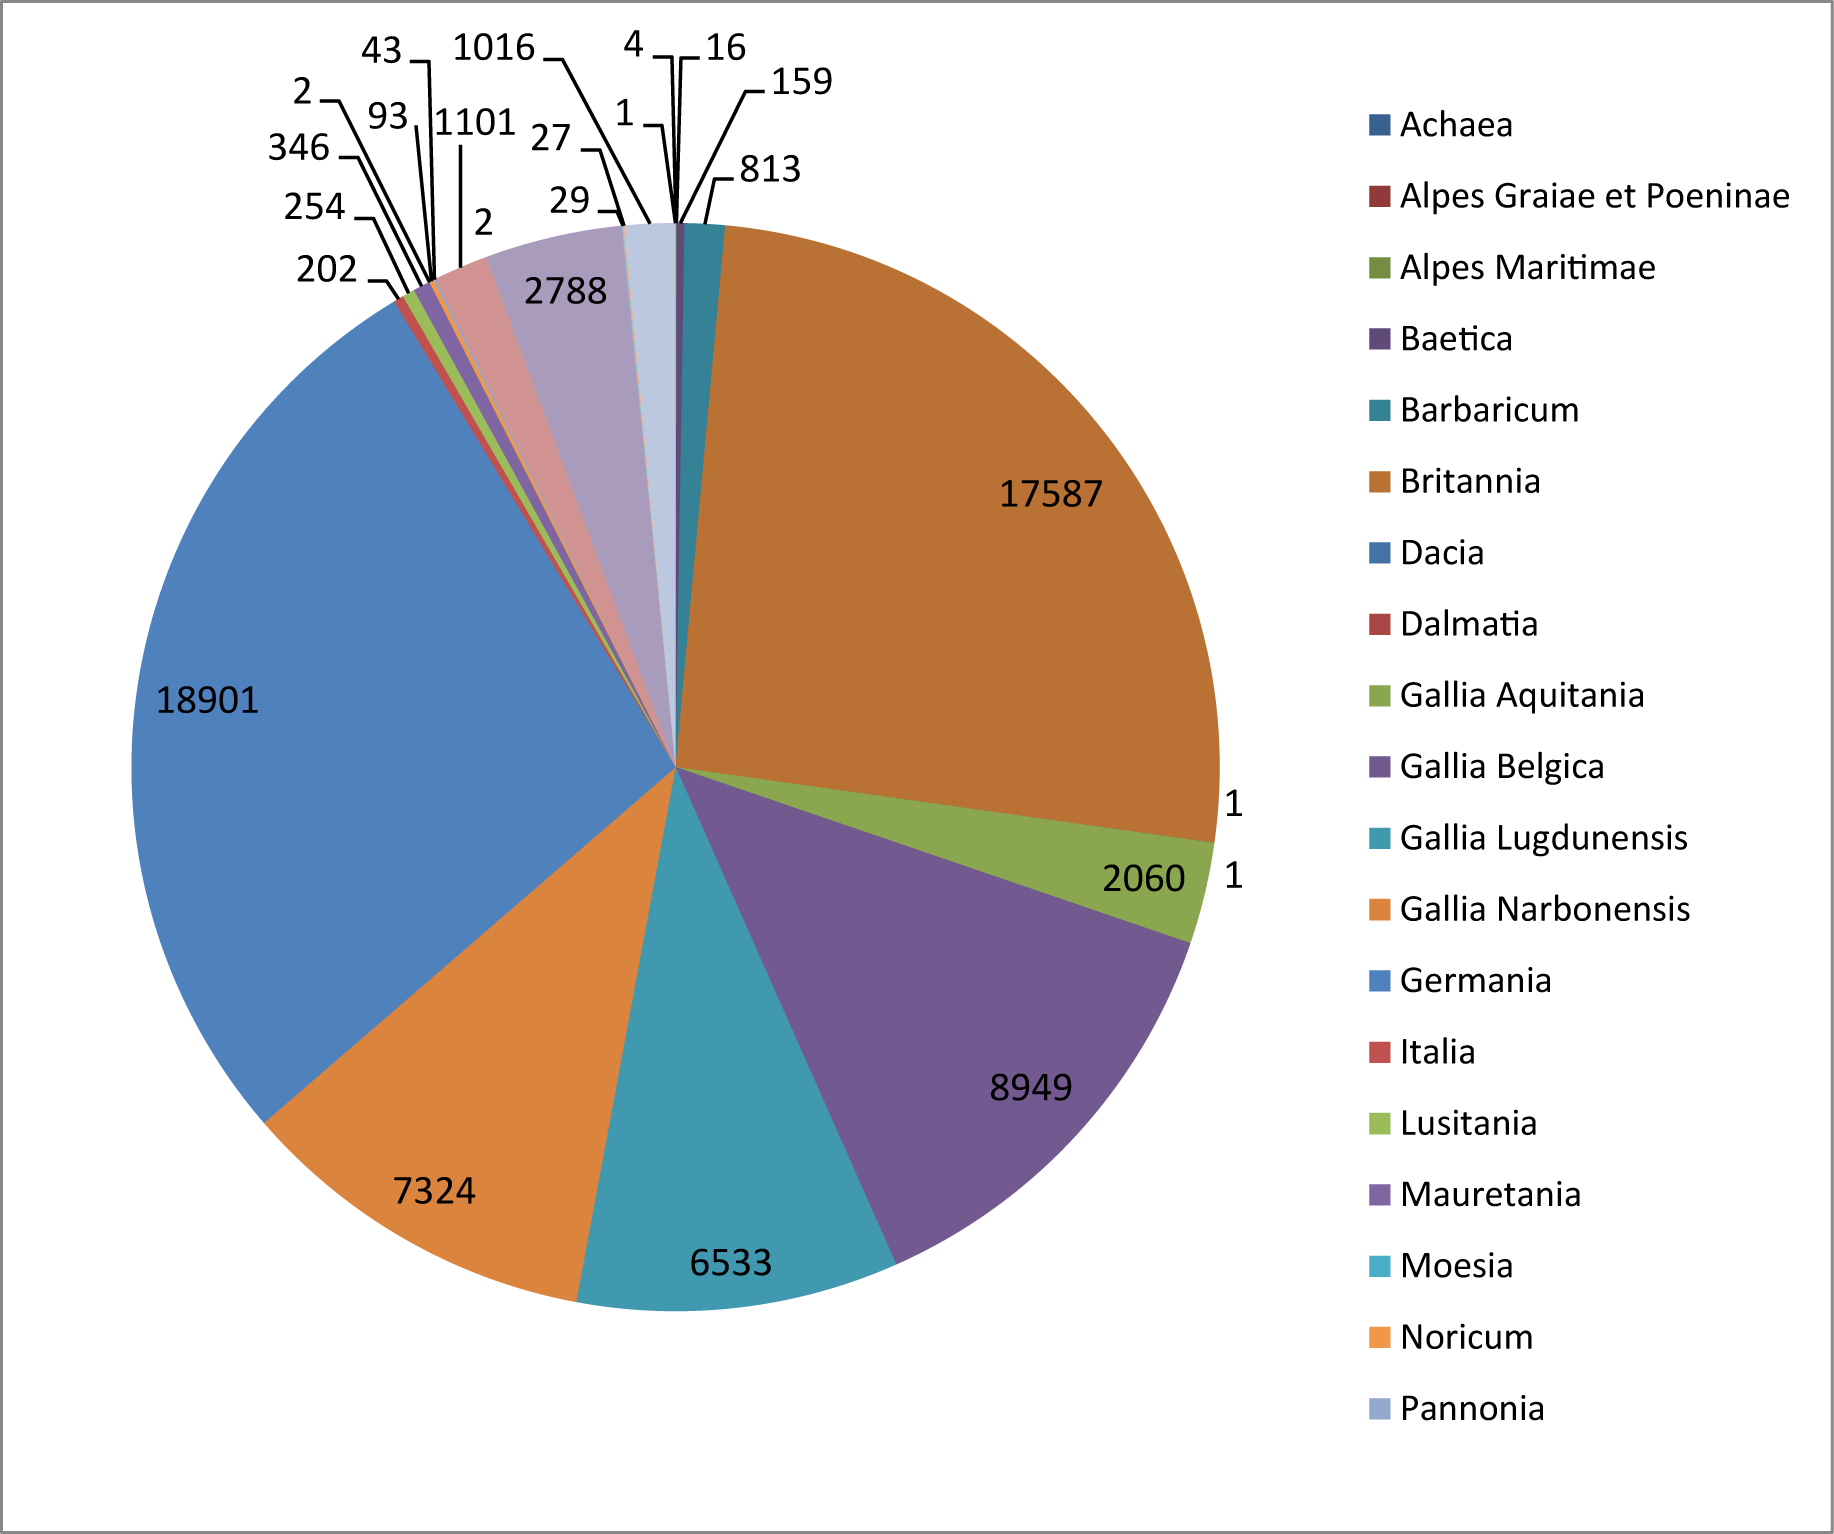
Figure 28: Exports of La Graufesenque per province. Values generated at http://www.rgzm.de/samian (02.12.2016).
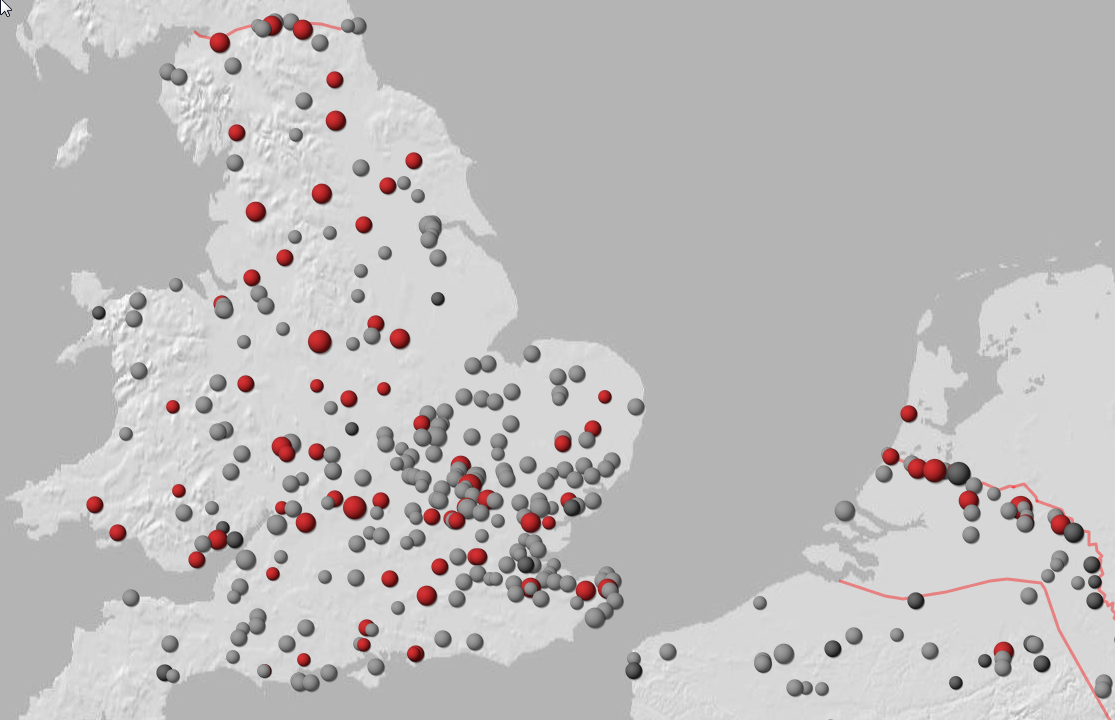
Figure 29: Distribution of dishes made in La Graufesenque, areas of Britannia and Germania Inferior. Site values according to Chi-Square statistics (http://www.rgzm.de/samian). Red: more than expected. Black dots = less than expected; grey dots = statistically irrelevant quantities. Map generated at http://www.rgzm.de/samian (02.12.2016).
Internet Archaeology is an open access journal based in the Department of Archaeology, University of York. Except where otherwise noted, content from this work may be used under the terms of the Creative Commons Attribution 3.0 (CC BY) Unported licence, which permits unrestricted use, distribution, and reproduction in any medium, provided that attribution to the author(s), the title of the work, the Internet Archaeology journal and the relevant URL/DOI are given.
Terms and Conditions | Legal Statements | Privacy Policy | Cookies Policy | Citing Internet Archaeology
Internet Archaeology content is preserved for the long term with the Archaeology Data Service (ROR). Help sustain and support open access publication by donating to our Open Access Archaeology Fund.