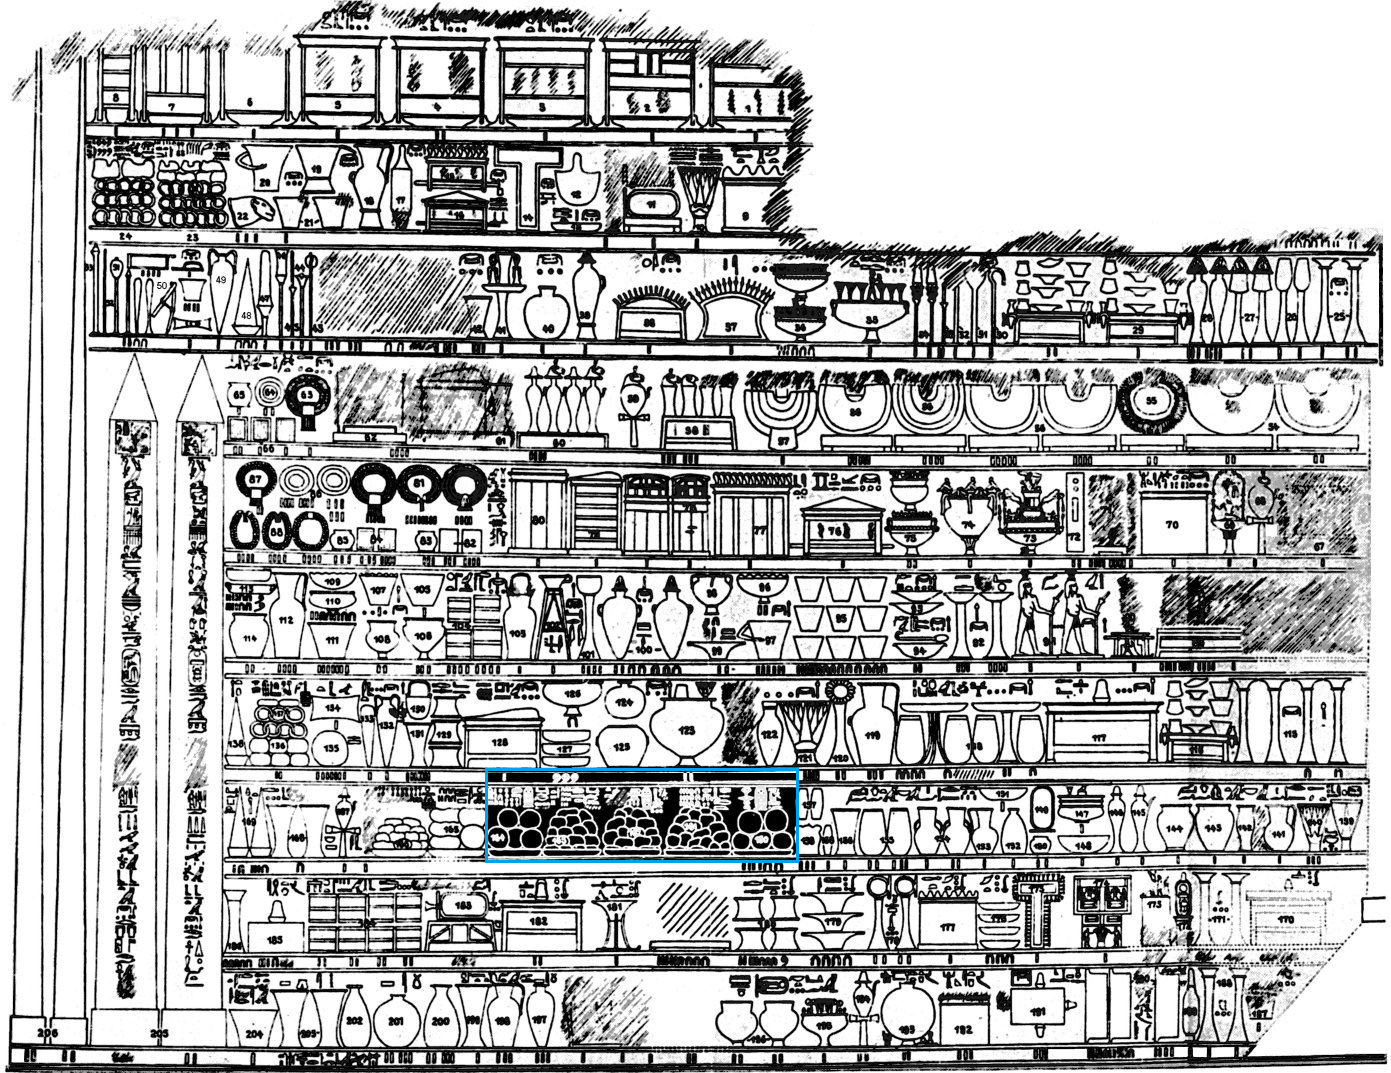
Figure 1: Depiction of the Hall of the Annals scene at Karnak showing the tribute given by Thutmosis III to the temple. Figure 1b: Close-up showing baskets of glass and precious stone. The scene reads right to left, so basket 1 with the five round objects is at the far right with two baskets of irregularly shaped lumps to its left. (adapted from a drawing by Wreszinski 1922, in Wreszinski 1931). See also https://www.flickr.com/photos/manna4u/20629027214/in/photostream/
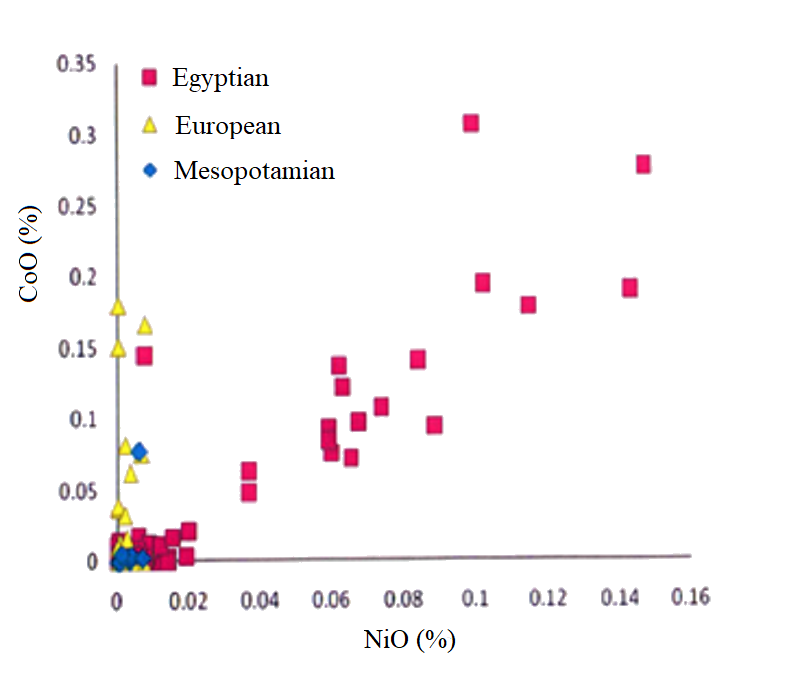
Figure 2: Bivariate plot of NiO vs CoO in weight % for cobalt-coloured blue glass. The linearity of the relationship between NiO and CoO for the Egyptian glass has been considered consistent with the use of cobalt alum from the Western Desert of Egypt (adapted from Duckworth 2011, 146, fig. 5.14). Note that the slope of the Egyptian data is about 1.67 (i.e. ΔNiO/ΔCoO = 0.6)
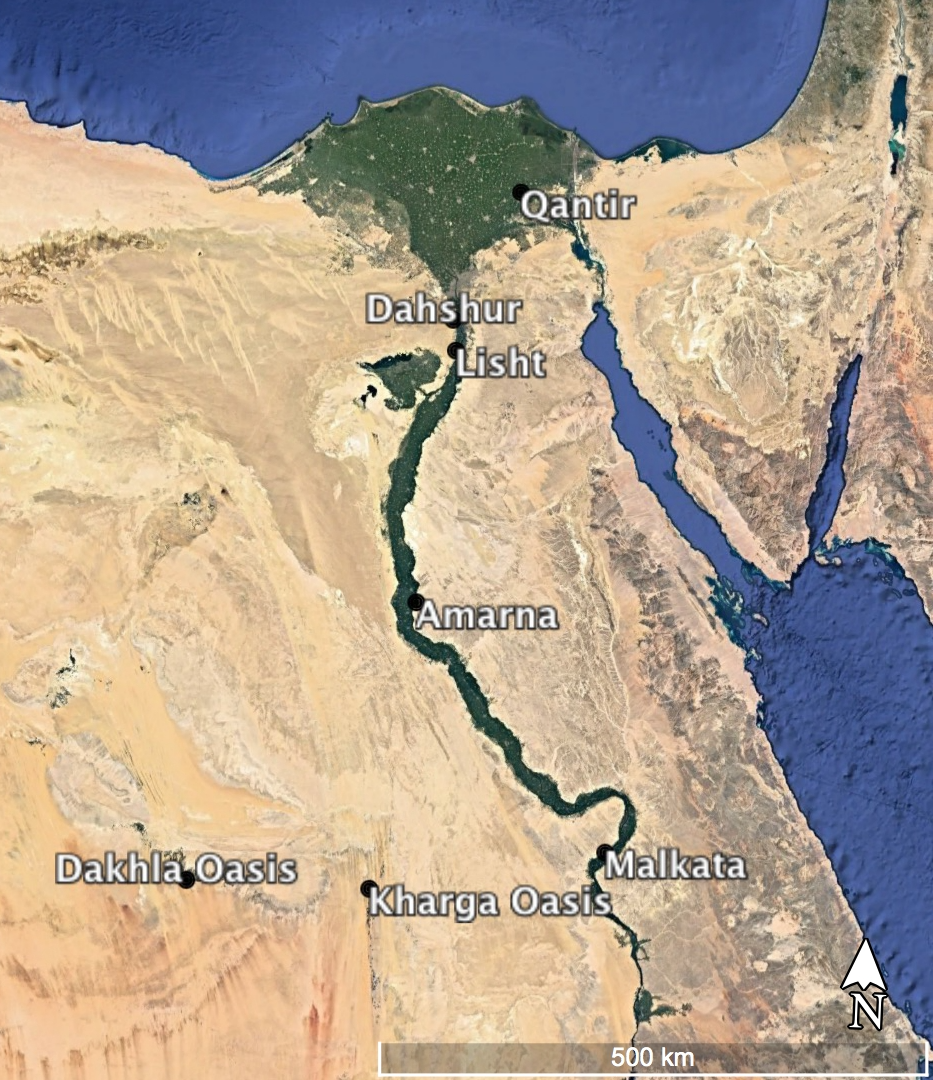
Figure 3: Map of Egypt showing the locations of the Kharga and Dakhla oases as well as other places associated with glass mentioned in this text
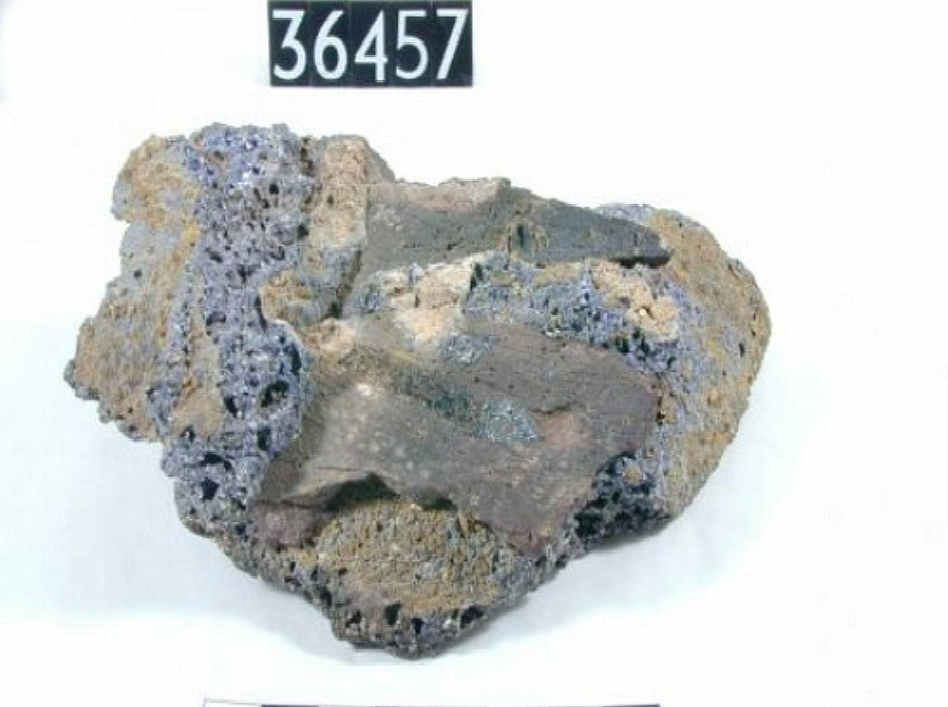
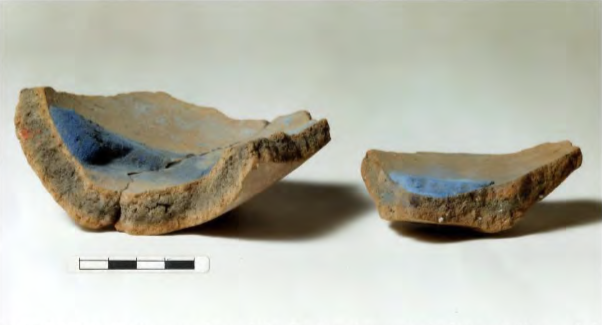
Figure 4a: Photograph from Petrie Museum (UCL) – Acc. no. UC36457 described as a fragment of broken pottery fritting pan enveloped by a mass of dark blue unfinished frit with visible chips of uncombined silica from crushed quartz pebbles and numerous air bubbles; shape of frit indicates pan profile. Figure 4b: Images from Weatherhead and Buckley courtesy of Petrie Museum (UCL) (1989, 220): On the left (UC 36457) is described as a spongy light-purple frit with small white inclusions, with attached sherd (possibly the remains of a fritting pan). UC24684 is described as a section from (circular?) cake of blue frit and UC36459 as a circular cake of blue frit. All are described as having a coarse texture. Figure 4c: Images from Weatherhead and Buckley courtesy of Liverpool Museum (1989, 220): described as potsherds as containers of blue frit; left: Acc. No. 56.21.280.1; right: Acc. No. 56.21.281
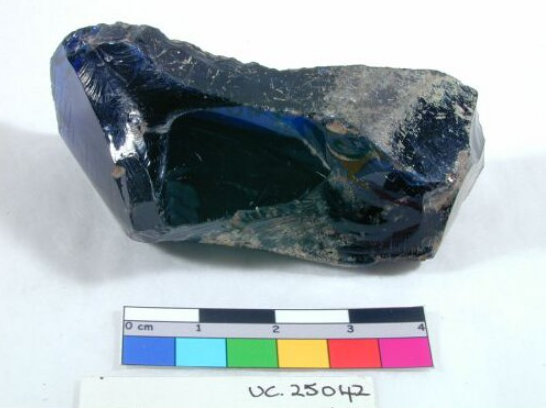
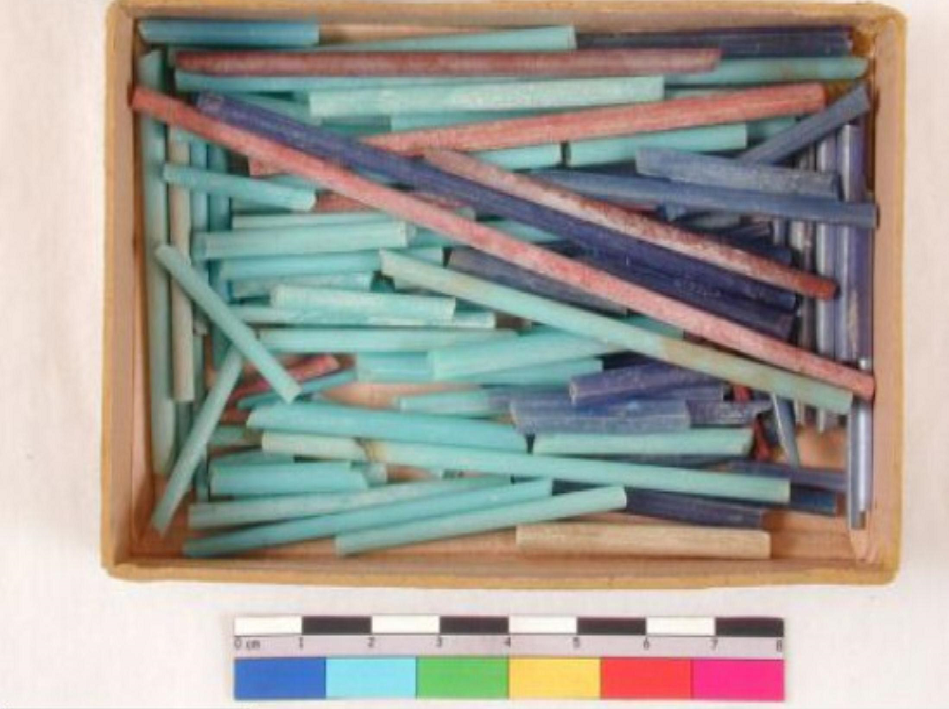
Figure 5: Photographs from Petrie Museum (UCL). All recovered from Amarna (18th Dynasty): Figure 5a: UC25042 – described as a fragment of dark blue glass; also described as raw glass. Figure 5b: UC6524 – described as glass rods: turquoise, lapis blue and red. Figure 5c: UC6523 – described as a fragment of a cobalt-blue glass ring
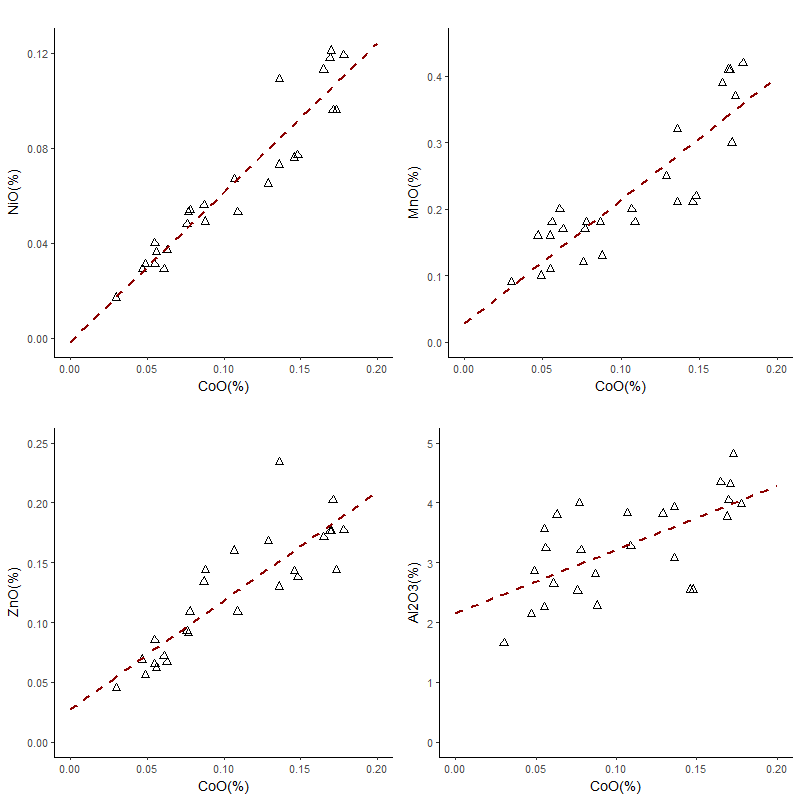
Figure 6: Bivariate plots of NiO, MnO, ZnO and Al2O3 vs CoO in weight % for cobalt-coloured blue glass measured using pXRF. The relationships between NiO, MnO, ZnO and CoO show very linear interactions. Al2O3 shows more variation over the same concentration range (data from Abe et al. 2012)
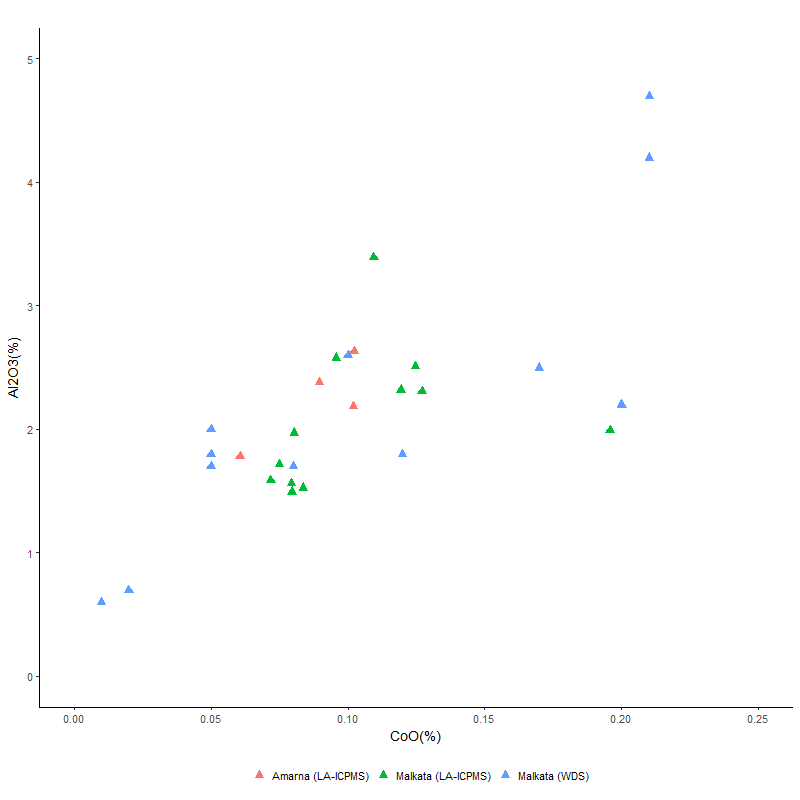
Figure 7: Bivariate plot of Al2O3 vs CoO in weight % for cobalt-coloured blue glass from Amarna and Malkata measured using LA-ICPMS and WDS. WDS and LA-ICPMS was conducted on the same samples for the Malkata glass, highlighting the differences in concentration between these techniques, with WDS recording both lower and higher values than from LA-ICPMS. Note that sample UPP38 from Malkata is not included here because, although previously classified by WDS as a cobalt-blue glass (i.e. WDS: CoO = 0.05%), LA-ICPMS measured 0.0028%, suggesting that CoO was not the main colourant. As with the pXRF data in Figure 6, the interaction between Al2O3 vs CoO does not show a particularly good linear relationship. (Amarna: LA-ICPMS data from Varberg et al. 2015 and 2016; Malkata: WDS and LAICPMS data from Shortland and Eremin (2006) and Shortland et al. (2007) respectively)
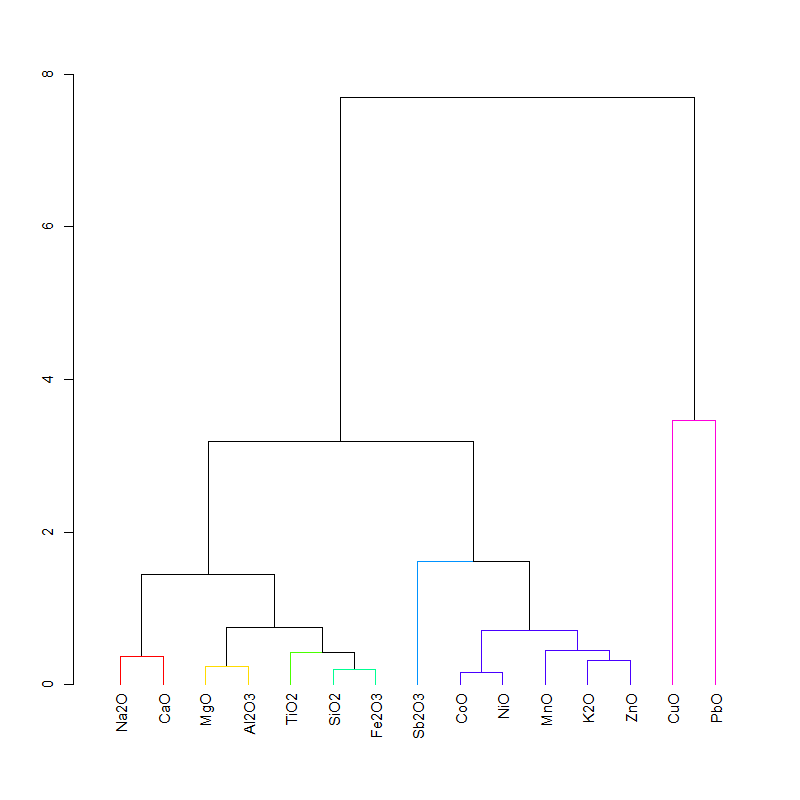
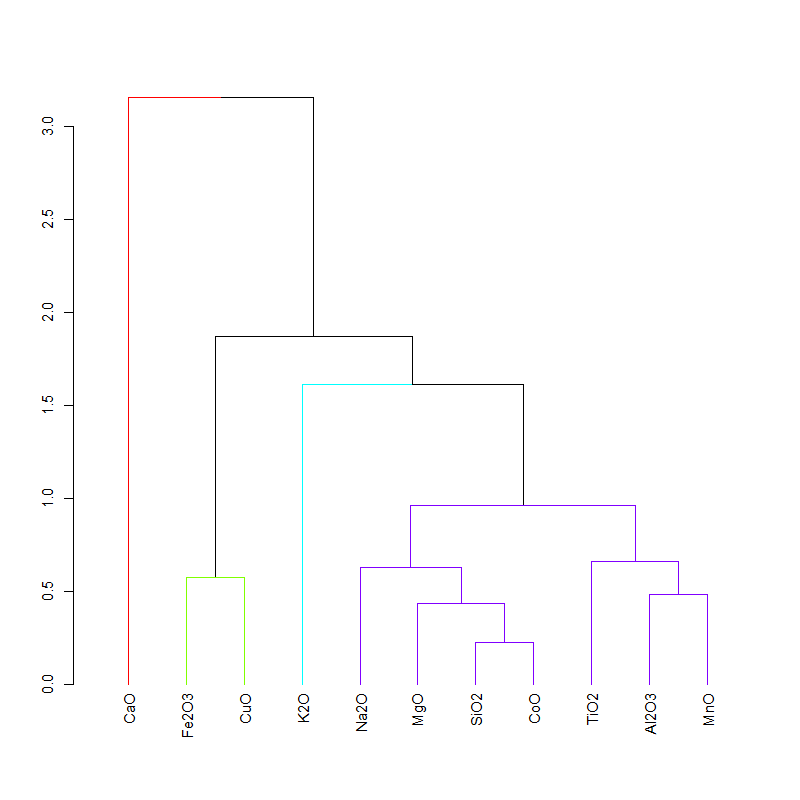
Figure 8: Dendrogram derived from the variation matrix of 26 samples of 18th Dynasty Egyptian glass from museum collections in Japan, probably originating from Amarna and Malkata (data from Abe et al. 2012). Note the close association between CoO, NiO, MnO and ZnO. K2O and Na2O are not well associated, as would be expected from a plant-ash fluxed glass. Al2O3 and MgO are closely associated with TiO2, SiO2 and Fe2O3. CuO and PbO are not well associated with the other components in the glasses or with each other
Figure 9: Dendrogram derived from the variation matrix of 20 samples of 19th-20th Dynasty Egyptian glass from Dahshur (data from Abe et al. 2012). Note the close association between CoO, NiO, MnO and ZnO. K2O and Na2O are better associated and Al2O3 is less well associated with MgO, TiO2, SiO2 and Fe2O3 than in the 18th Dynasty glasses in Figure 8
Figure 10: Dendrogram derived from the variation matrix of 50 samples of the 18th Dynasty glass from museum collections in Japan and the 18th and 19th-20th Dynasty Egyptian glass from Dahshur (data from Abe et al. 2012). When the dendrogram is cut high (>10), the 18th Dynasty glass forms two distinct groups, one main (24 samples) and one group (2 samples) associated with the 19th-20th Dynasty glass from Dashur. The 19th-20th Dynasty glass from Dahshur forms a distinct group (19 samples), with one sample falling within the main 18th Dynasty group. Two 18th Dynasty glasses are associated with the 19th-20th Dynasty group from Dahshur. All 18th Dynasty Dahshur glasses lie within the main 18th Dynasty group (4 samples)
Figure 11: Bivariate plot of TiO2 vs Al2O3 in weight % (data from Abe et al. 2012) for the Egyptian cobalt-blue glasses. The dashed lines show relative amounts of TiO2 and Al2O3 for granite and basalt determined from Daly (1914, 563). Generally, the 19th-20th Dynasty glass from Dahshur fall on the basalt line, while the 18th Dynasty glass from museum collections in Japan and the 18th Dynasty glass from Dahshur generally fall on the granite line. Note that only one sample from Dashur (19th-20th Dynasty) appears to fall on the granite line, and one sample classified as 18th Dynasty Dashur falls on the basalt line. The three remaining 18th Dynasty Dashur samples fall with other 18th Dynasty samples, indicating that the chronology of these samples is more significant than their find site in terms of these compounds
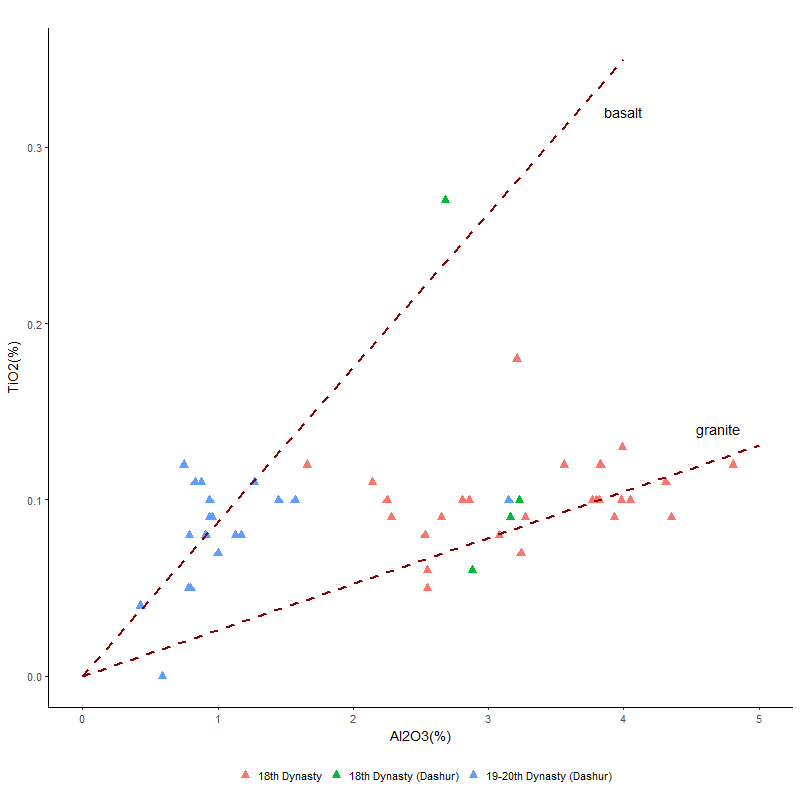
Figure 12: Bivariate plot of TiO2 vs Al2O3 in weight % for the Egyptian cobalt-blue glass from Amarna (Varberg et al. 2015; 2016) and Malkata (Shortland et al. 2007) and Mesopotamian cobalt-blue glass from Nippur (Walton et al. 2012). The dashed lines show relative amounts of TiO2 and Al2O3 for granite and basalt determined from Daly (1914). The Mesopotamian glass falls on the basalt line and the granites lines, while the Egyptian glass Amarna and Malkata falls between the basalt and granite lines
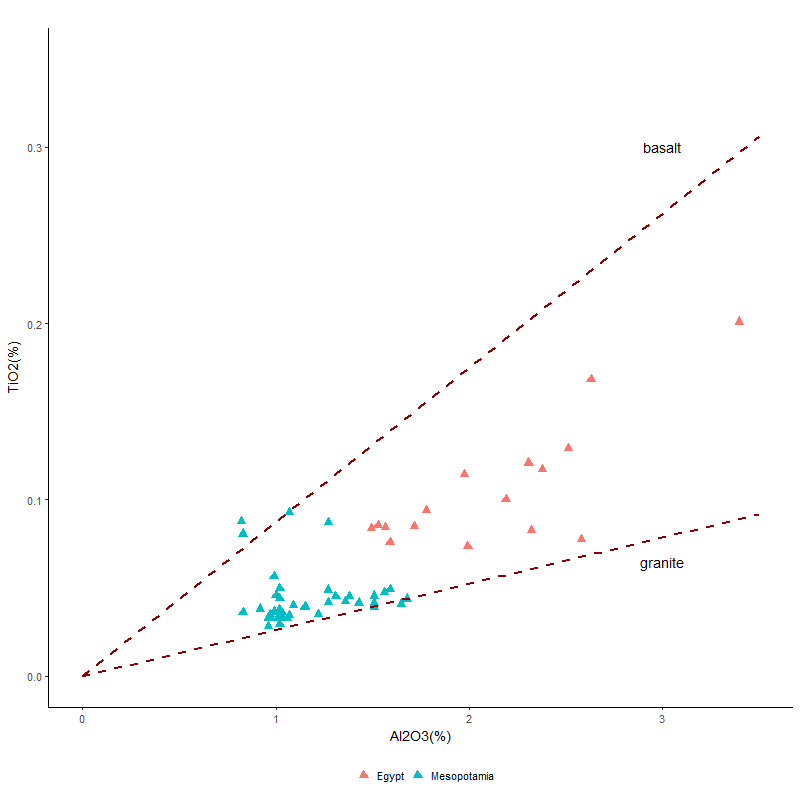
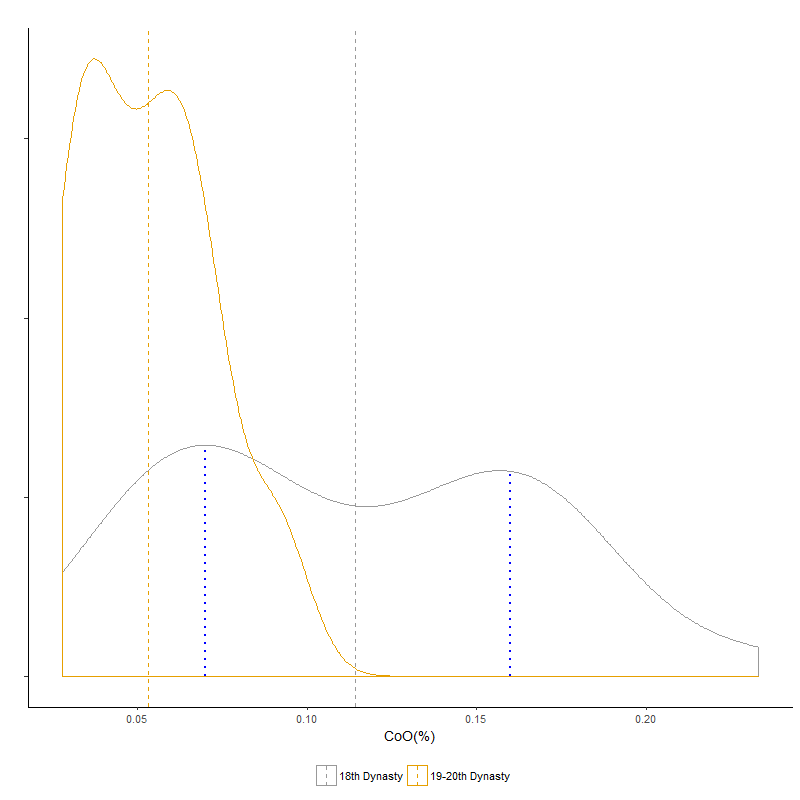
Figure 13: Density plot for the 18th Dynasty glass from museum collections in Japan and 19th-20th Dynasty glass from Dahshur. The blue dotted lines show the peaks of the bimodal distribution of the 18th Dynasty glass. The dashed lines show the average CoO concentration in weight % for each dataset (data from Abe et al. 2012)
Figure 14: Density plots for the 18th Dynasty glass from museum collections in Japan and 19th-20th Dynasty glass from Dahshur for NiO, MnO, ZnO and Al2O3. The dashed lines show the average concentrations in weight % for each dataset (data from Abe et al. 2012)
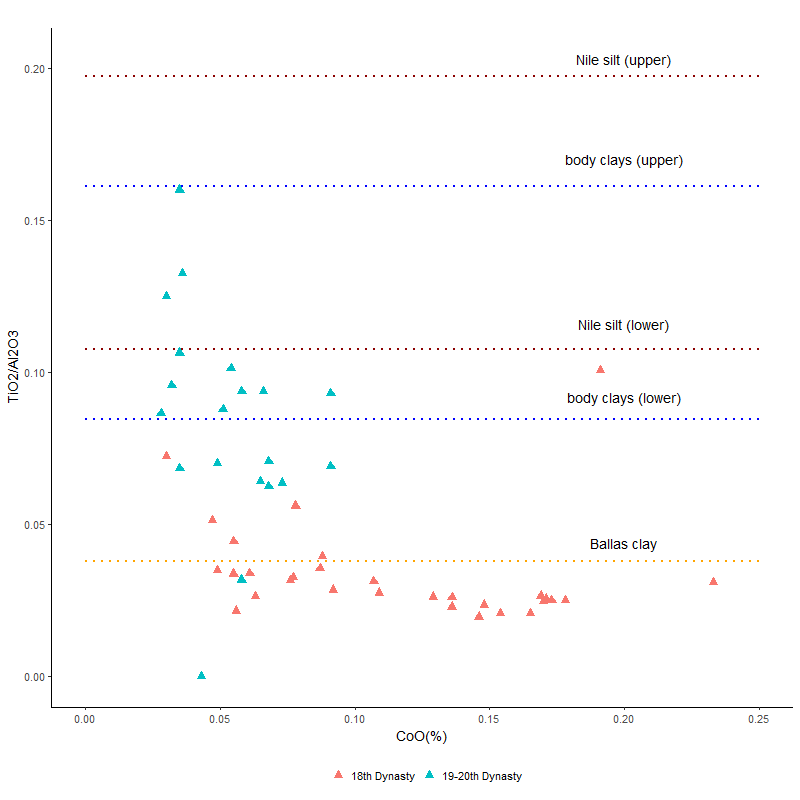
Figure 15: Plot of TiO2/Al2O3 vs CoO for the 18th Dynasty glass and 19th-20th Dynasty glass from Dahshur (data from Abe et al. 2012). The horizontal dotted lines show the ratios of TiO2/Al2O3 for Nile silt (Shortland 2000), body clays from Amarna and Malkata (Shortland et al. 2006b) and Ballas clay found on the edge of the Western Desert near Luxor (Baba 2009)
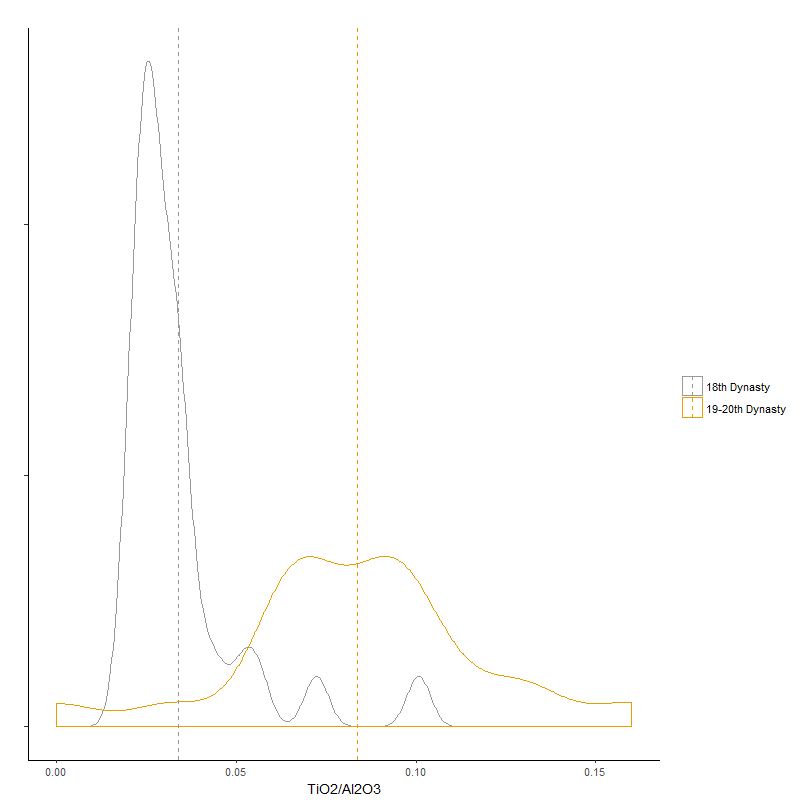
Figure 16: Density plot of TiO2/Al2O3 for the 18th Dynasty glass from museum collections in Japan and 19th-20th Dynasty glass from Dahshur. The 19th-20th Dynasty glass from Dahshur has a much broader distribution than the 18th Dynasty glass (data from Abe et al. 2012)
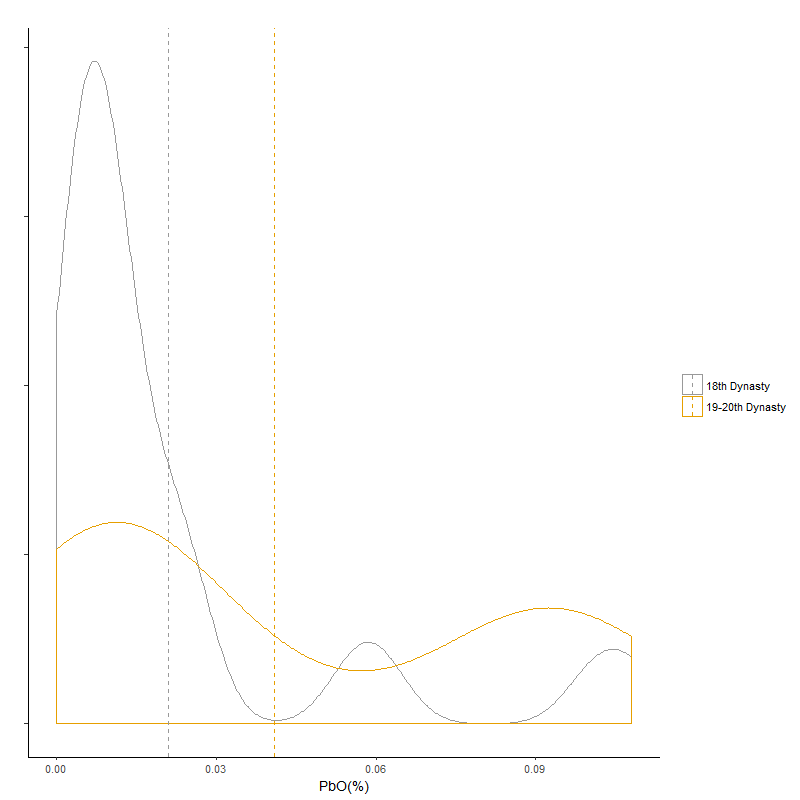
Figure 17: Density plot of PbO for the 18th Dynasty glass from museum collections in Japan and 19th-20th Dynasty glass from Dahshur. The 19th-20th Dynasty glass from Dahshur has a much broader distribution than the 18th Dynasty glass (data from Abe et al. 2012)
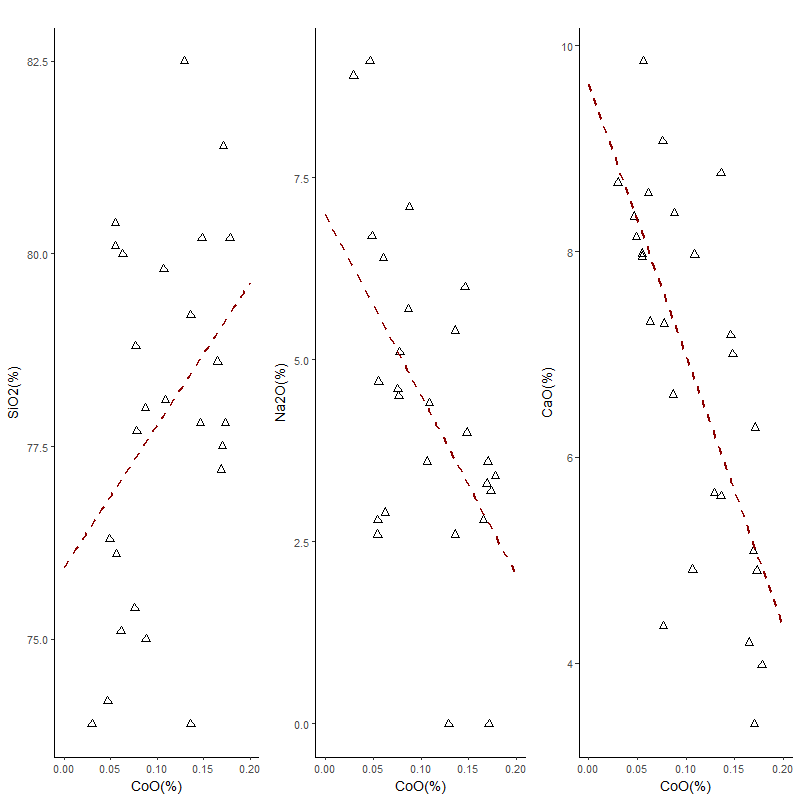
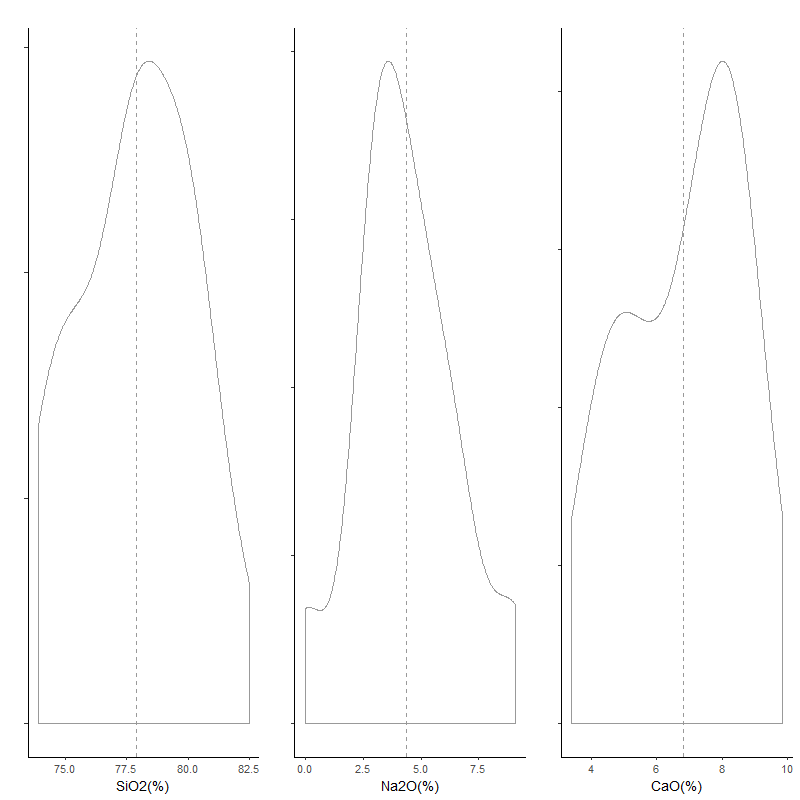
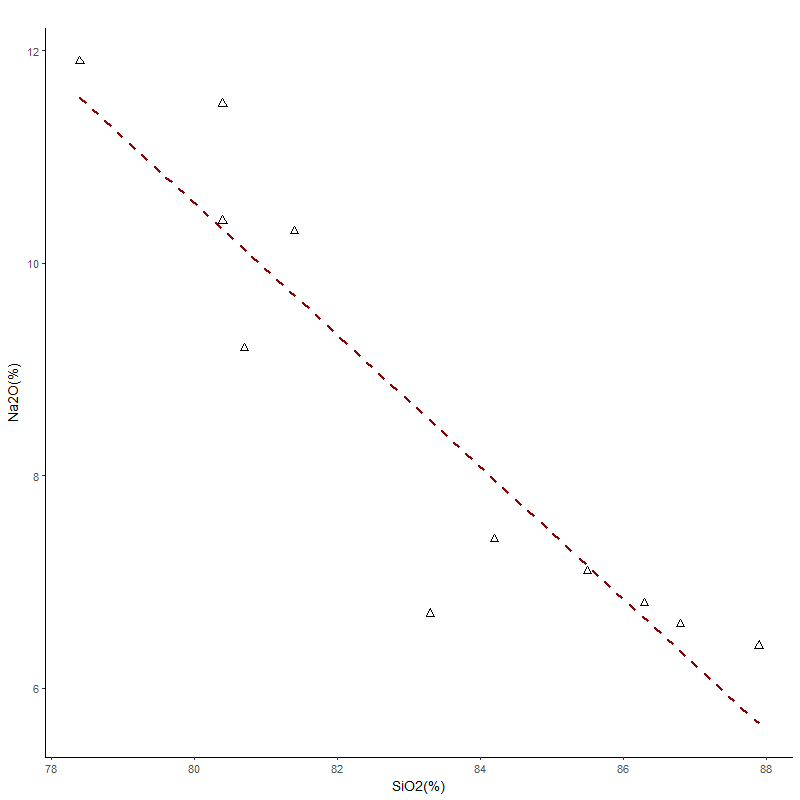
Figure 18: Bivariate plots and associated density plots of the major glass-forming oxides for the 18th Dynasty glass from museum collections in Japan. SiO2 and CaO show bimodal distributions. Na2O shows some evidence of a shoulder. Dashed lines on the bivariate plots are linear regressions applied to the data. The dotted lines on the density plots show the average concentrations of each component in weight % (data from Abe et al. 2012)
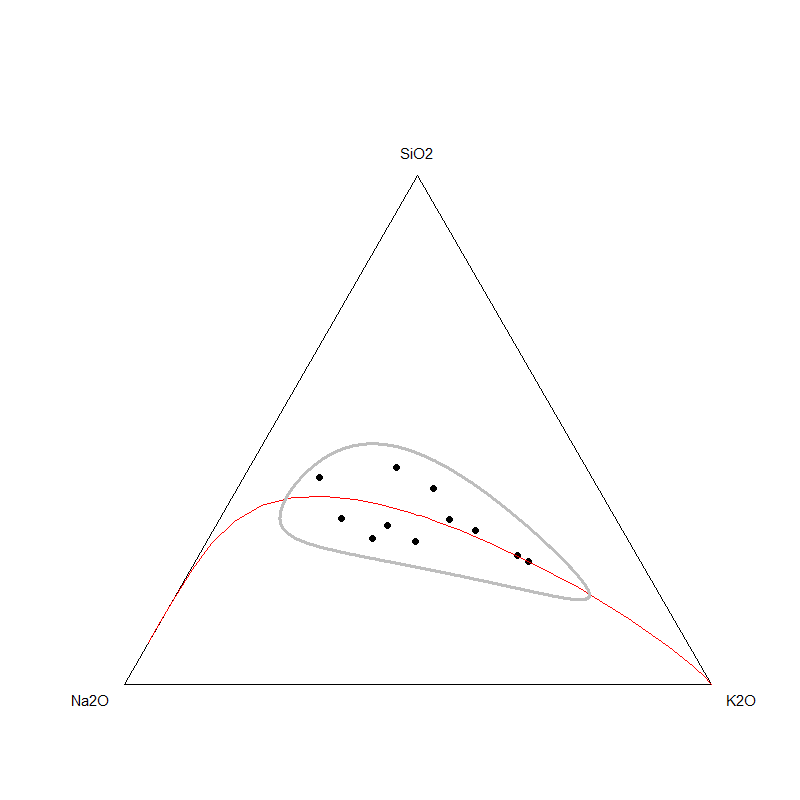
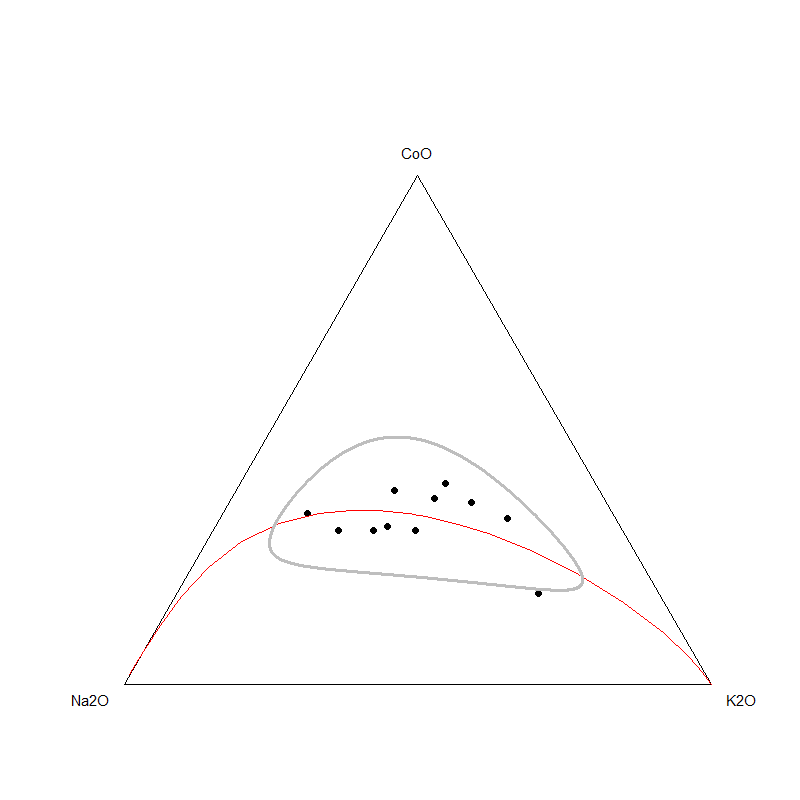
Figure 19: Ternary diagrams for the subcompositions SiO2-Na2O-K2O and CoO-Na2O-K2O exhibiting one-dimensional patterns joining the vertices Na2O and K2O. The red lines display the direction of the principal component of the subcomposition. The ellipse shows the variance structures through 95% probability regions. Data from Tite et al. 1998
Figure 20: Dendrogram derived from the variation matrix of 11 samples of frit from Amarna O45.1. (data from Tite et al. 1998). Note the close association between CoO, SiO2, MgO, Na2O, TiO2, Al2O3 and MnO. CaO is not well associated with any of the other components, presumably because of contamination from the lime coating on the cylindrical vessels where the frit was found
Figure 21: Bivariate plot of K2O vs CoO in weight % for the frit found at Amarna O45.1 (Tite et al. 1998) using WDS, and for glass from Amarna (Nicholson and Henderson 2000) using a probe, and Malkata (Shortland et al. 2007) and Amarna (Tite et al. 1998; Shortland and Eremin 2006) using WDS. Higher levels of CoO appear commensurate with lower levels of K2O, potentially converging on the composition of the frit. The scatter in the data is probably a consequence of contamination from burning wood during recycling, increasing the variation in the K2O data. Note the possible positive linear relationship between K2O and CoO for the frit measurements, suggesting that they entered the system together (two measurements overlap where indicated)
Figure 22: Ternary diagram for the subcomposition CoO-Na2O-SiO2. The red line displays the direction of the principal component of the subcomposition. The ellipse shows the variance structure through 95% probability regions. The tight clustering indicates the low compositional variability between these components
Figure 23: Bivariate plot potentially indicating that silica and soda were added in proportions relative to the total volume of the system to form the frit. Data from Tite et al. 1998
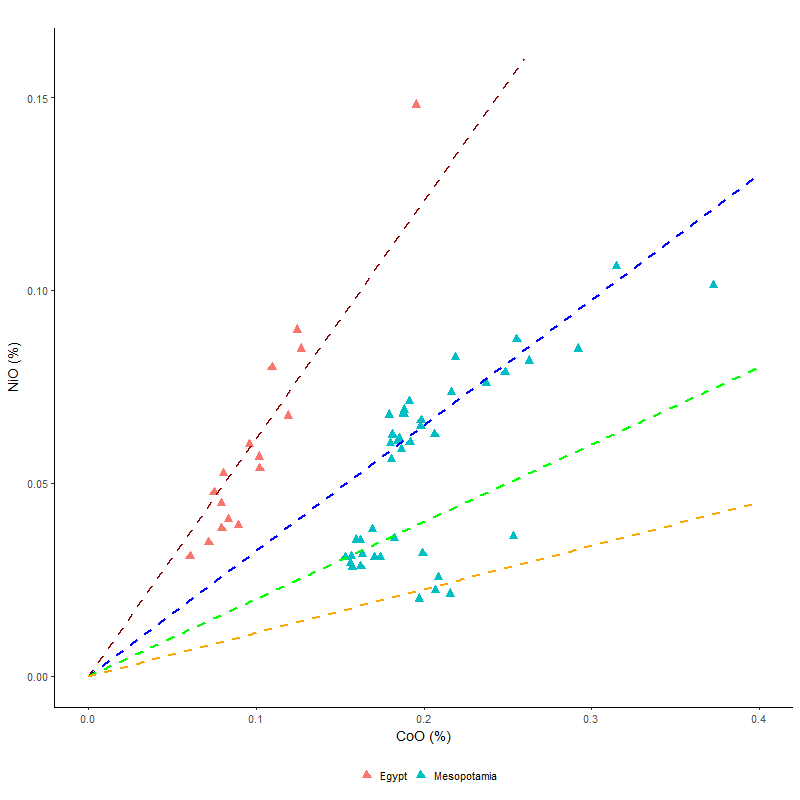
Figure 24: Bivariate plot of NiO vs CoO for glass from 18th Dynasty Egypt and Nippur in Mesopotamia using LA-ICPMS. The linear line for the Nippur axes (blue dashed line) shows that NiO and CoO potentially derived from skutterudite (gradient ~0.3). The gradient of the Egyptian glass data (dark red dashed line) is about twice as high (gradient ~0.6), which could suggest that the five-element ore mineralisation is dominated more by a nickel mineral, such as nickeline. Although it is difficult to place the rest of the Nippur data on lines, they are still consistent with a five-element system that has variable levels of nickel and cobalt in the mineralisation. LA-ICPMS data for cobalt-blue glass from Amarna and Malkata (from Varberg et al. 2015; 2016; Shortland et al. 2007) and Nippur (Walton et al. 2012)
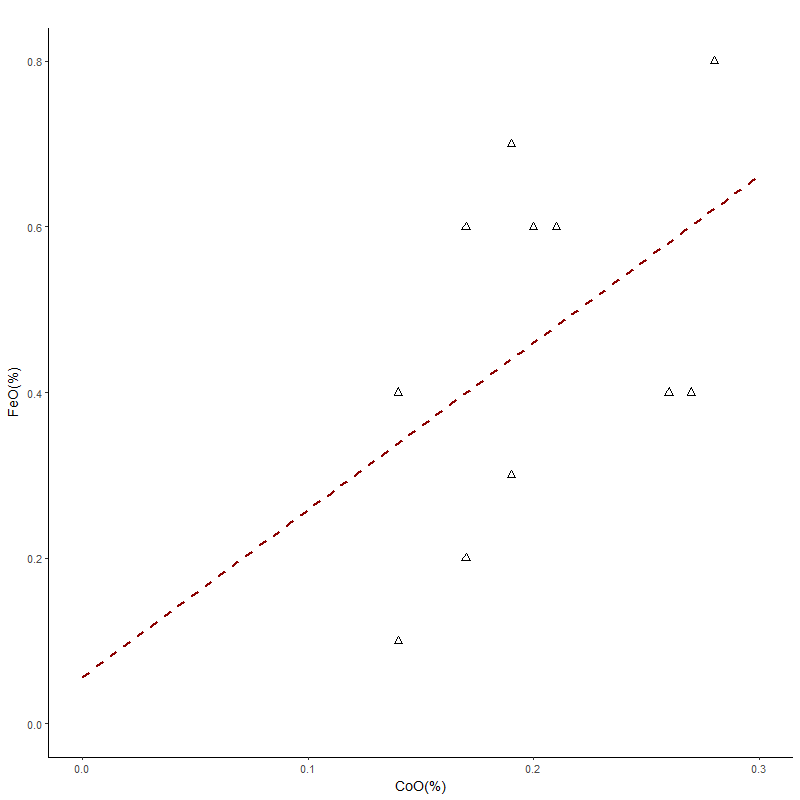
Figure 25: Bivariate plot potentially showing a possible linear relationship between FeO and CoO in the frit found at Amarna O45.1, supporting that cobalt entered the system from the mineral skutterudite ((Co, Ni, Fe) As2-3) as suggested by the linear interaction between NiO and CoO in Figure 2, Figure 6 and Figure 24. Data from Tite et al. 1998
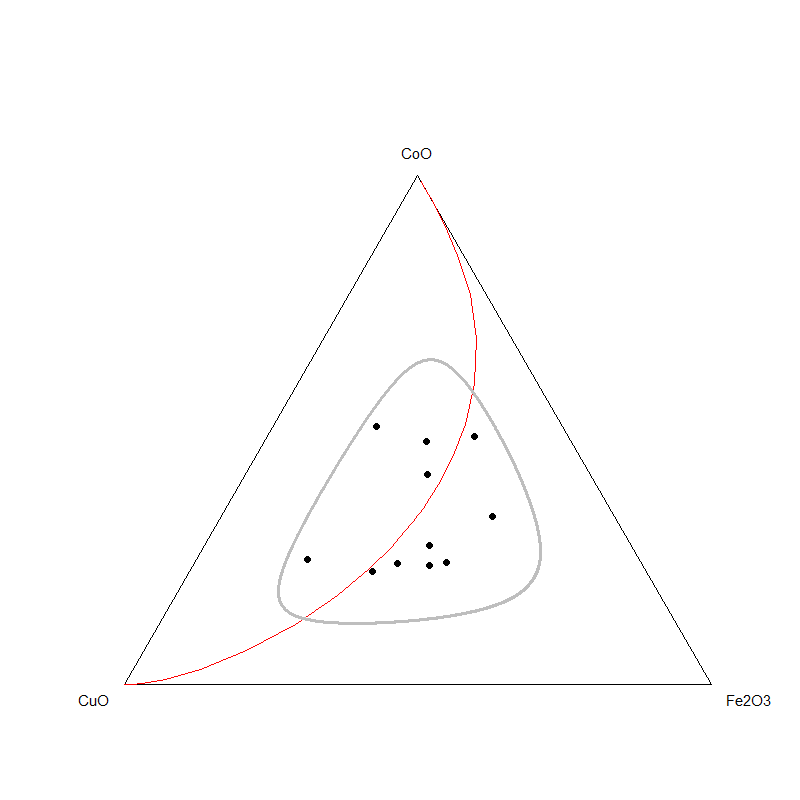
Figure 26: Ternary diagram for the sub-composition CuO-Fe2O3-CoO exhibiting a broad pattern suggesting that the compositional variance is shared between each of the components. The red line displays the direction of the principal component of the subcomposition. The ellipse shows the variance structure through 95% probability regions. Data from Tite et al. 1998
Figure 27: Energy dispersive X-ray spectrum for an opaque blue glass from Amarna showing X-ray peaks above background. In addition to the major components of soda, lime and silica, the significant antimony peak reflects the presence of calcium antimonate as an opacifier. The presence of cobalt, silver and nickel is suggestive of an Ag-Ni-Co-As ore. As arsenic is volatile its absence is not unexpected. Any bismuth and uranium present are likely to have been below the detection limits. (Adapted from Nicholson and Henderson 2000)
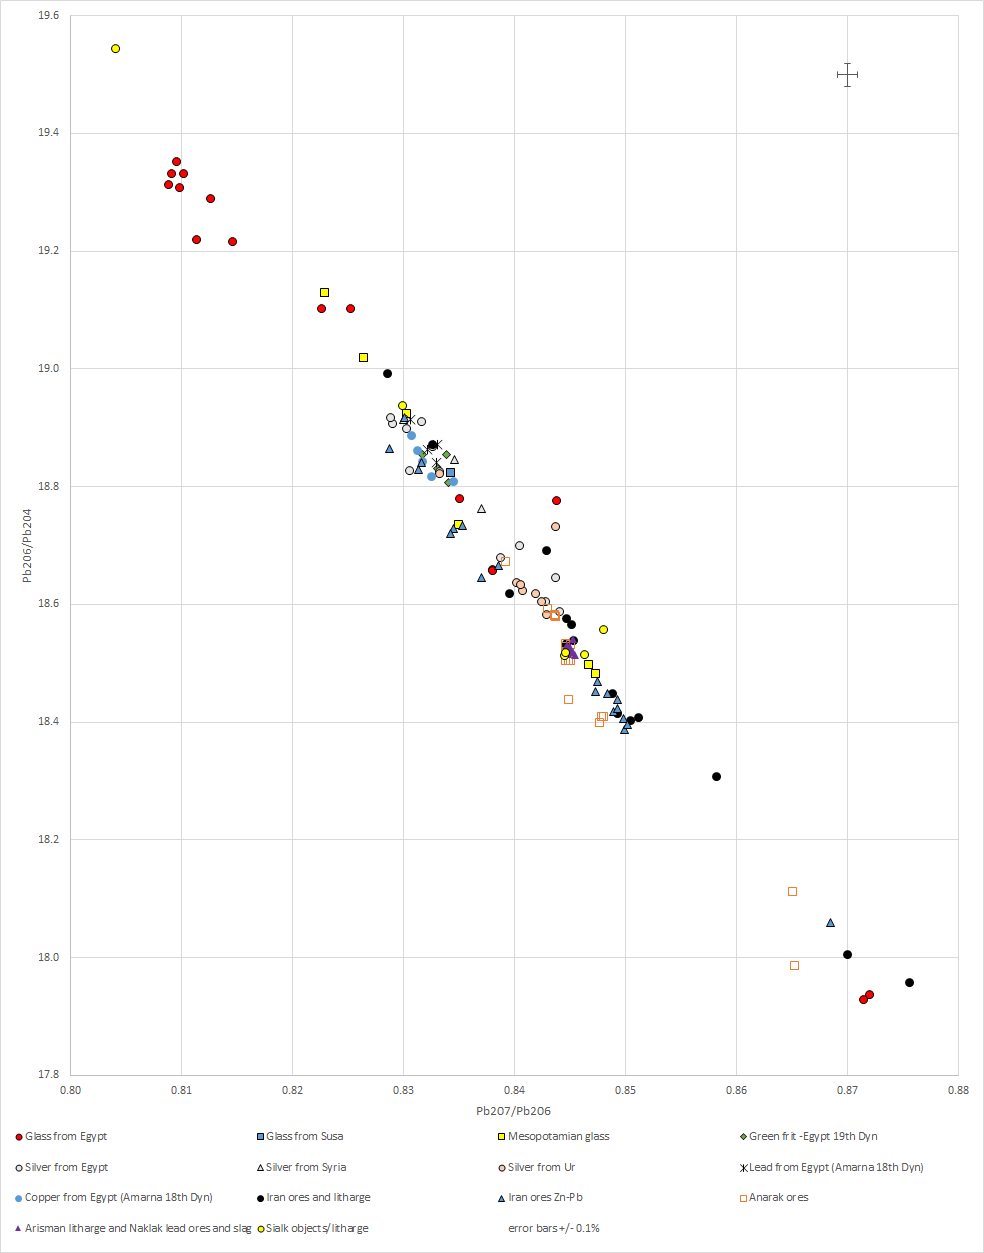
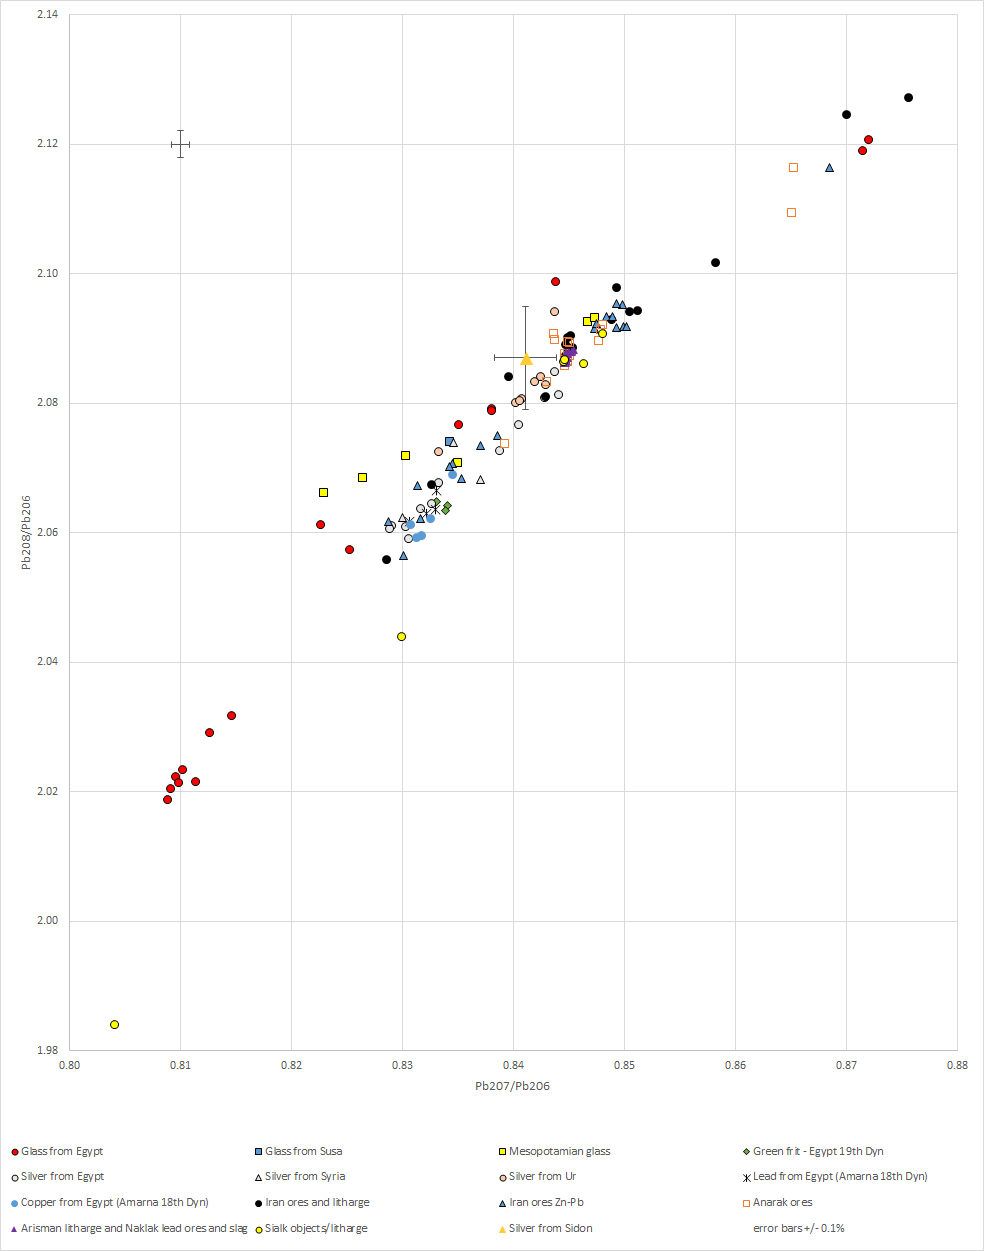
Figure 28a/Figure 28b: Lead isotope mirror plots. Glass from Mesopotamia (i.e. Tell Brak and Tell Rimah) (Shortland 2006), Egypt and Susa (data from Lilyquist and Brill 1993, 66); green glass frit from El Rakham, Egypt (19th Dynasty) (Shortland 2006); Tappeh Sialk objects and litharge (data from Nezafati et al. 2008); silver from Egypt and Syria (data from Oxalid 2018); silver from Sidon (data from Veron and Le Roux 2004); silver from Ur (data from Klein et al. 2016); Iran ores and litharge (Stos-Gale 2001, 56); Anarak ores (data from Pernicka et al. 2011; Nezafati et al. 2008, fig. 4c); Arisman litharge and Naklak lead ores and slag (Pernicka et al. 2011); Iran ores from UDZ and SSZ zones in Iran (Mirnejad et al. 2011); copper and lead objects found in Egypt (data from Shortland 2006). Glass from Egypt and Susa and silver from Egypt, Syria, Ur and Sidon are consistent with ores in Iran, particularly the Anarak district of central Iran. Silver from Sidon shows a tight range of values that covers all the silver artefacts tested from Burial 27. Copper and lead objects found at Amarna also fall near Iranian ores. Note: colours depicted on plot do not represent the colours of the glasses
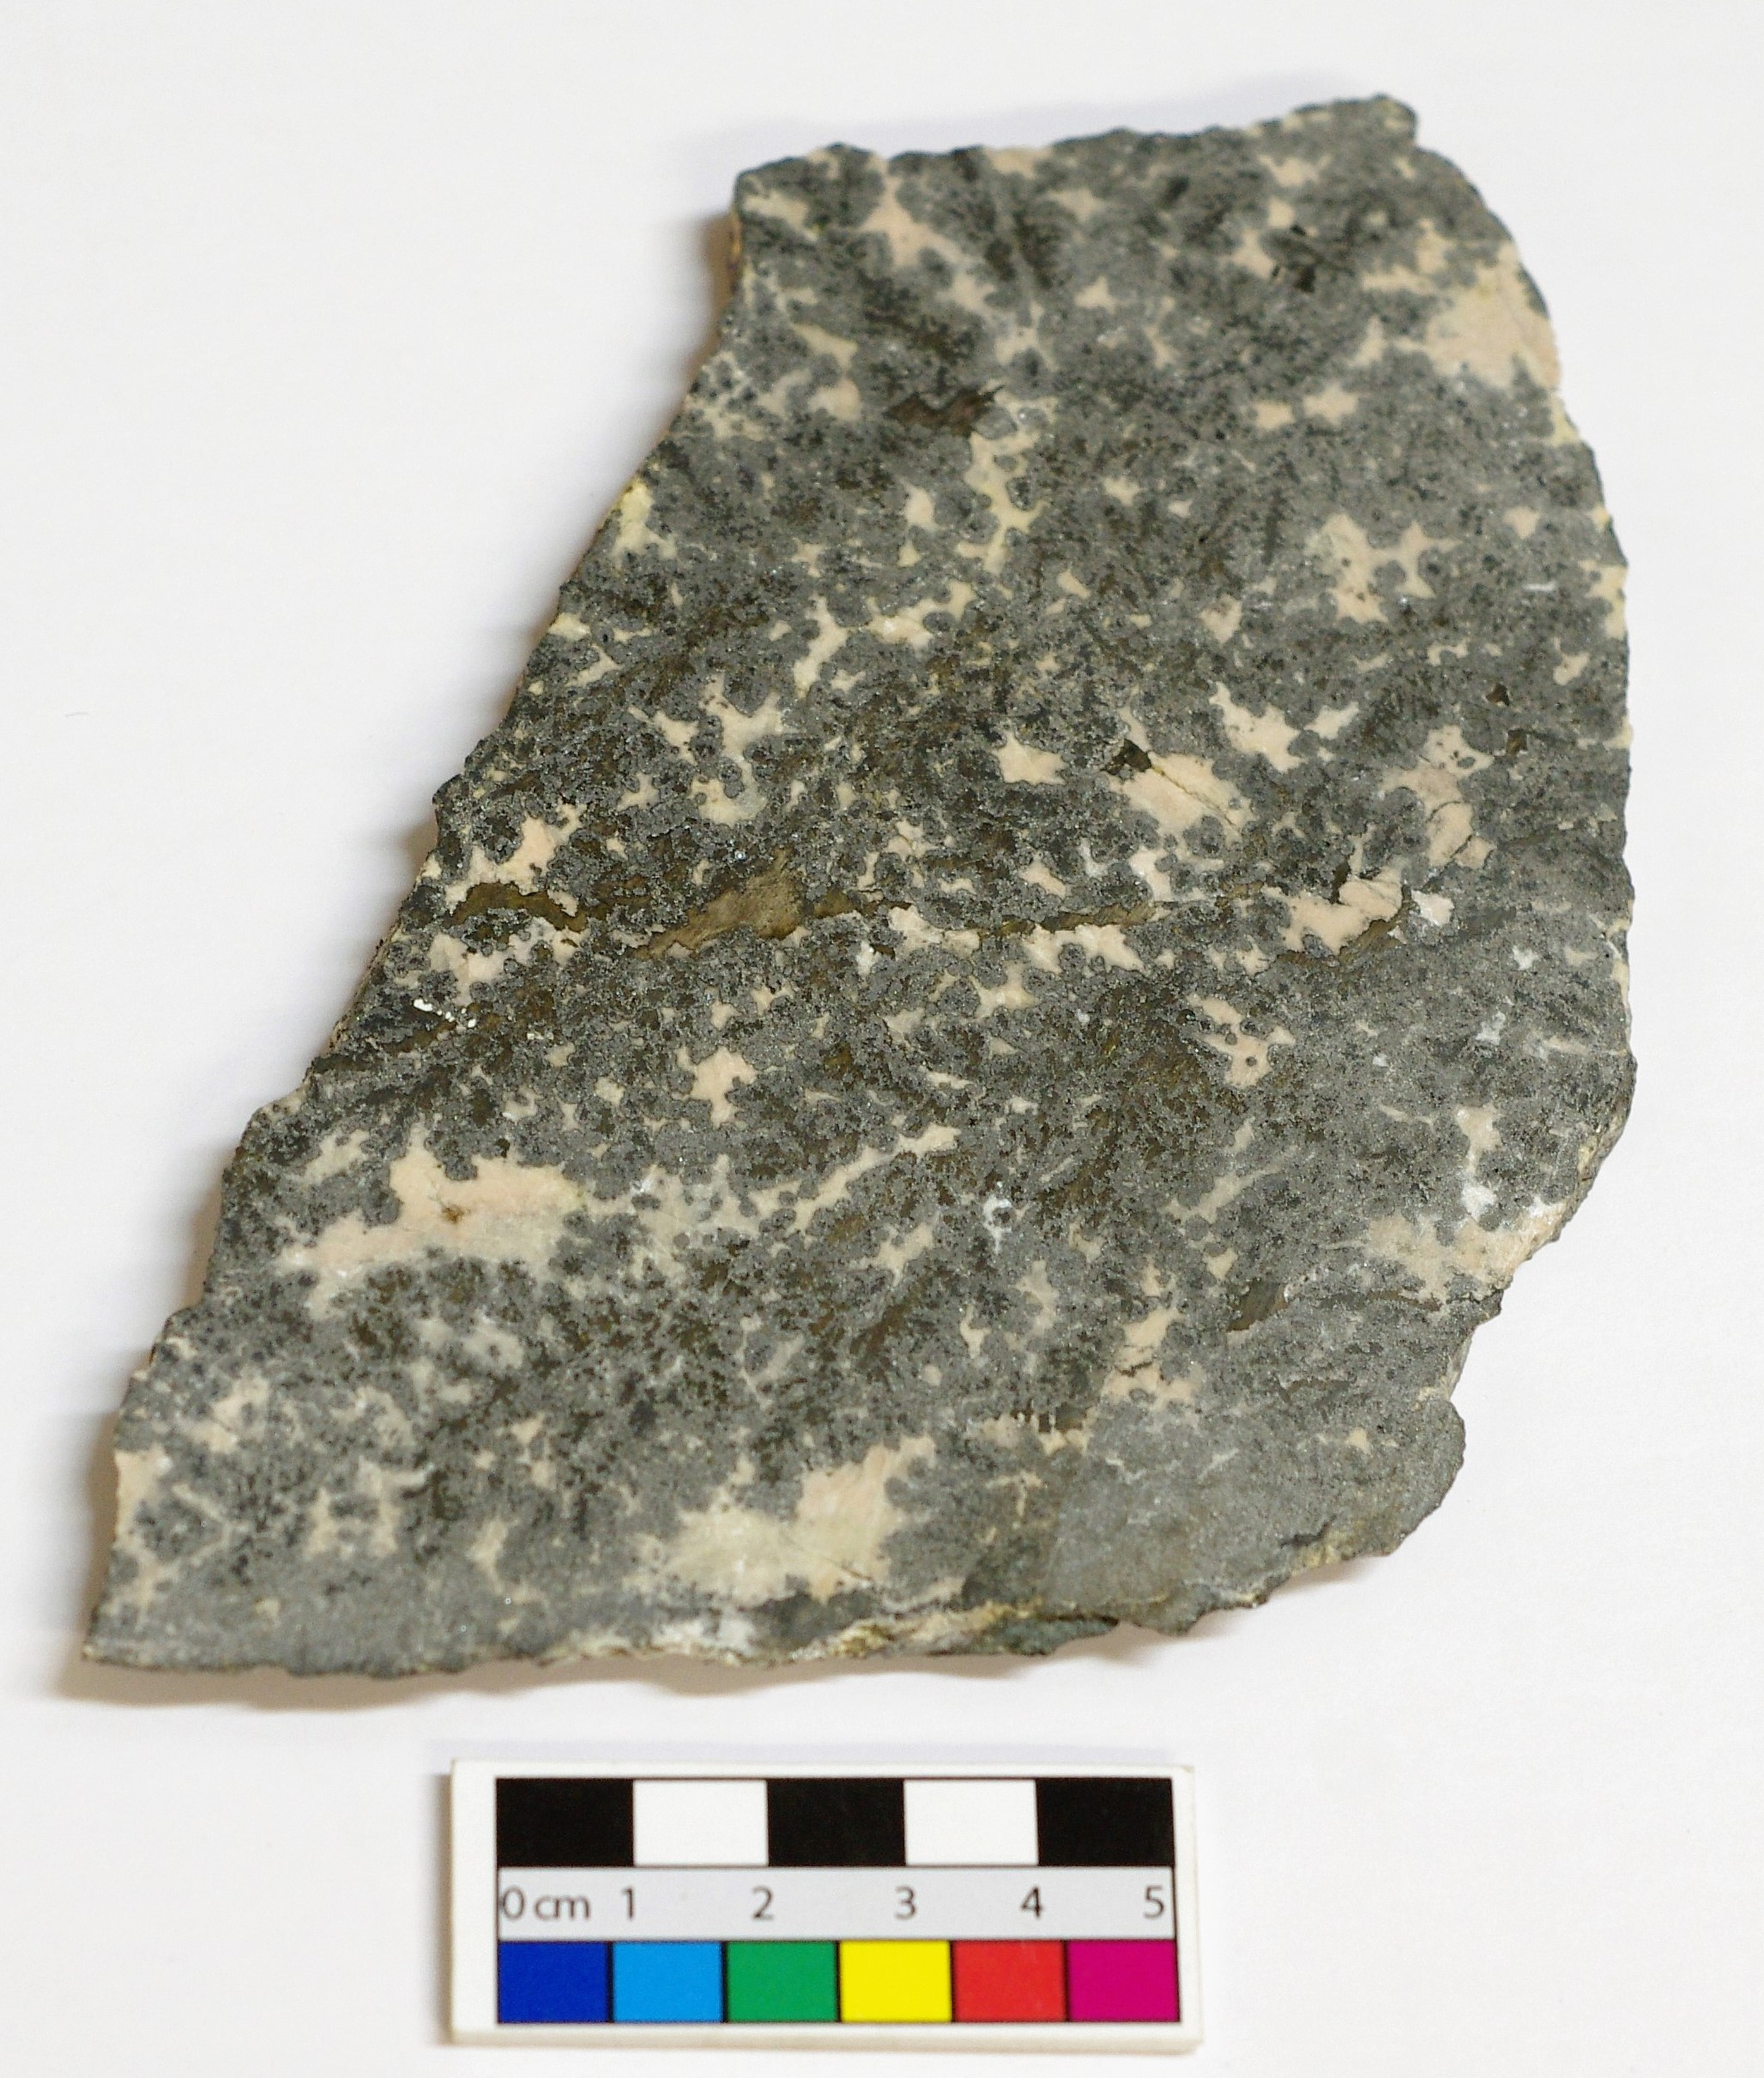
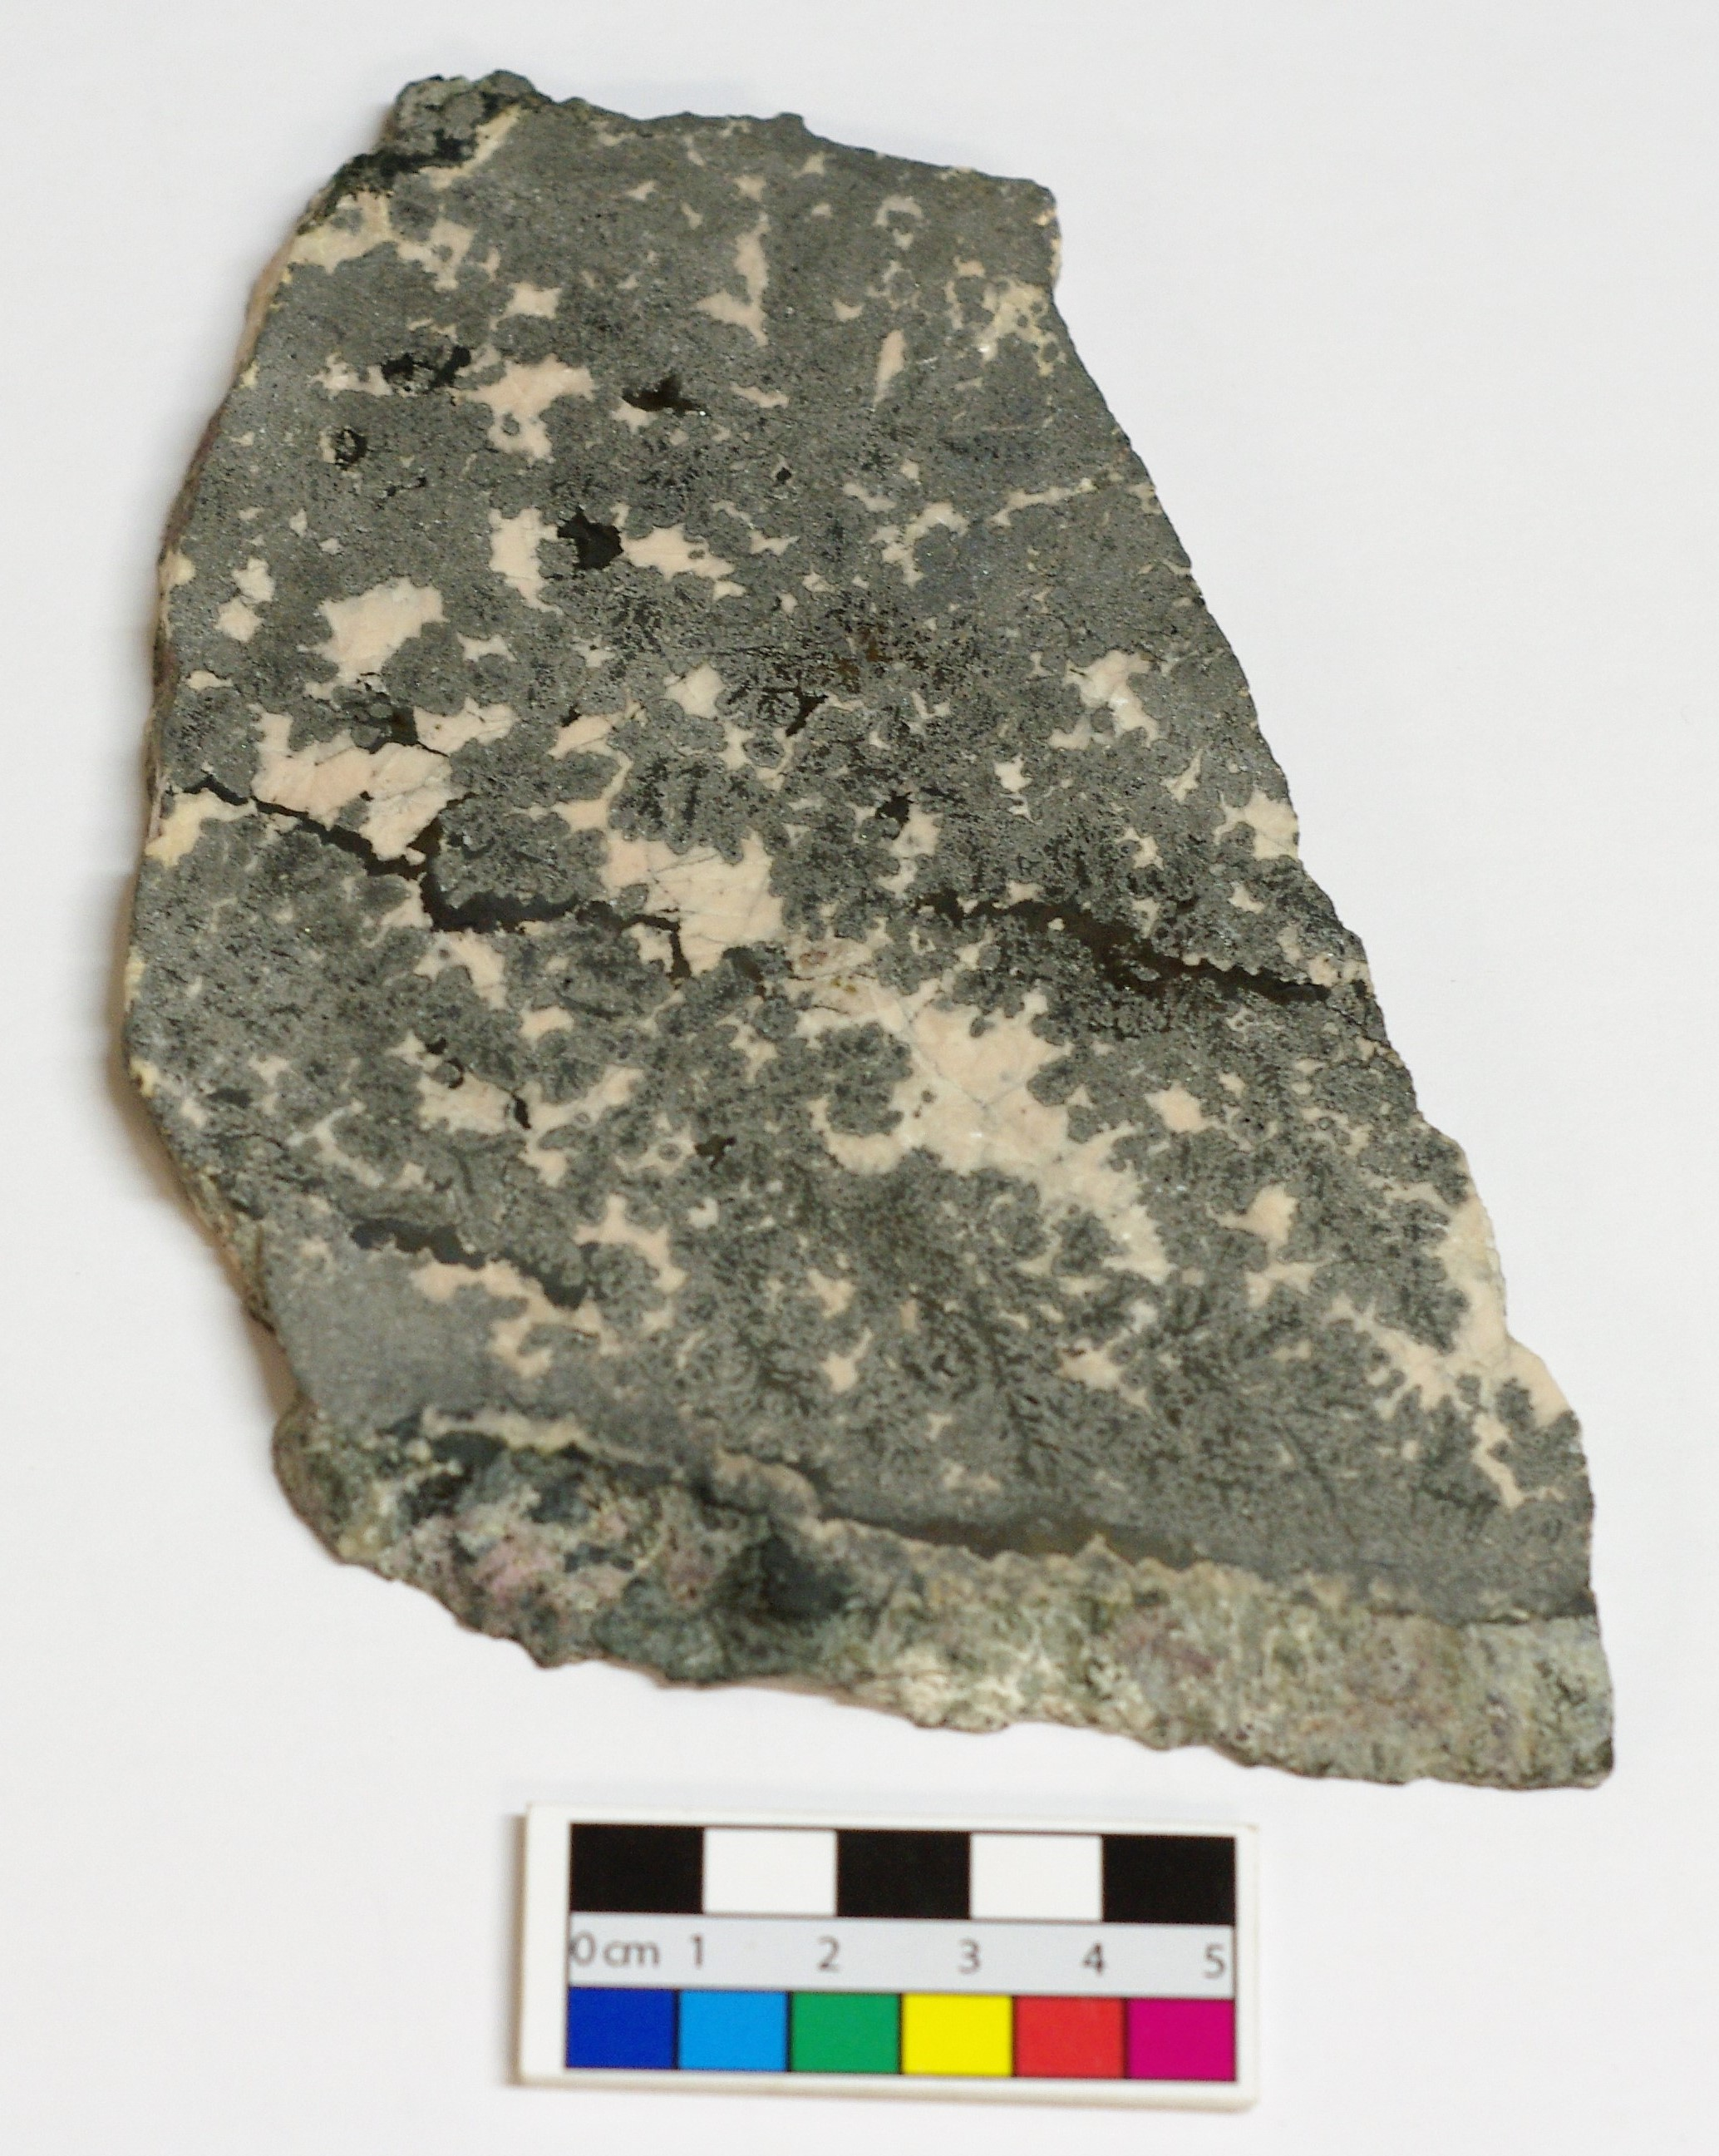
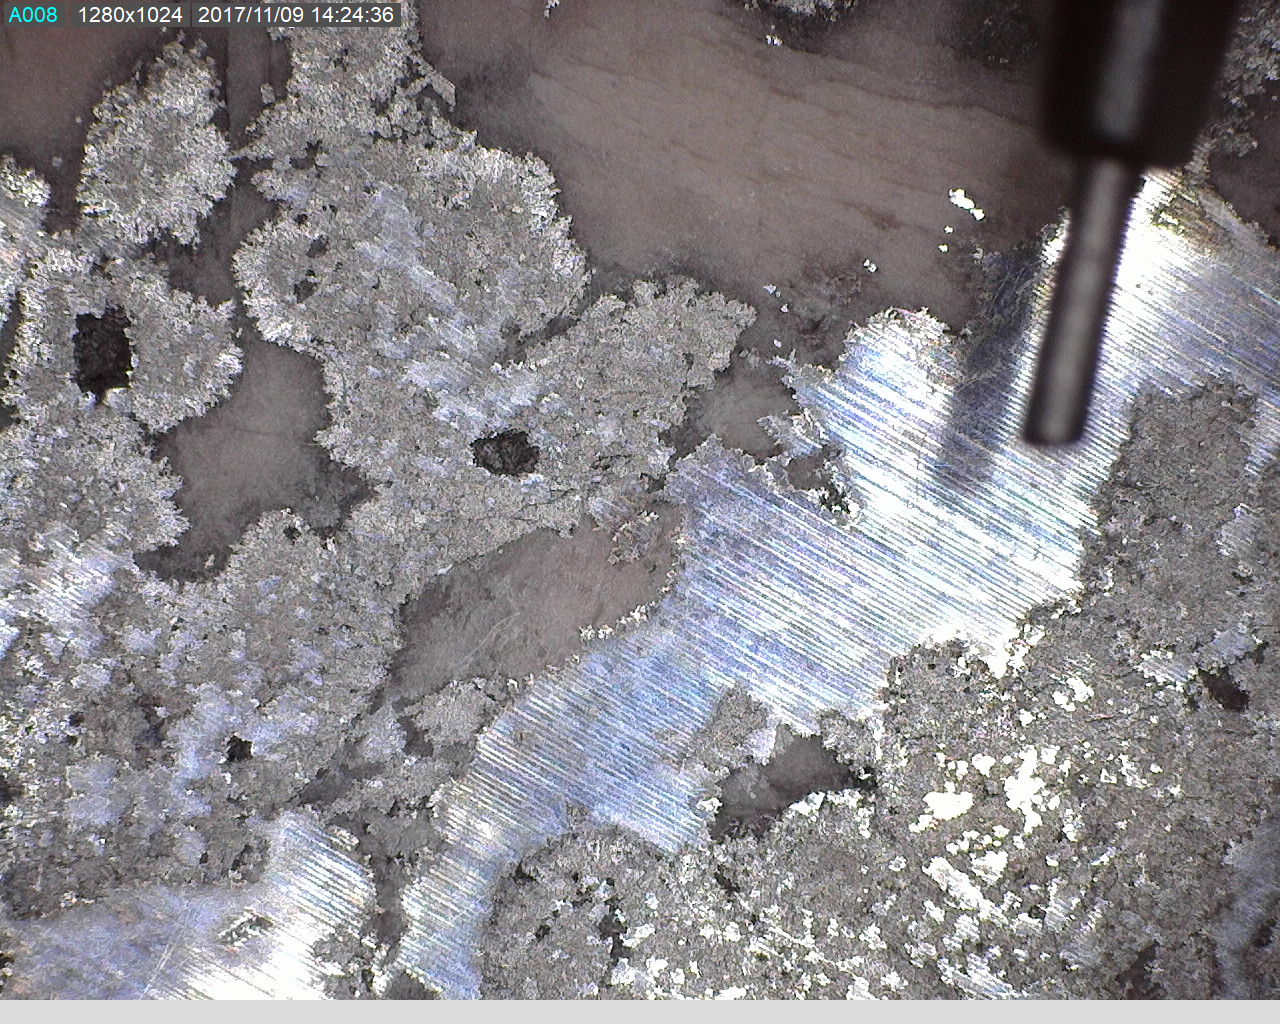
Figure 29: The faces of the ore slab from the Silverfields mine, Cobalt, Canada (Figure 29a, Figure 29b). Images captured using a Dino-Lite digital microscope showing the native silver and cobalt arsenide phases (Figure 29c, Figure 29d)
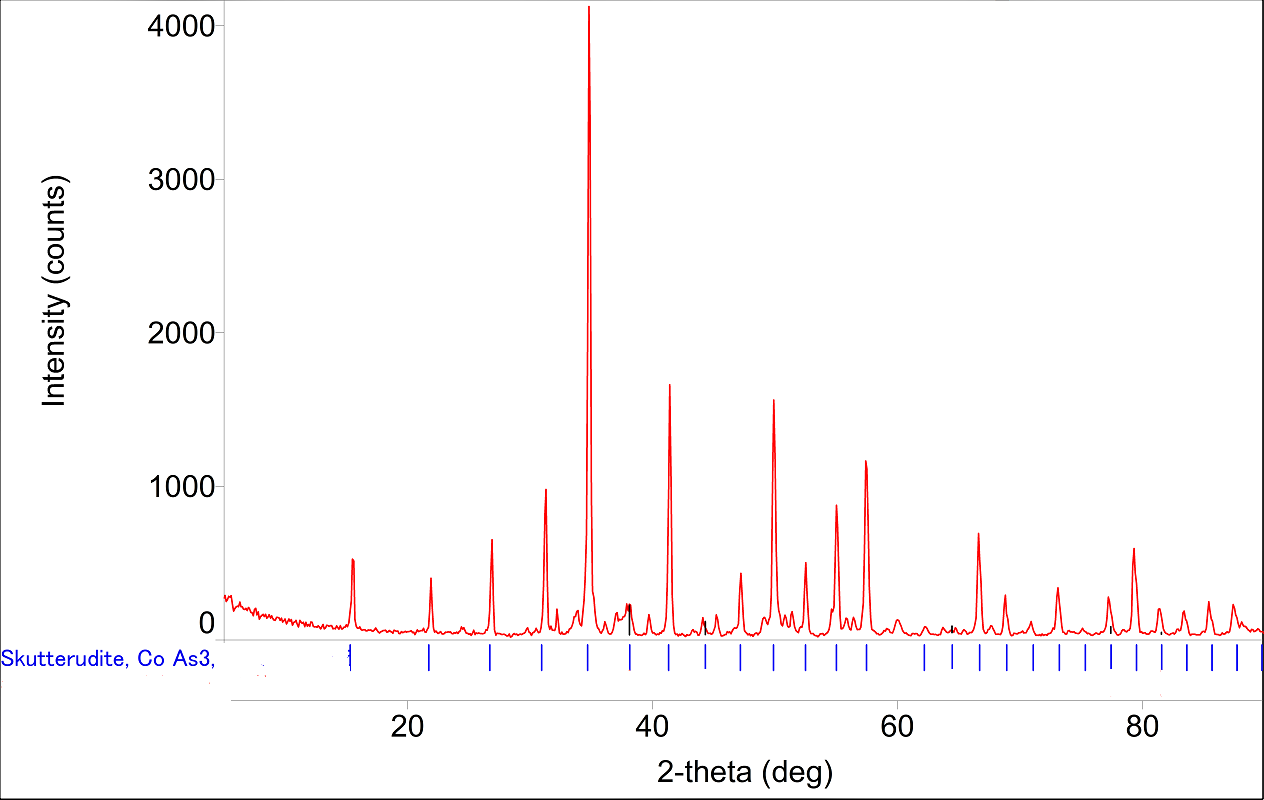
Figure 30: XRD diffractogram for a representative section of the ore, showing skutterudite as the main mineral phase
Figure 31: The sectioned sample showing the cobalt-blue glass and the metallic bead. Unreacted silica can be seen in the glass part. Note that the sample has been inverted from its position in the conical carbon crucible, i.e. the metallic phase was at the bottom
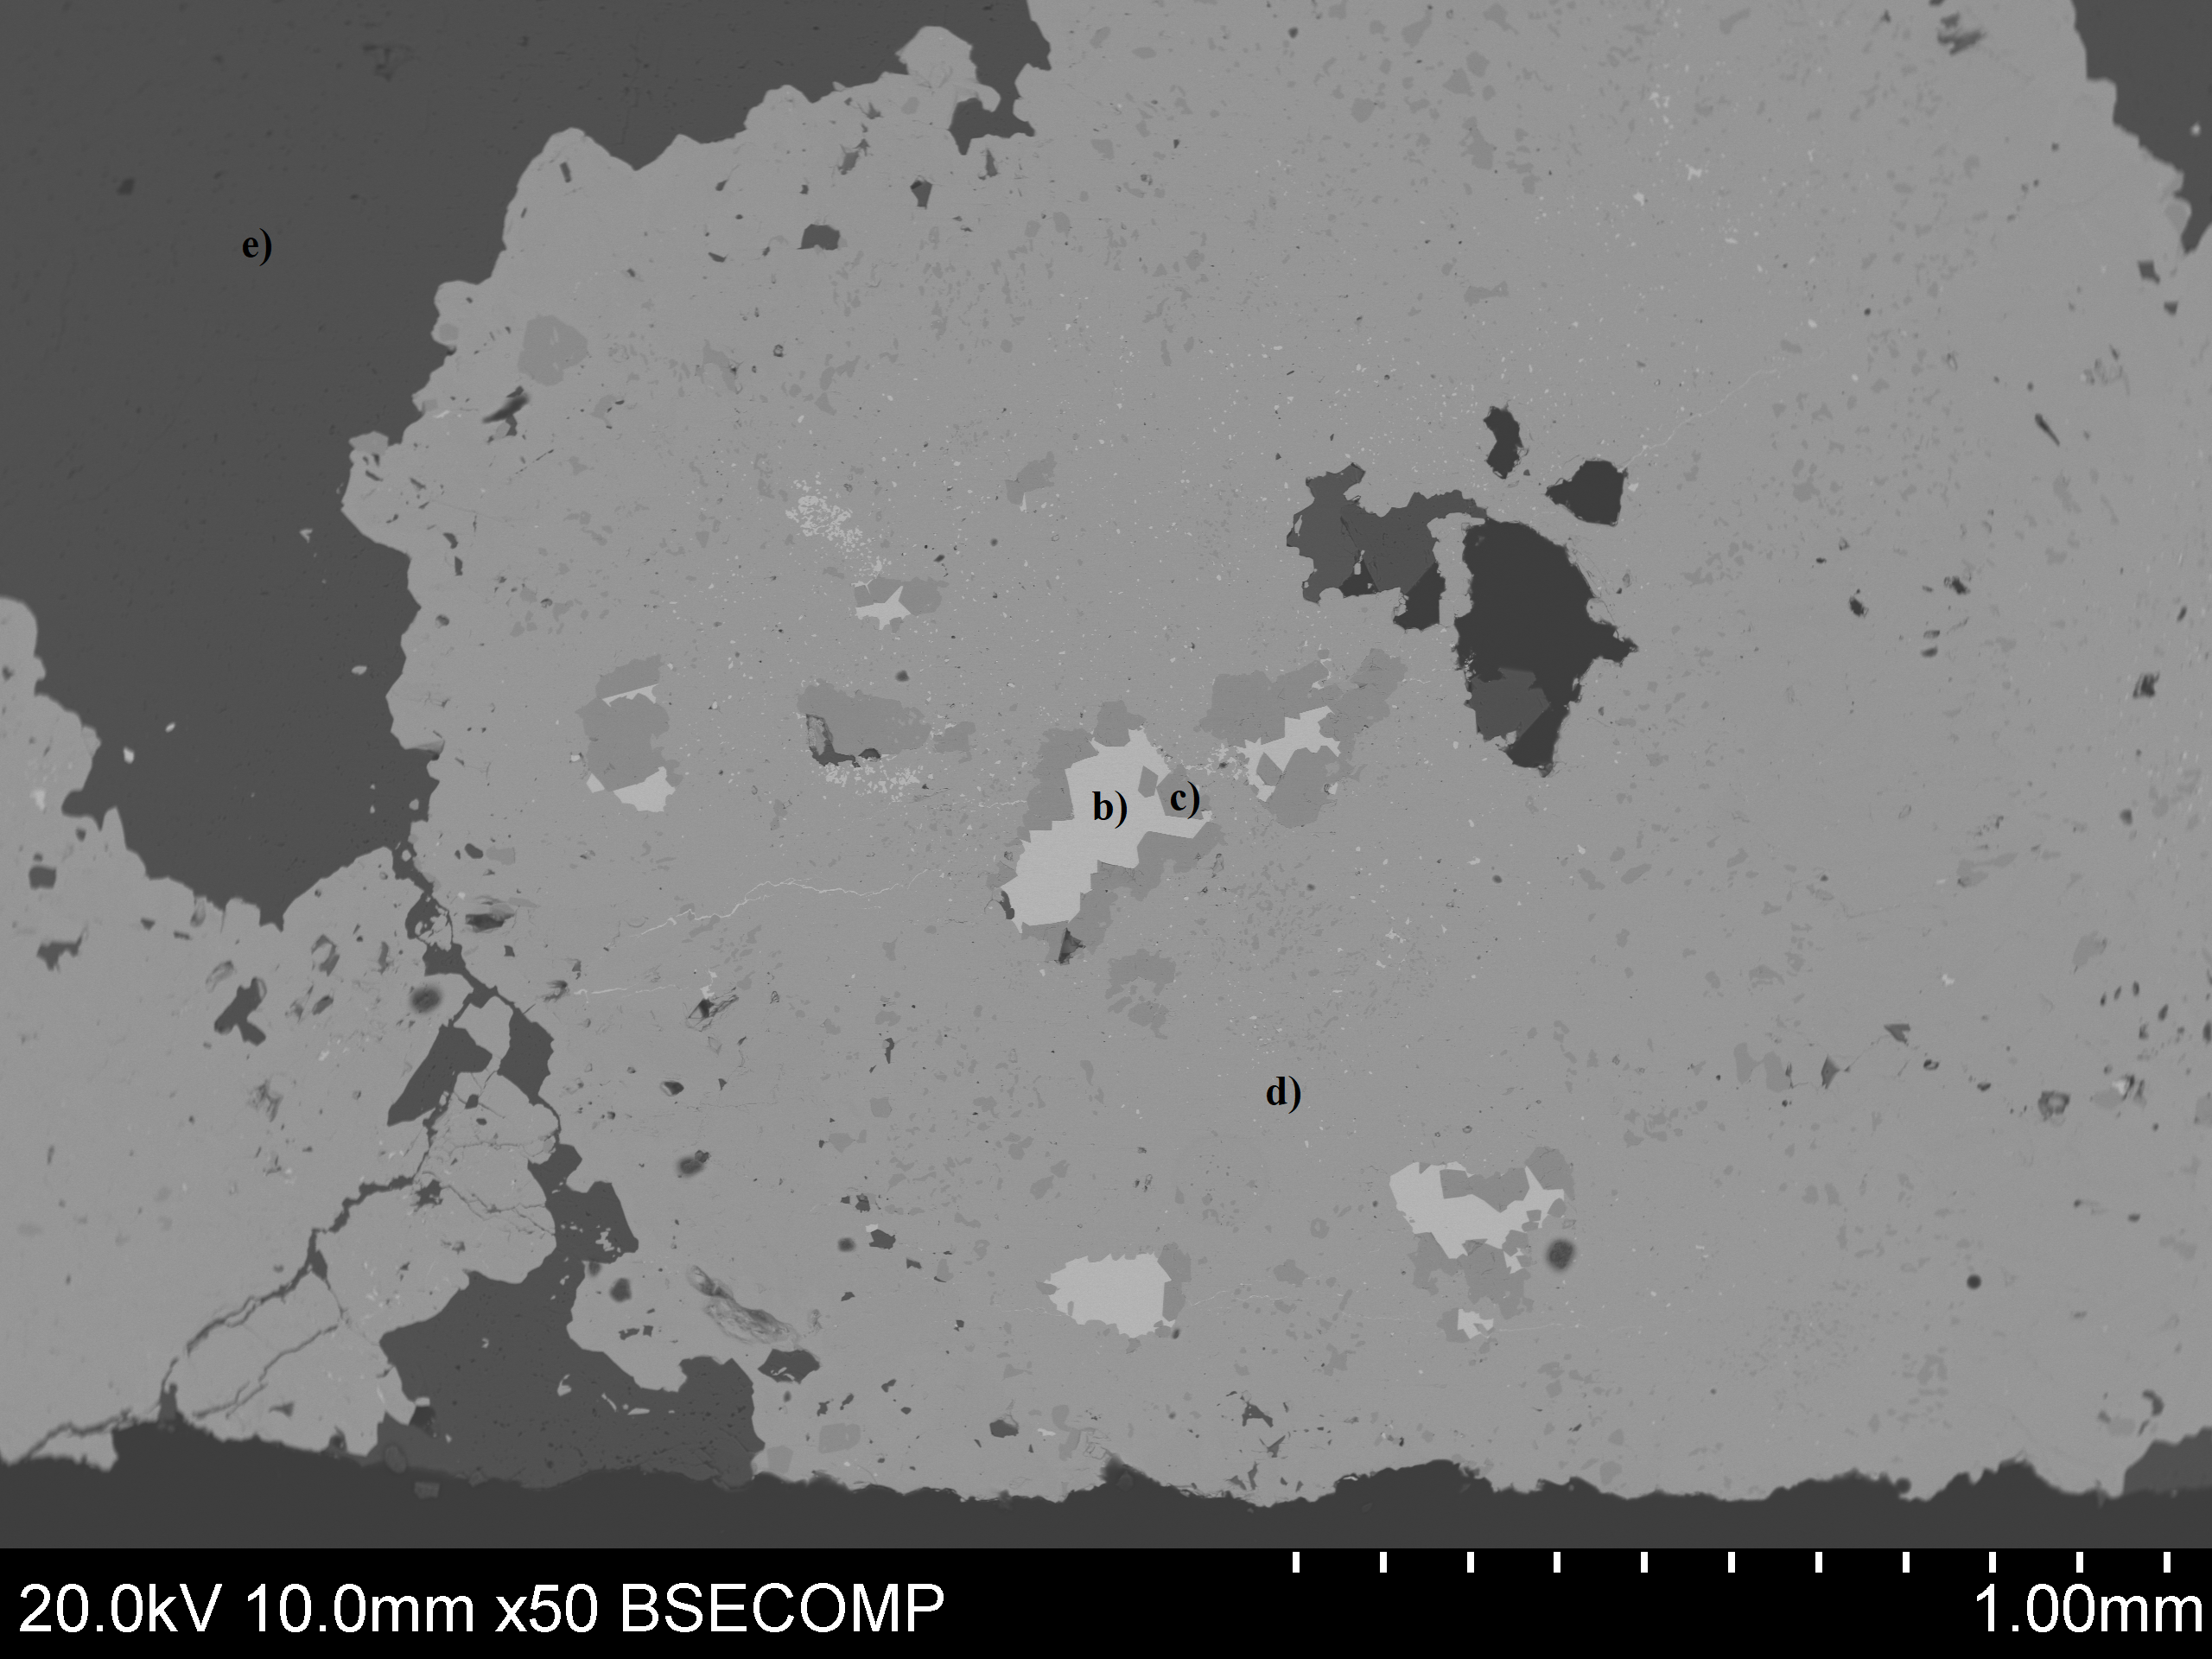
Figure 32: Back-scattered images of the ore showing the phases described in the text: a) the variable composition of the ore (field of view); b) the silver-rich phase; c) and d) Cobalt and nickel were found in association with arsenic in two discrete phases with sulphur and iron; e) Mg and Ca was also present in the ore. All compositions are in normalised wt%
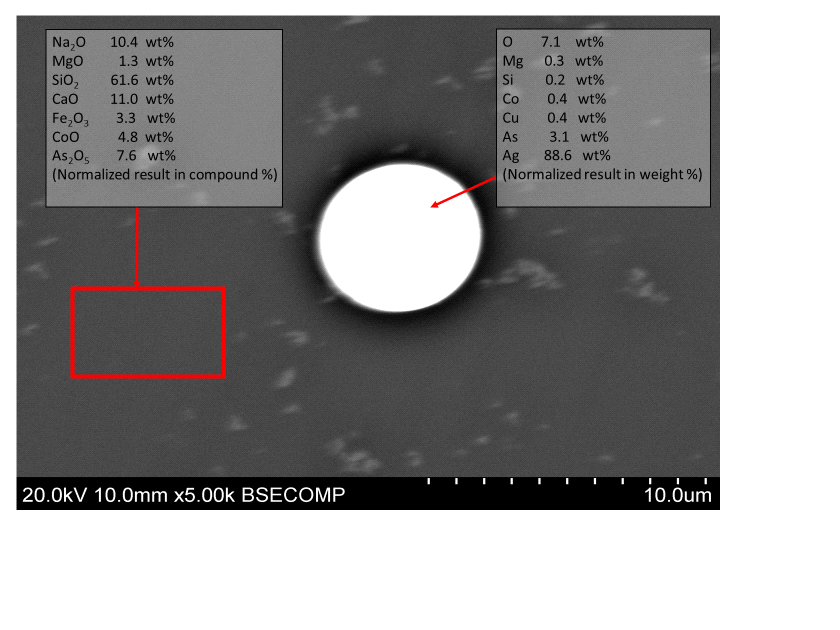
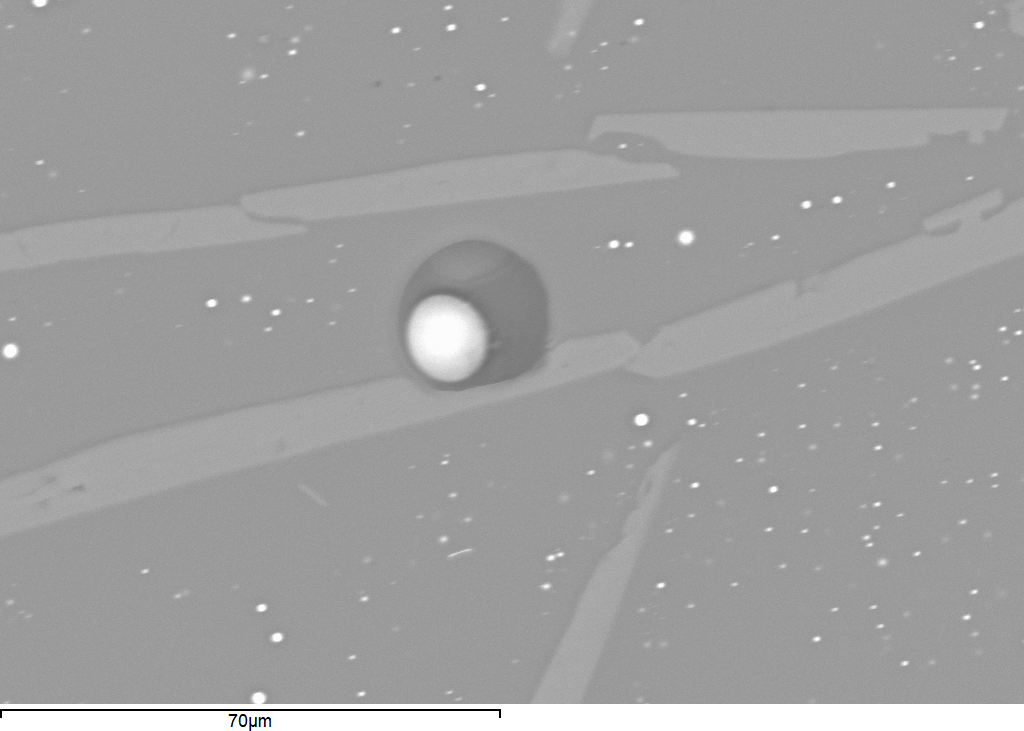
Figure 33: Silver prill entrapped in the glass part of the sample. Copper is also present in the silver. Note that the lower amounts of silver in this prill are potentially a consequence of penetration depth and area of the EDS, which at this magnification has scanned part of the area around the prill
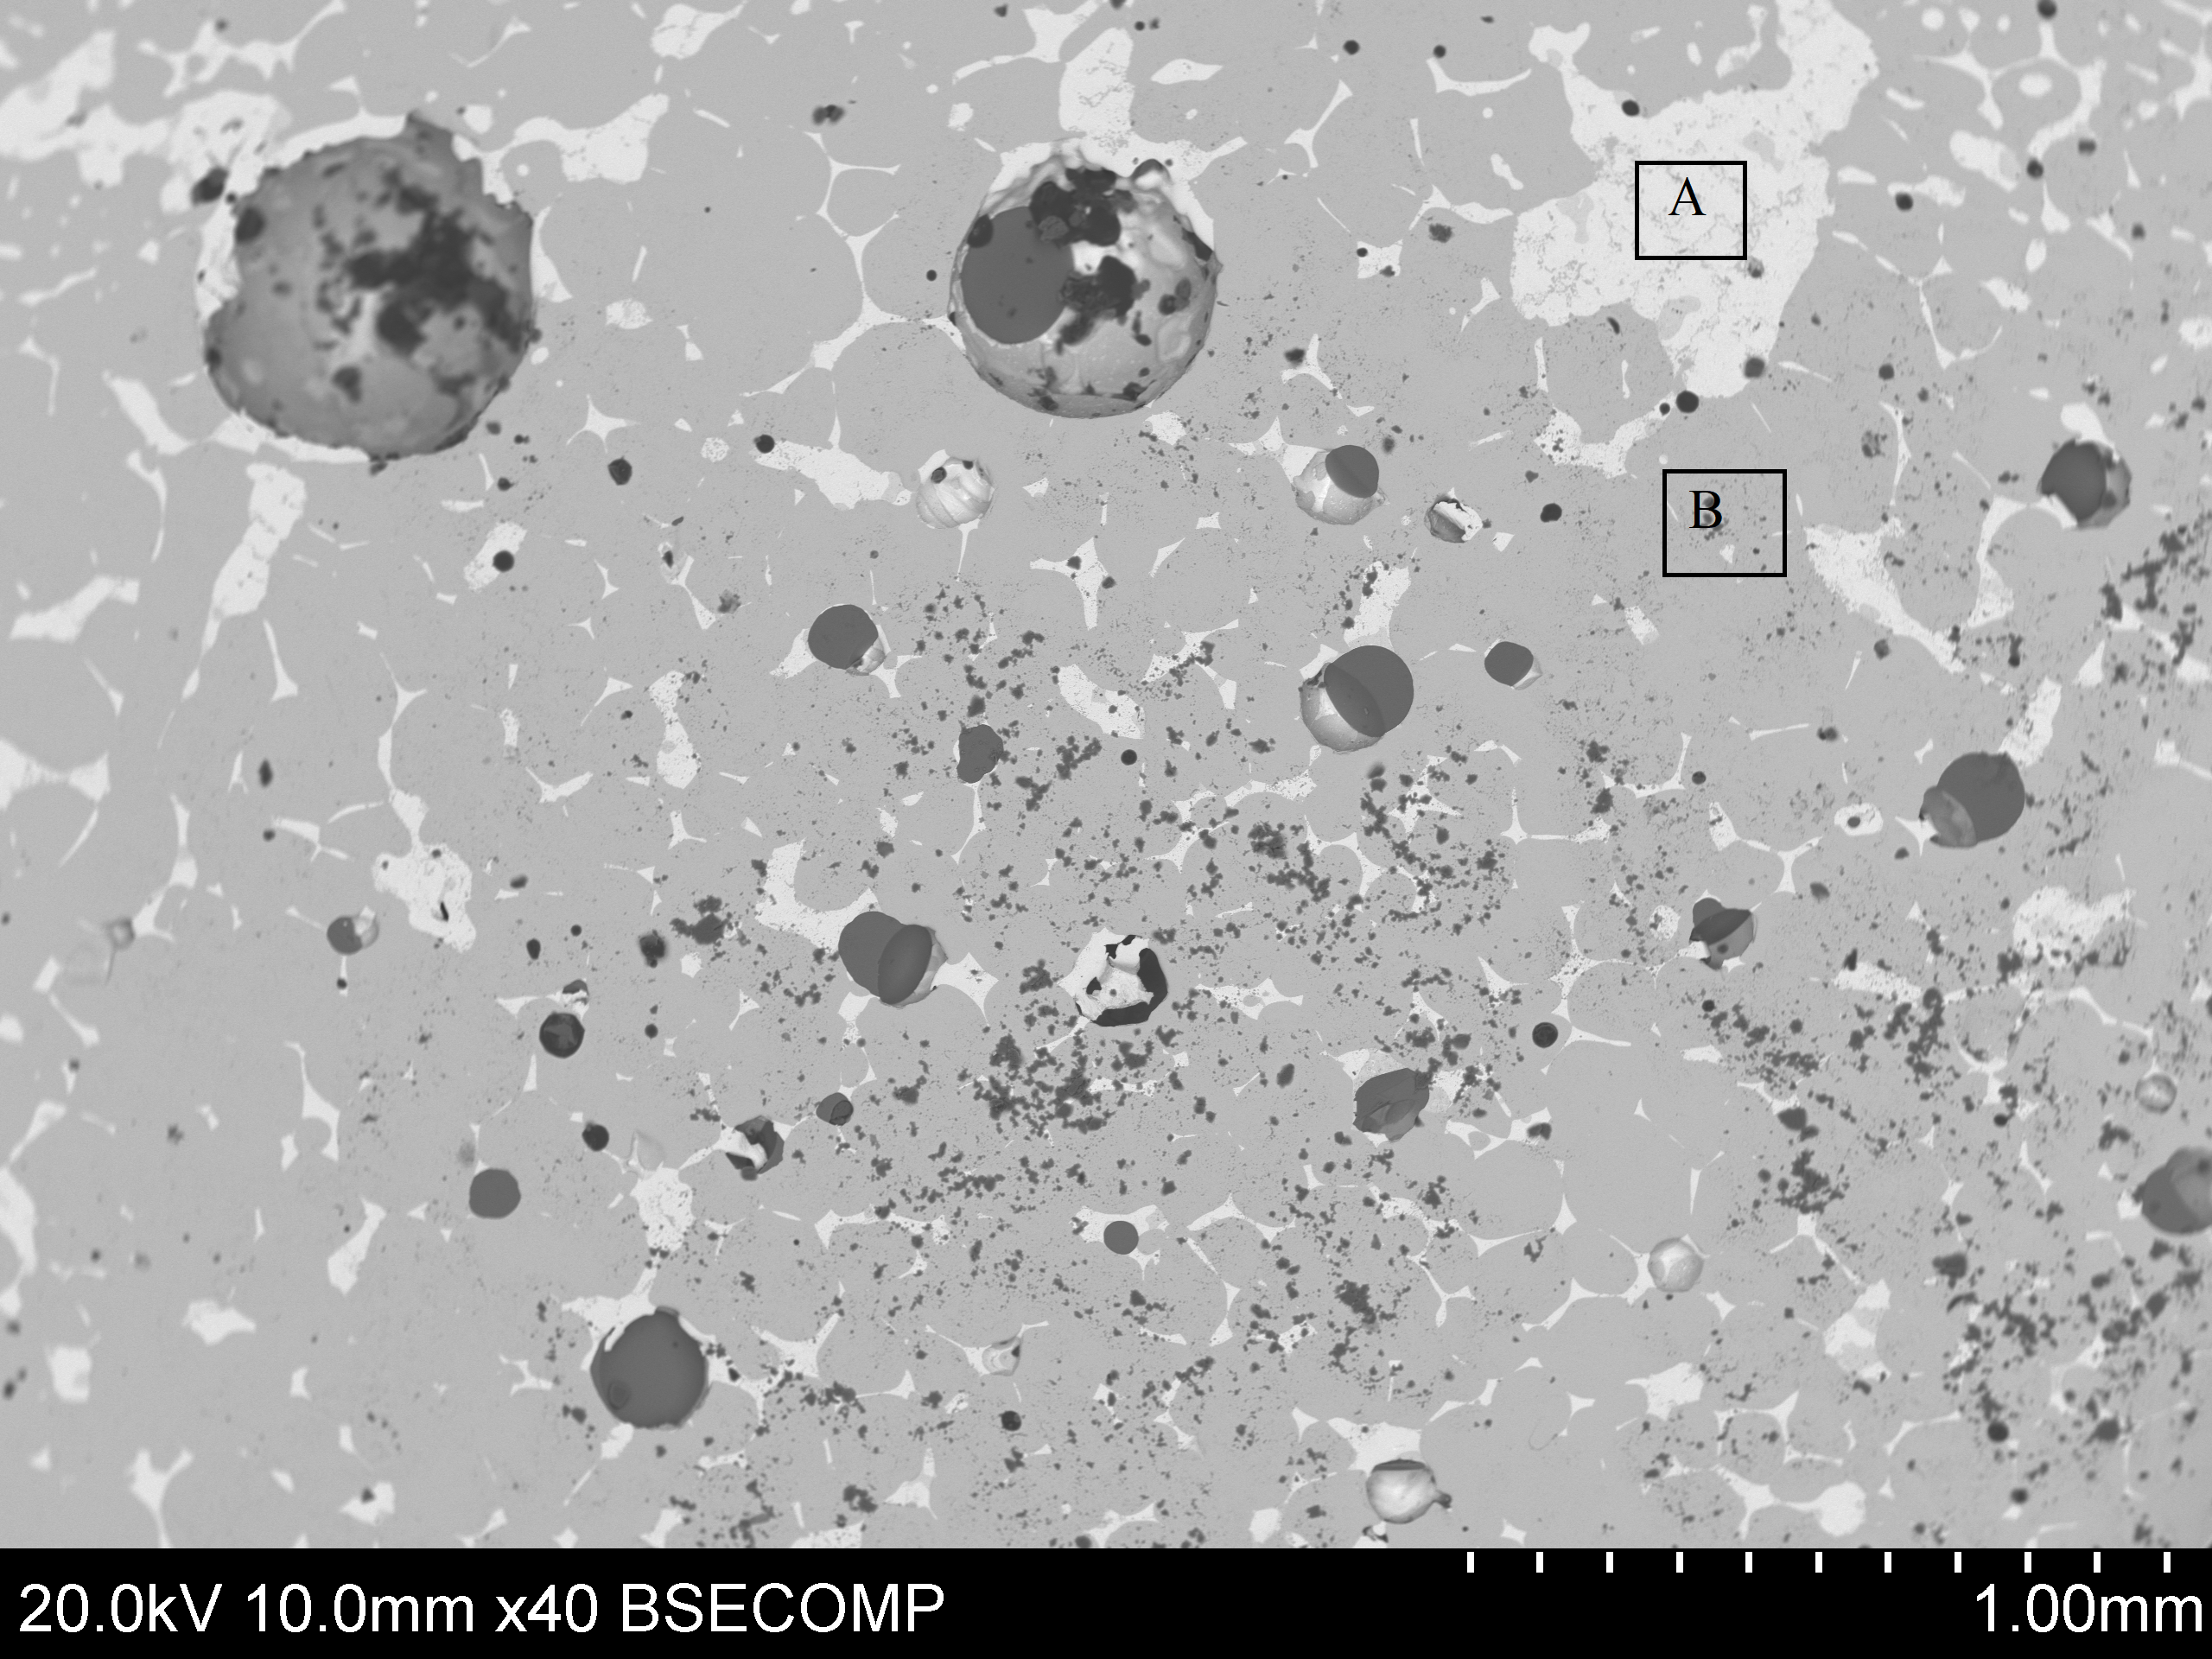
Figure 34a: Back-scattered image of the metallic bead showing silver-rich (brighter) and cobalt-nickel-arsenic rich (darker) areas. The round, dark areas are voids possibly indicating the presence of silver prills that were lost during polishing (see Figure 35). Figure 34b: Silver-rich Area A had a composition of 70%Ag, 13.6%As, 3.2%Cu, 0.6%S and 11%O (normalised by element) Figure 34c: the cobalt-nickel-arsenic rich Area B had a composition of 33.5%Co, 51.7%As, 6.7%Ni, 0.2%S and 5.7%O (normalised by element)
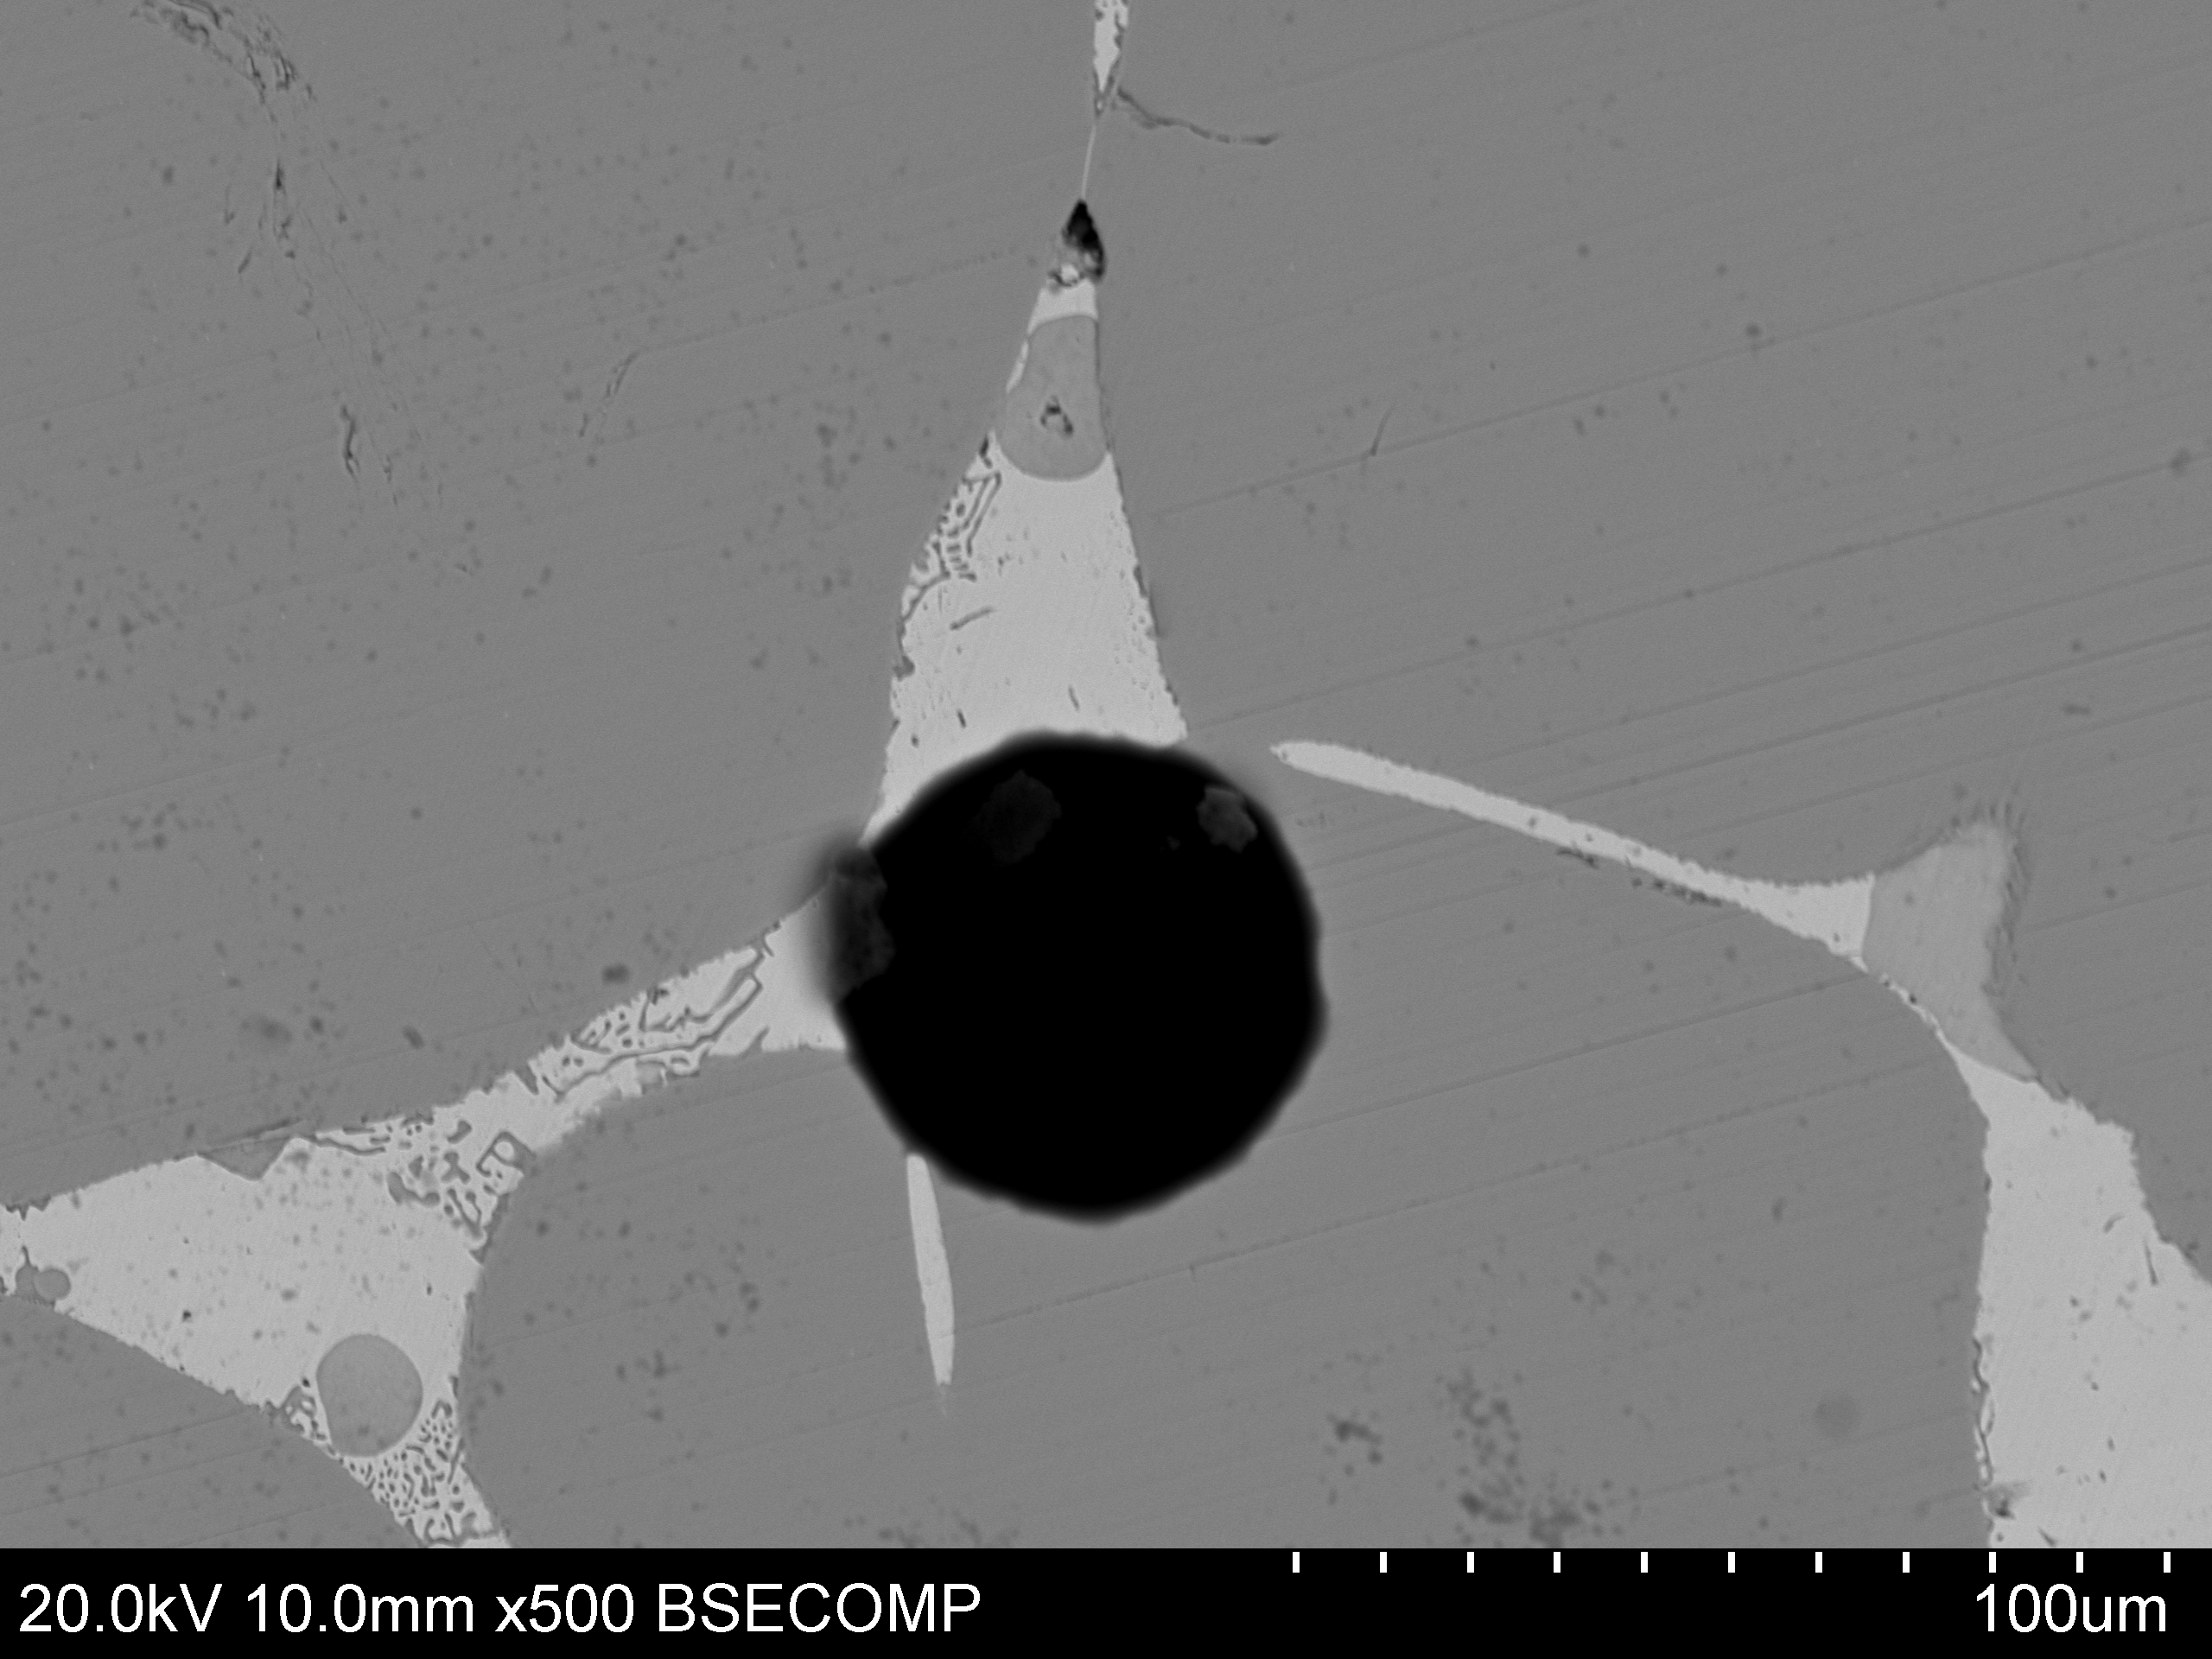
Figure 35: A spherical void possibly indicating a lost silver prill in the metallic part of the sample. Surrounding the spherical void, the dark grey area is predominantly Co-Ni-As (normalised by element: 56.6%As, 37.0%Co, 5.6%Ni, 0.58%O, 0.25%S) and a light grey silver-rich phase (normalised by element: 91.9%Ag, 5.5%As, 0.26%Co, 2.3%O). The loss of the prill could indicate that the interface between metallic silver and the surrounding phases was weak
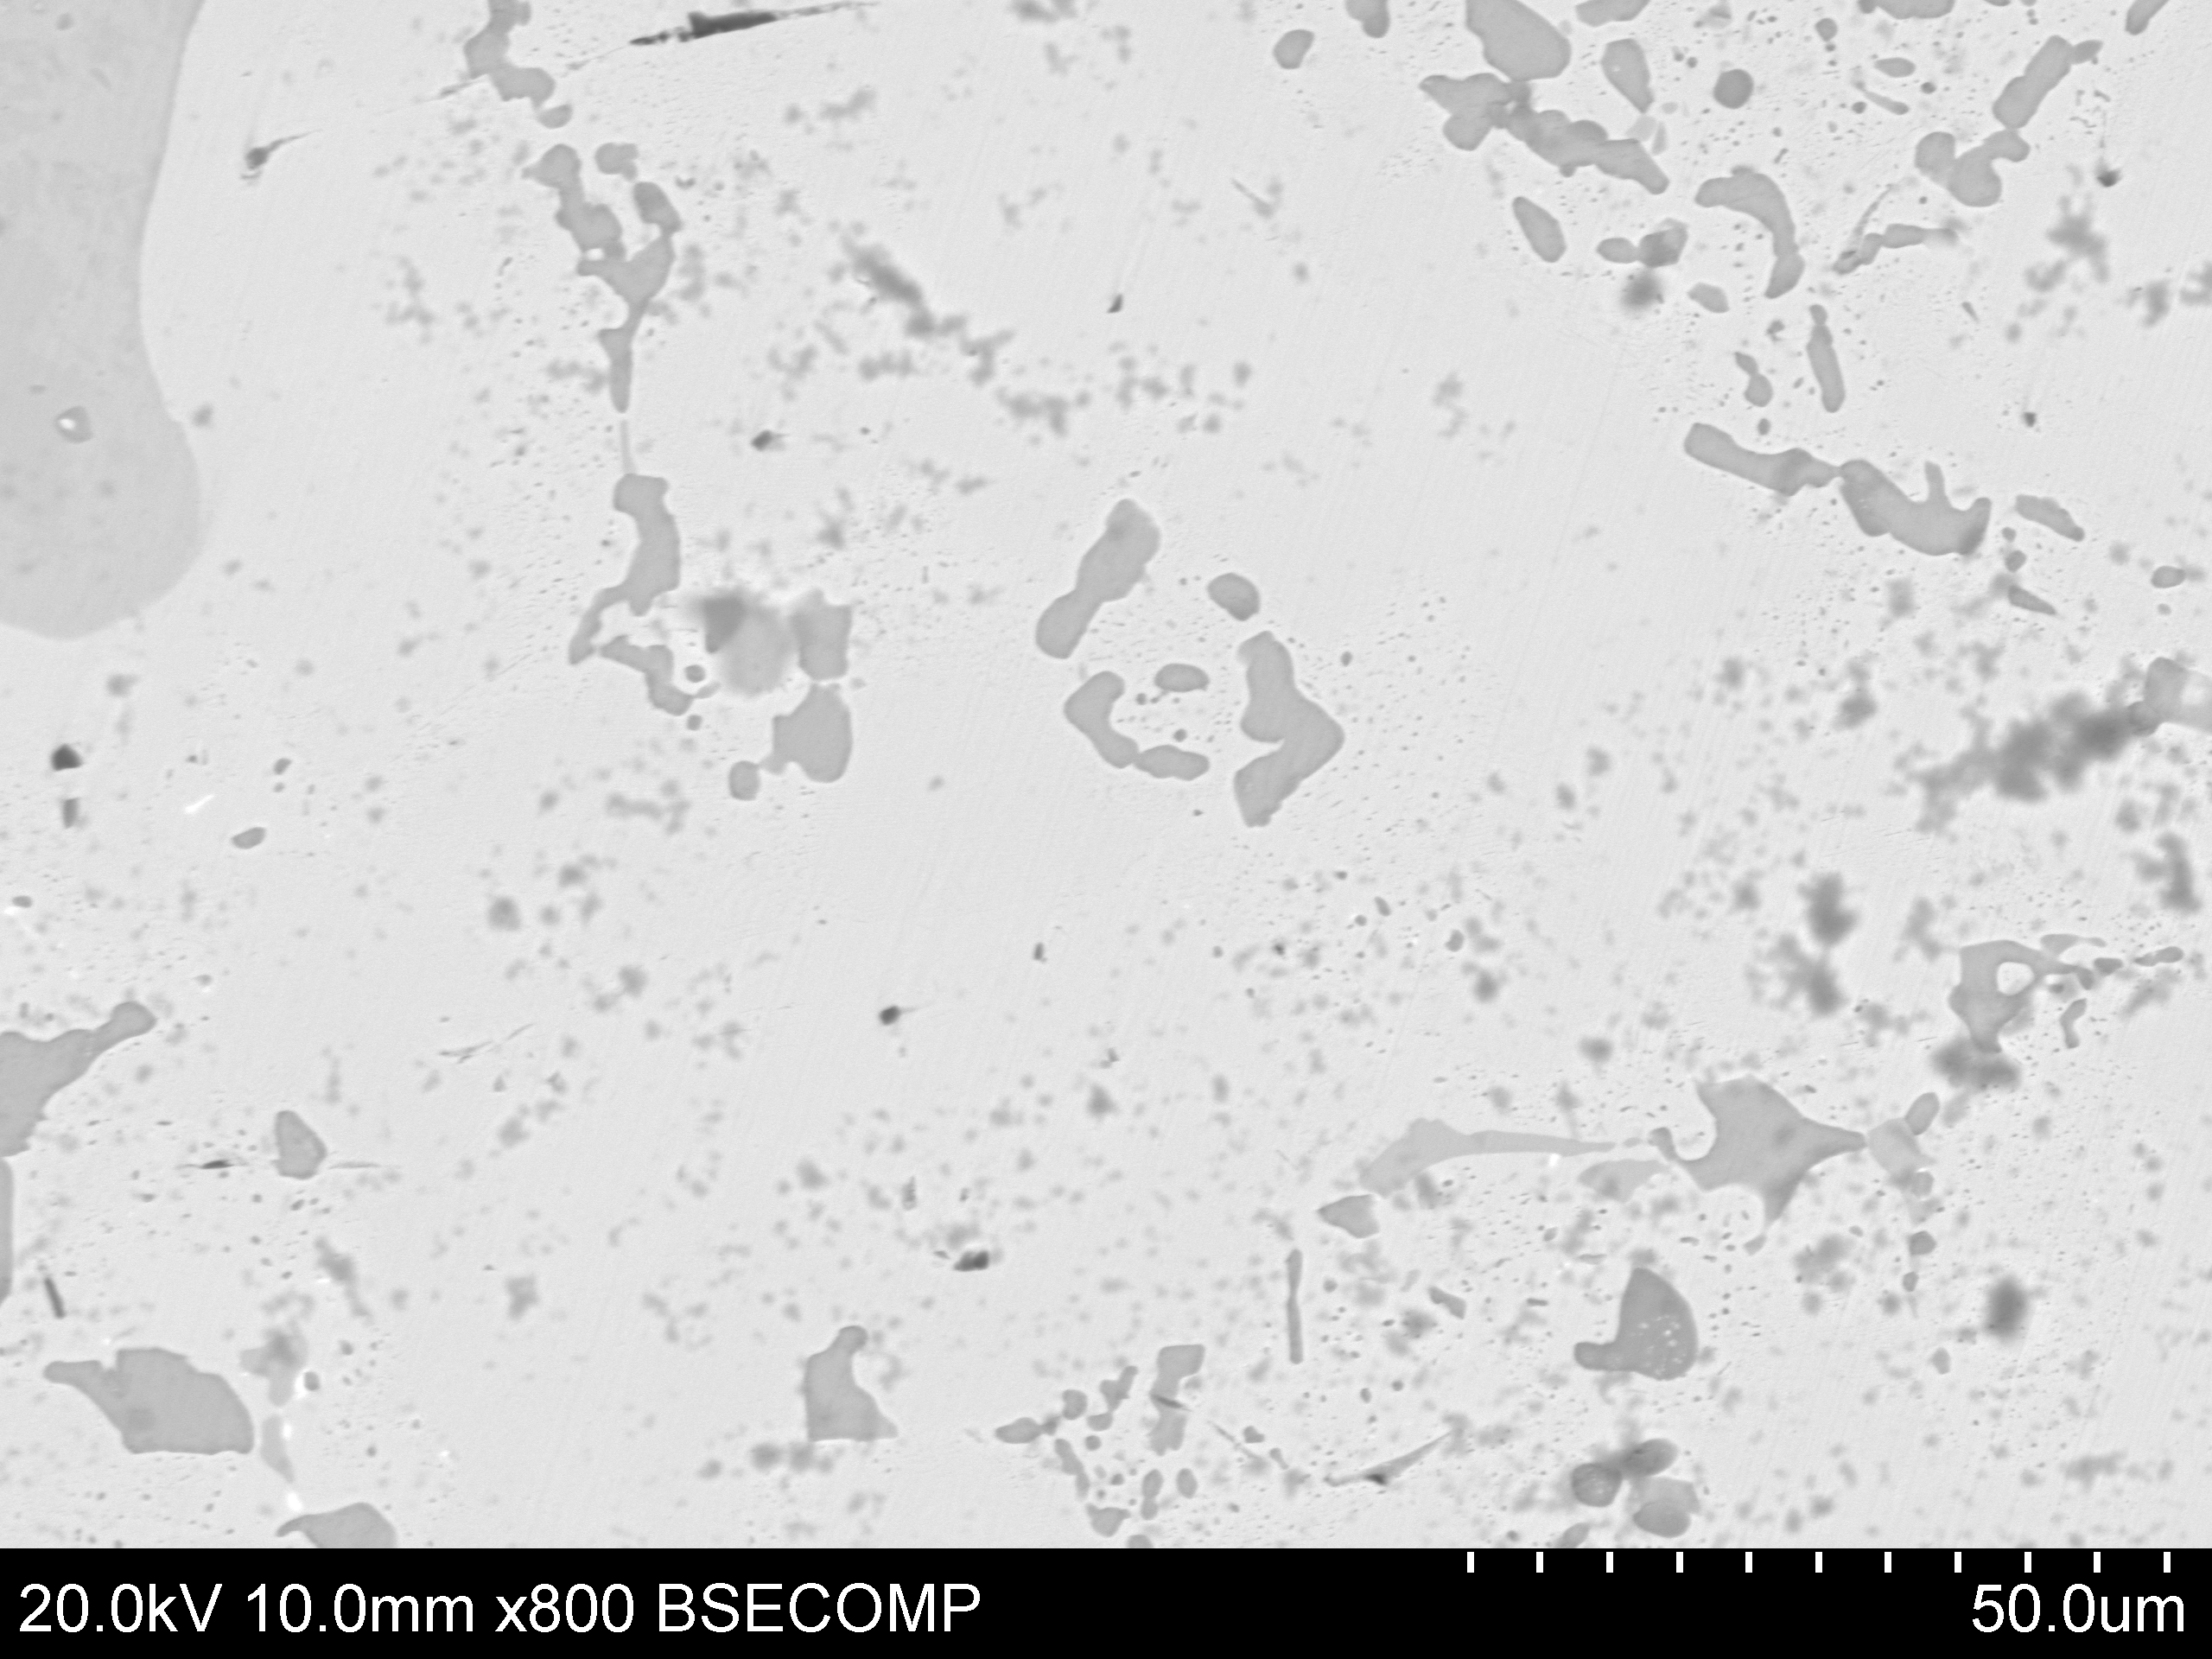
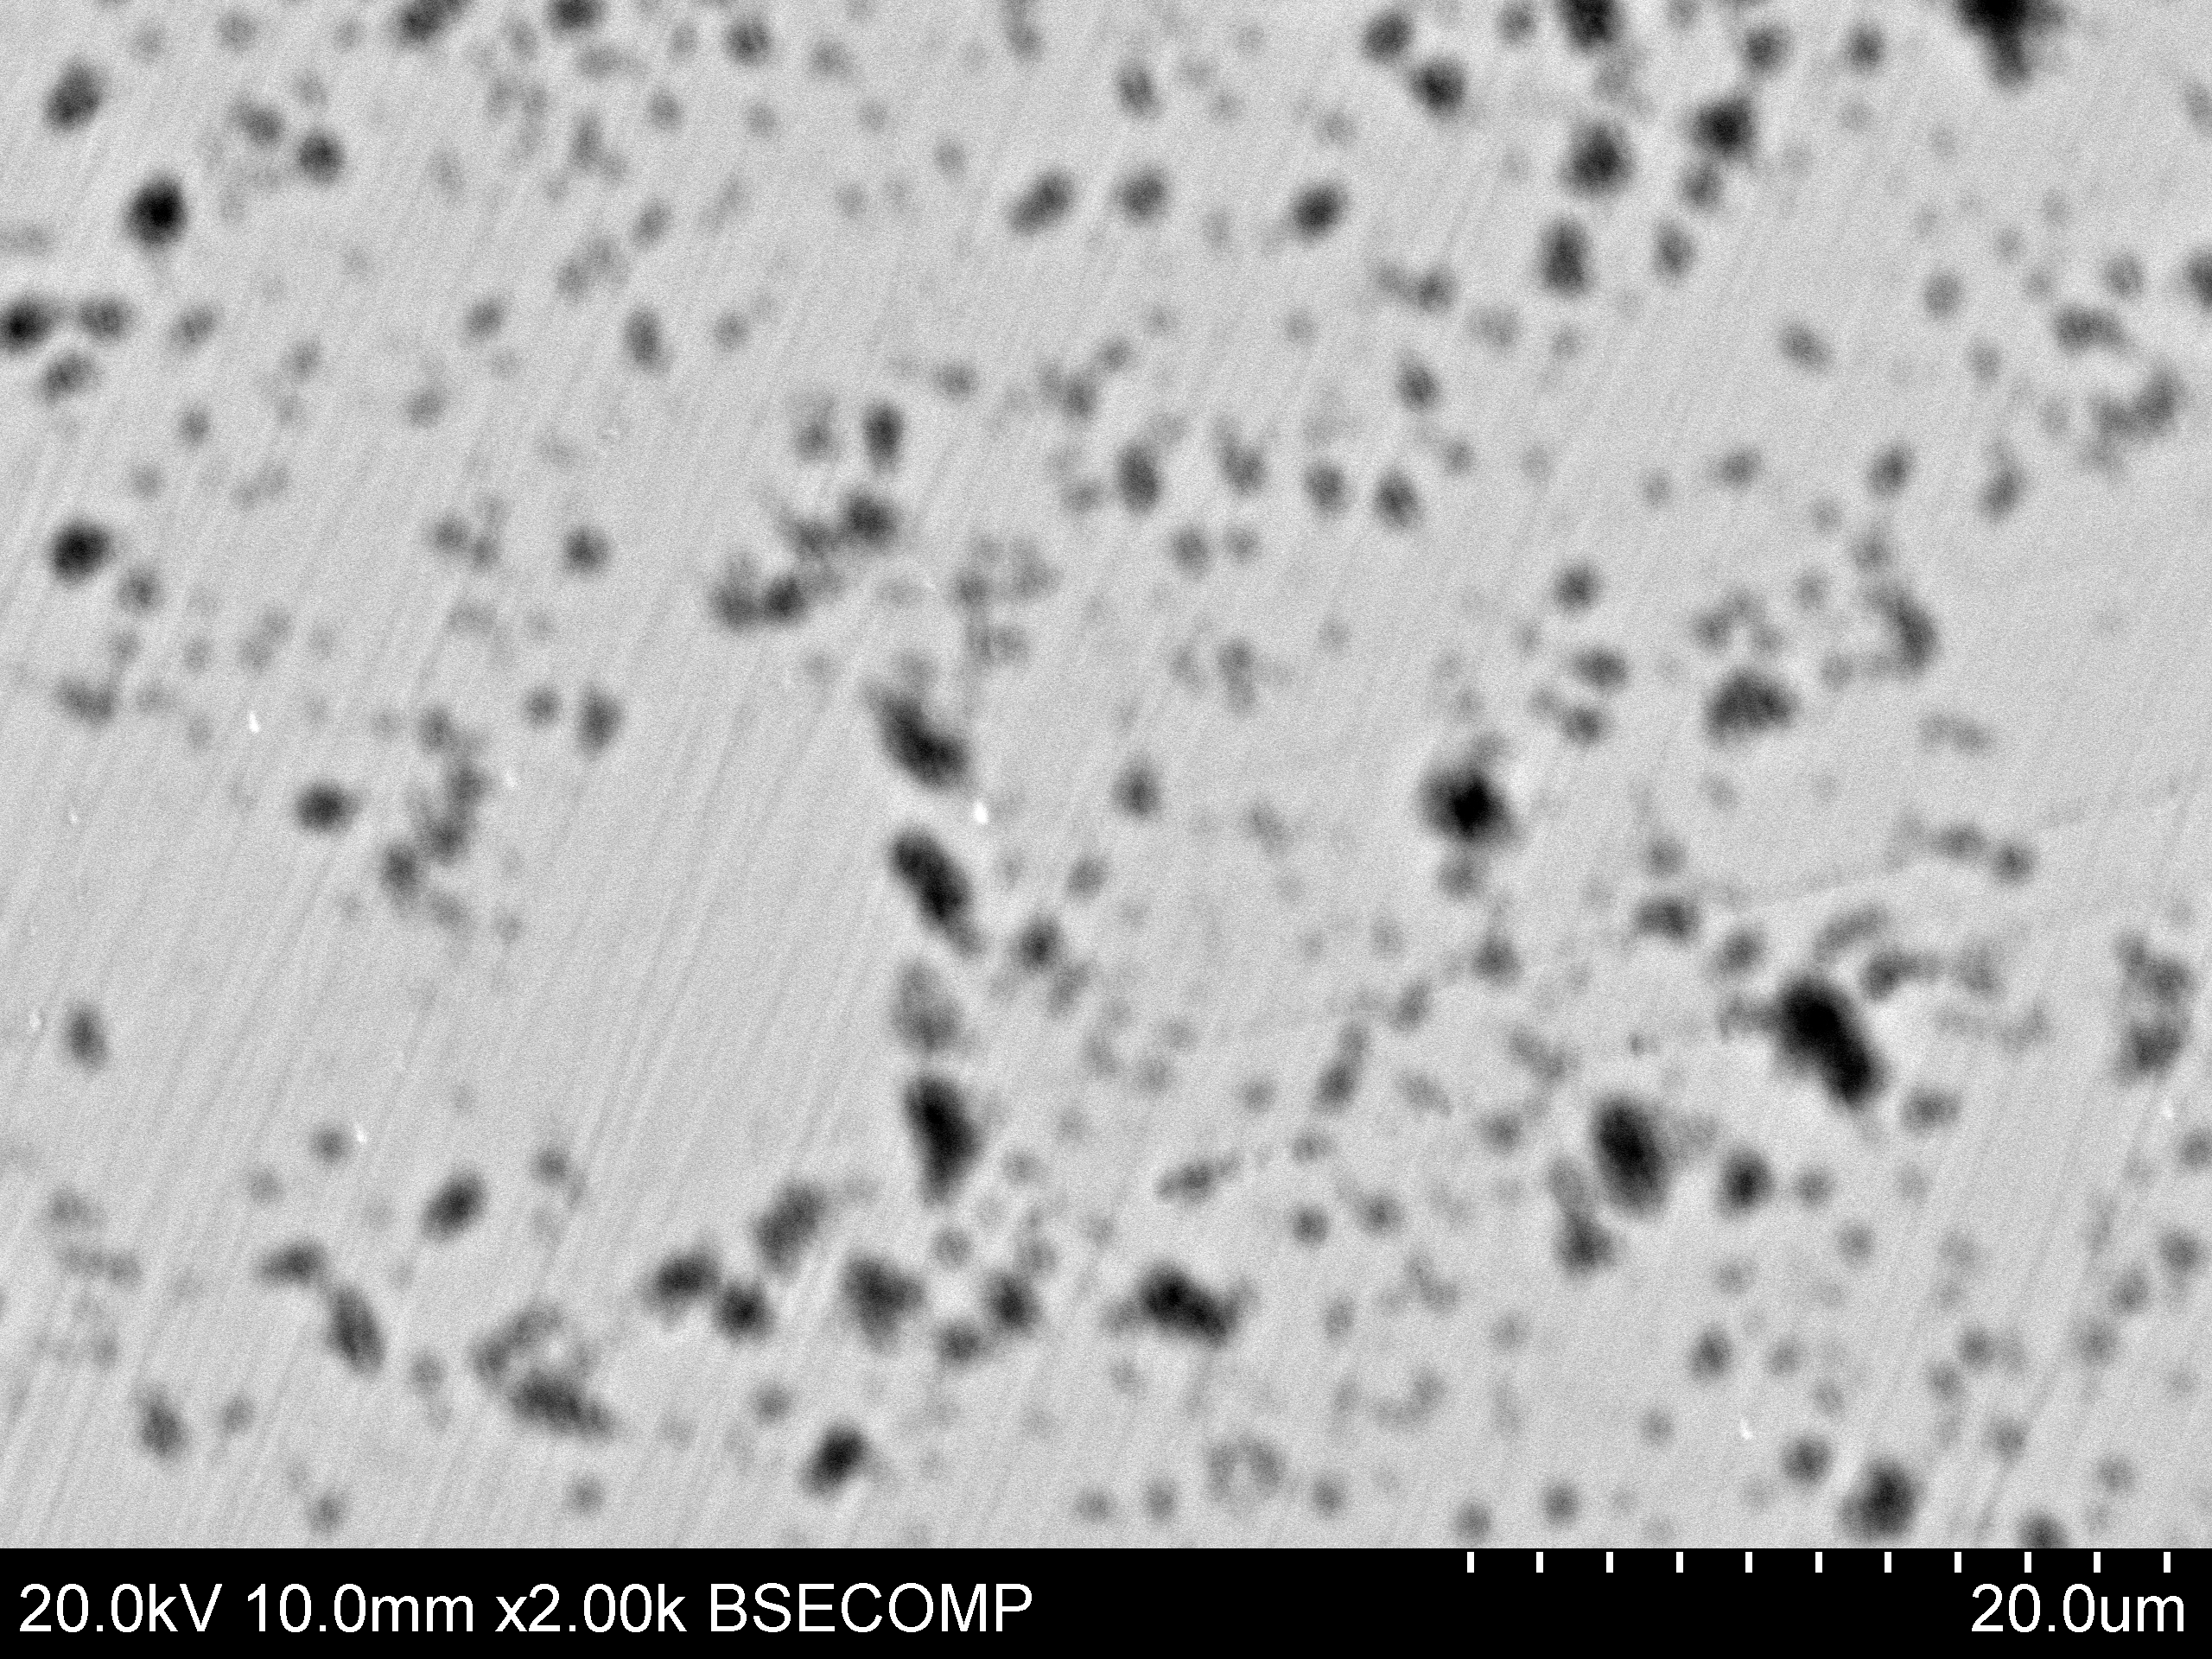
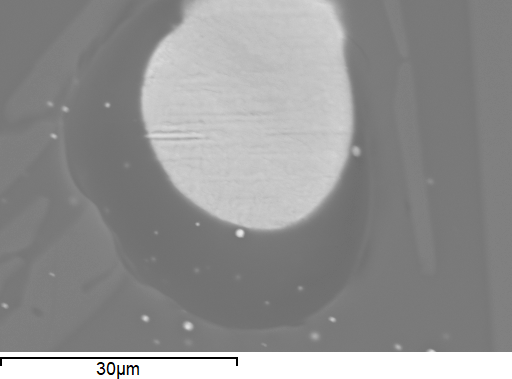
Figure 36: Cobalt-blue glass part of sample (Figure 31) after re-heating to 1300°C. Silica-rich needles are present in the glass. Bright areas are Co-As phases that appear to have reacted with the silica (Figure 36a) producing a cobalt silicate phase without detectable levels of arsenic surrounding the particle (Figure 36b and Figure 36c)
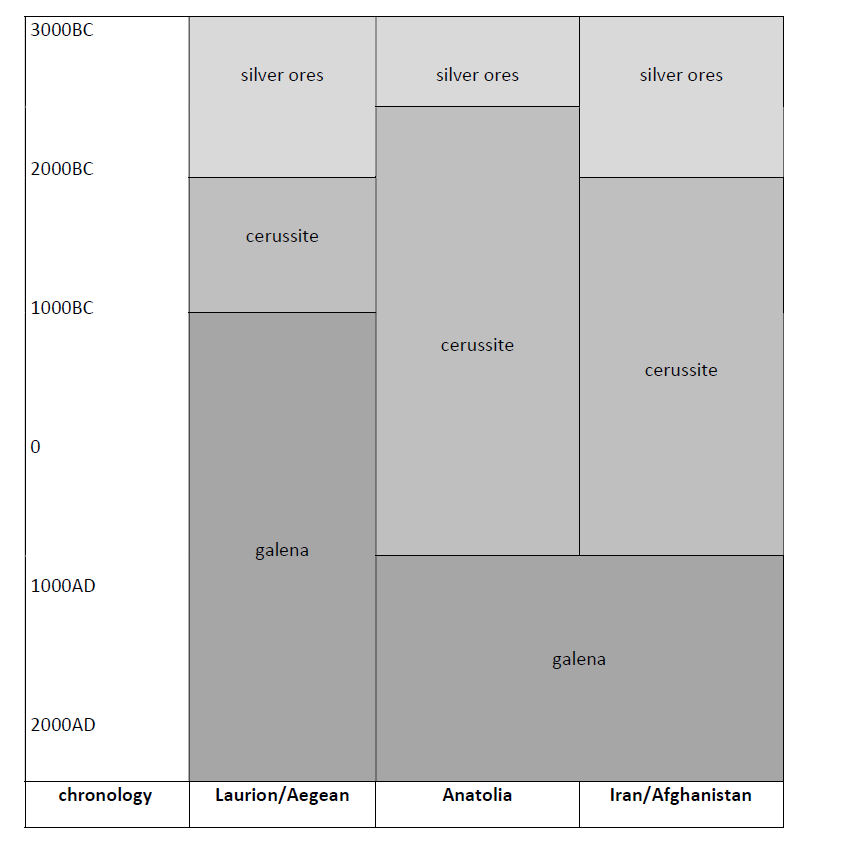
Figure 37: Visual representation of Meyers' model (2003) for the exploitation of silver ores
Internet Archaeology is an open access journal based in the Department of Archaeology, University of York. Except where otherwise noted, content from this work may be used under the terms of the Creative Commons Attribution 3.0 (CC BY) Unported licence, which permits unrestricted use, distribution, and reproduction in any medium, provided that attribution to the author(s), the title of the work, the Internet Archaeology journal and the relevant URL/DOI are given.
Terms and Conditions | Legal Statements | Privacy Policy | Cookies Policy | Citing Internet Archaeology
Internet Archaeology content is preserved for the long term with the Archaeology Data Service. Help sustain and support open access publication by donating to our Open Access Archaeology Fund.