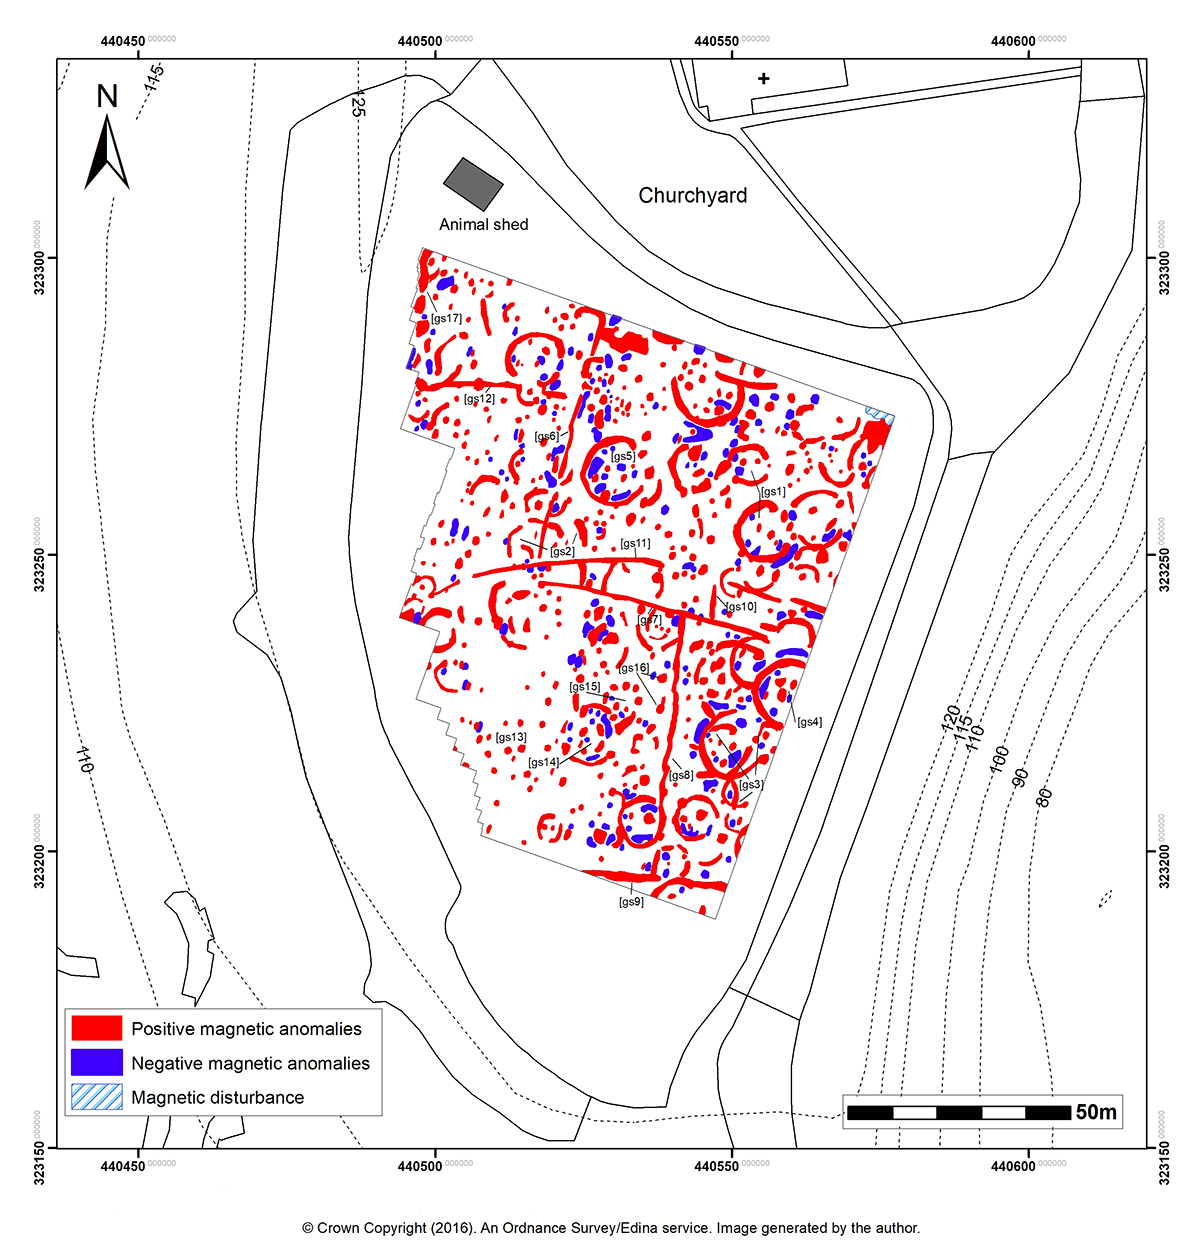
Figure 7: Graphical summary of Fluxgate gradiometer survey in the south field
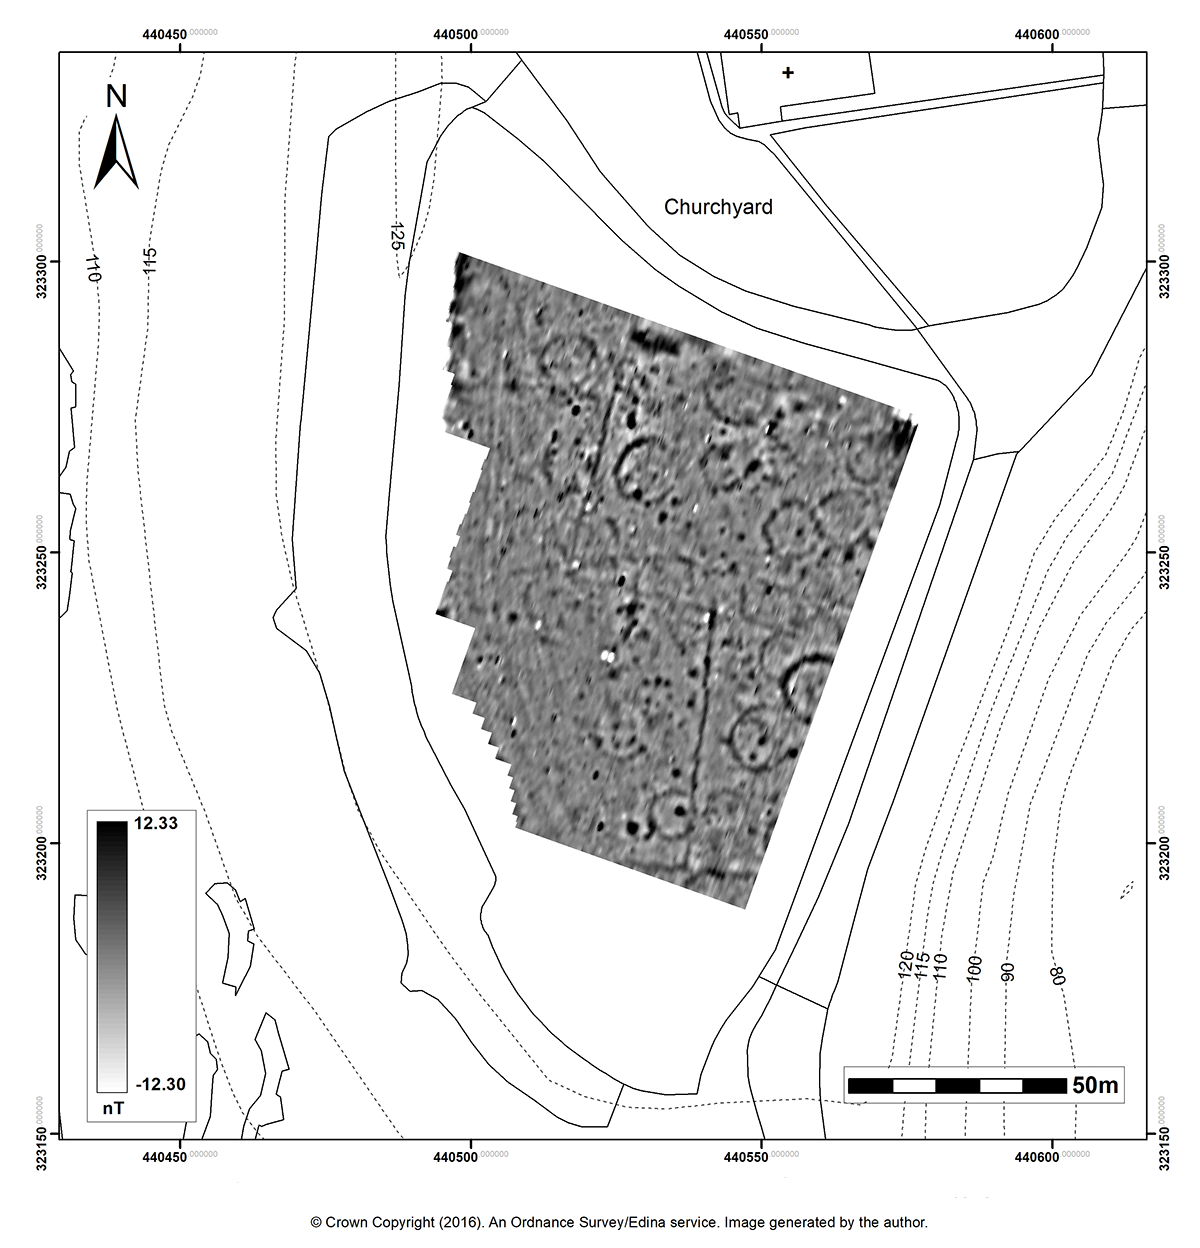
The fluxgate gradiometer survey covering 0.60ha (1.48 acres) in the south field recorded a high concentration of magnetic anomalies (Figure 6). Anomalies of note referred to are numbered in square brackets. Among the most striking features recorded are the positive penannular-shape anomalies, concentrated particularly in an area towards the east side of the survey grid. The nature of the magnetic readings indicates ditch-type features. The circuits of at least 18 ring-shaped anomalies can be identified [gs1]. This estimate does not include many of the other partial or less intensely defined features visible on the graphical summary, which may account for as many as another 14 separate penannular features [gs2] (Figure 7). The circuits of the penannular anomalies are seen to overlie each other in at least four instances [gs3]. Round or amorphous positive magnetic anomalies of different intensities are recorded within the circuits of almost all of the penannular features identified [gs4]. Similarly, the majority of areas recording negative magnetic readings are local (internally and/or externally) to the penannular features and appear to respect the form of the circuit features [gs5].
The survey also recorded a series of positive rectilinear and curvilinear anomalies all measuring >1m in width. The magnetic responses recorded are indicative of the fills of ditch-type features. An arrangement of four adjoining rectilinear features divides the area surveyed. The anomalies are aligned on a (broadly) north-south and east-west orientation to form an apparently coherent feature. The anomalies on the north-south alignment ([gs6] and [gs8]) each measure c.44m in length, while the anomalies on the east-west alignment measure c.47m [gs7] and c.24m [gs9] respectively. Linears [gs8] and [gs9] each appear to intersect observed penannular features. A curvilinear anomaly measuring c.69m at the centre of the survey grid ([gs11]) intersects the rectilinear arrangement and at least three partial penannular features. A short north-south aligned linear feature measuring c.6m [gs10] appears to join features [gs7] and [gs11]. In the north-west of the grid, a second curvilinear anomaly measuring c.23.5m in length [gs12] is recorded; this feature appears to intersect two round magnetic anomalies measuring c.0.9m and c.1.4m respectively.
The survey also records the presence of some 80 discrete round positive anomalies, measuring between c.0.8m-1.7m in width, which are distributed evenly throughout the area surveyed [gs13]. These anomalies record the fills of small cut features.
Groups of proximal anomalies sharing a consistent round form may be seen to make up circular or rectangular features. For example, four round anomalies within the interior area of one of the partial penannular features appear to correspond to form a rectangular feature measuring c.5m wide [gs14]. Similarly, five metres north-east, a series of six round anomalies form a circular feature measuring some 5.5m in diameter [gs15]. Near this feature are four separate round positive anomalies, each having a diameter measuring c.1.2m; one of the anomalies recorded a weaker response. Short, linear weakly magnetic anomalies appear to abut three of the round anomalies. The relative positions of the round anomalies align to form a large rectangular feature measuring some 15.1m x 6.1m [gs16]. Large amorphous (highly) magnetic responses are recorded in the north-west corner of the grid, in the extreme north-central area, and the extreme north-east corner [gs17].
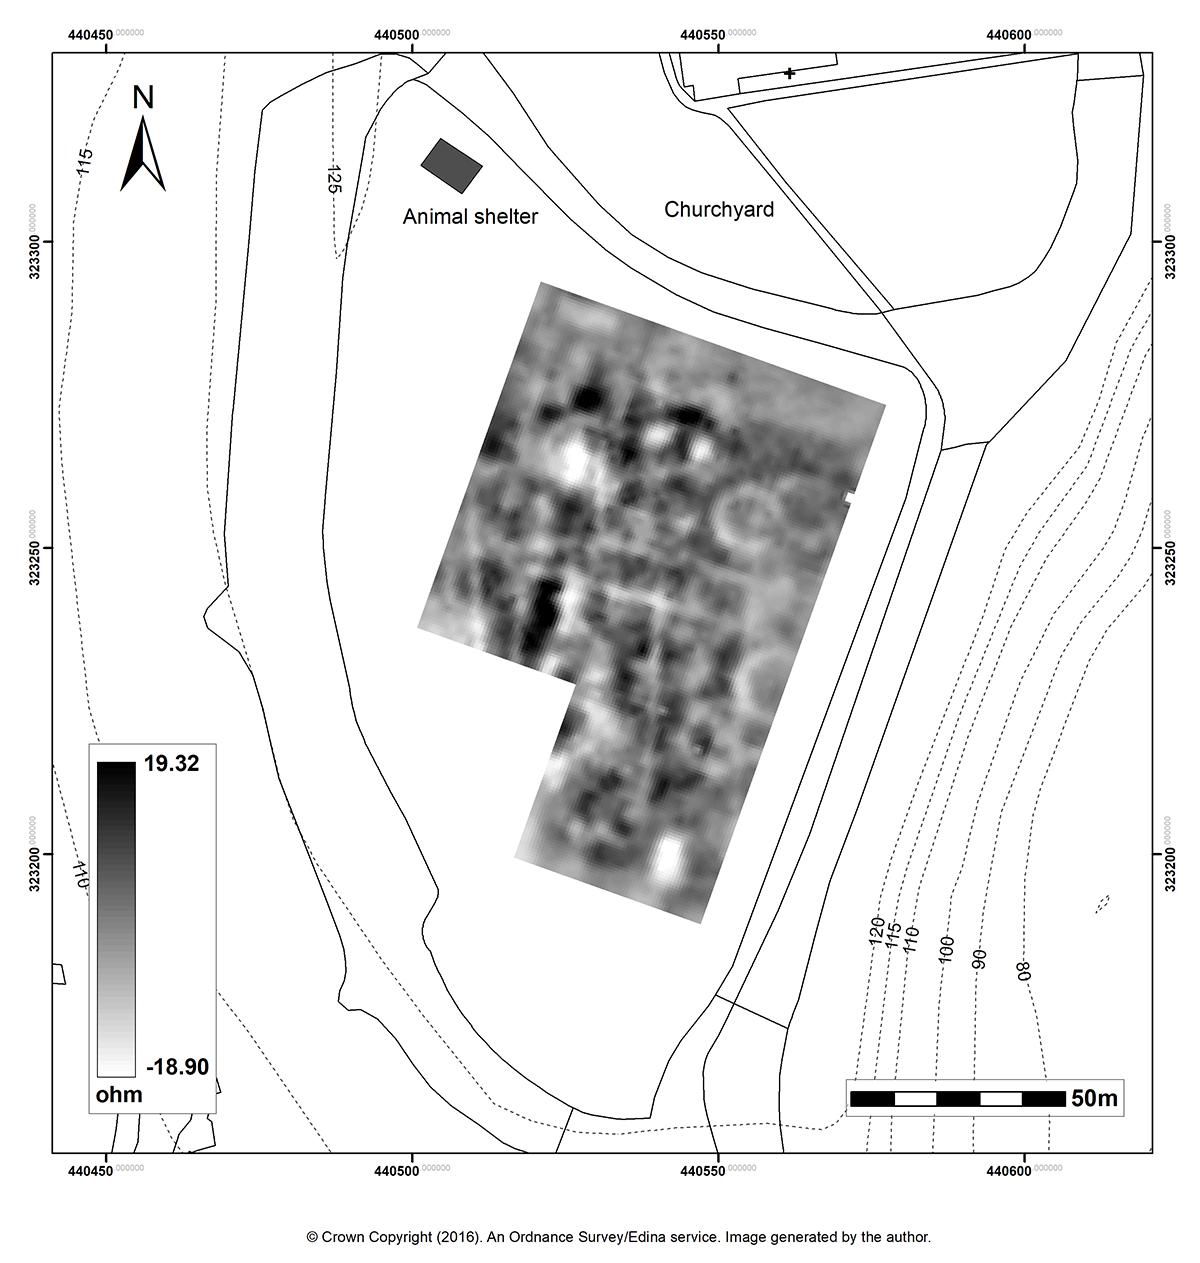
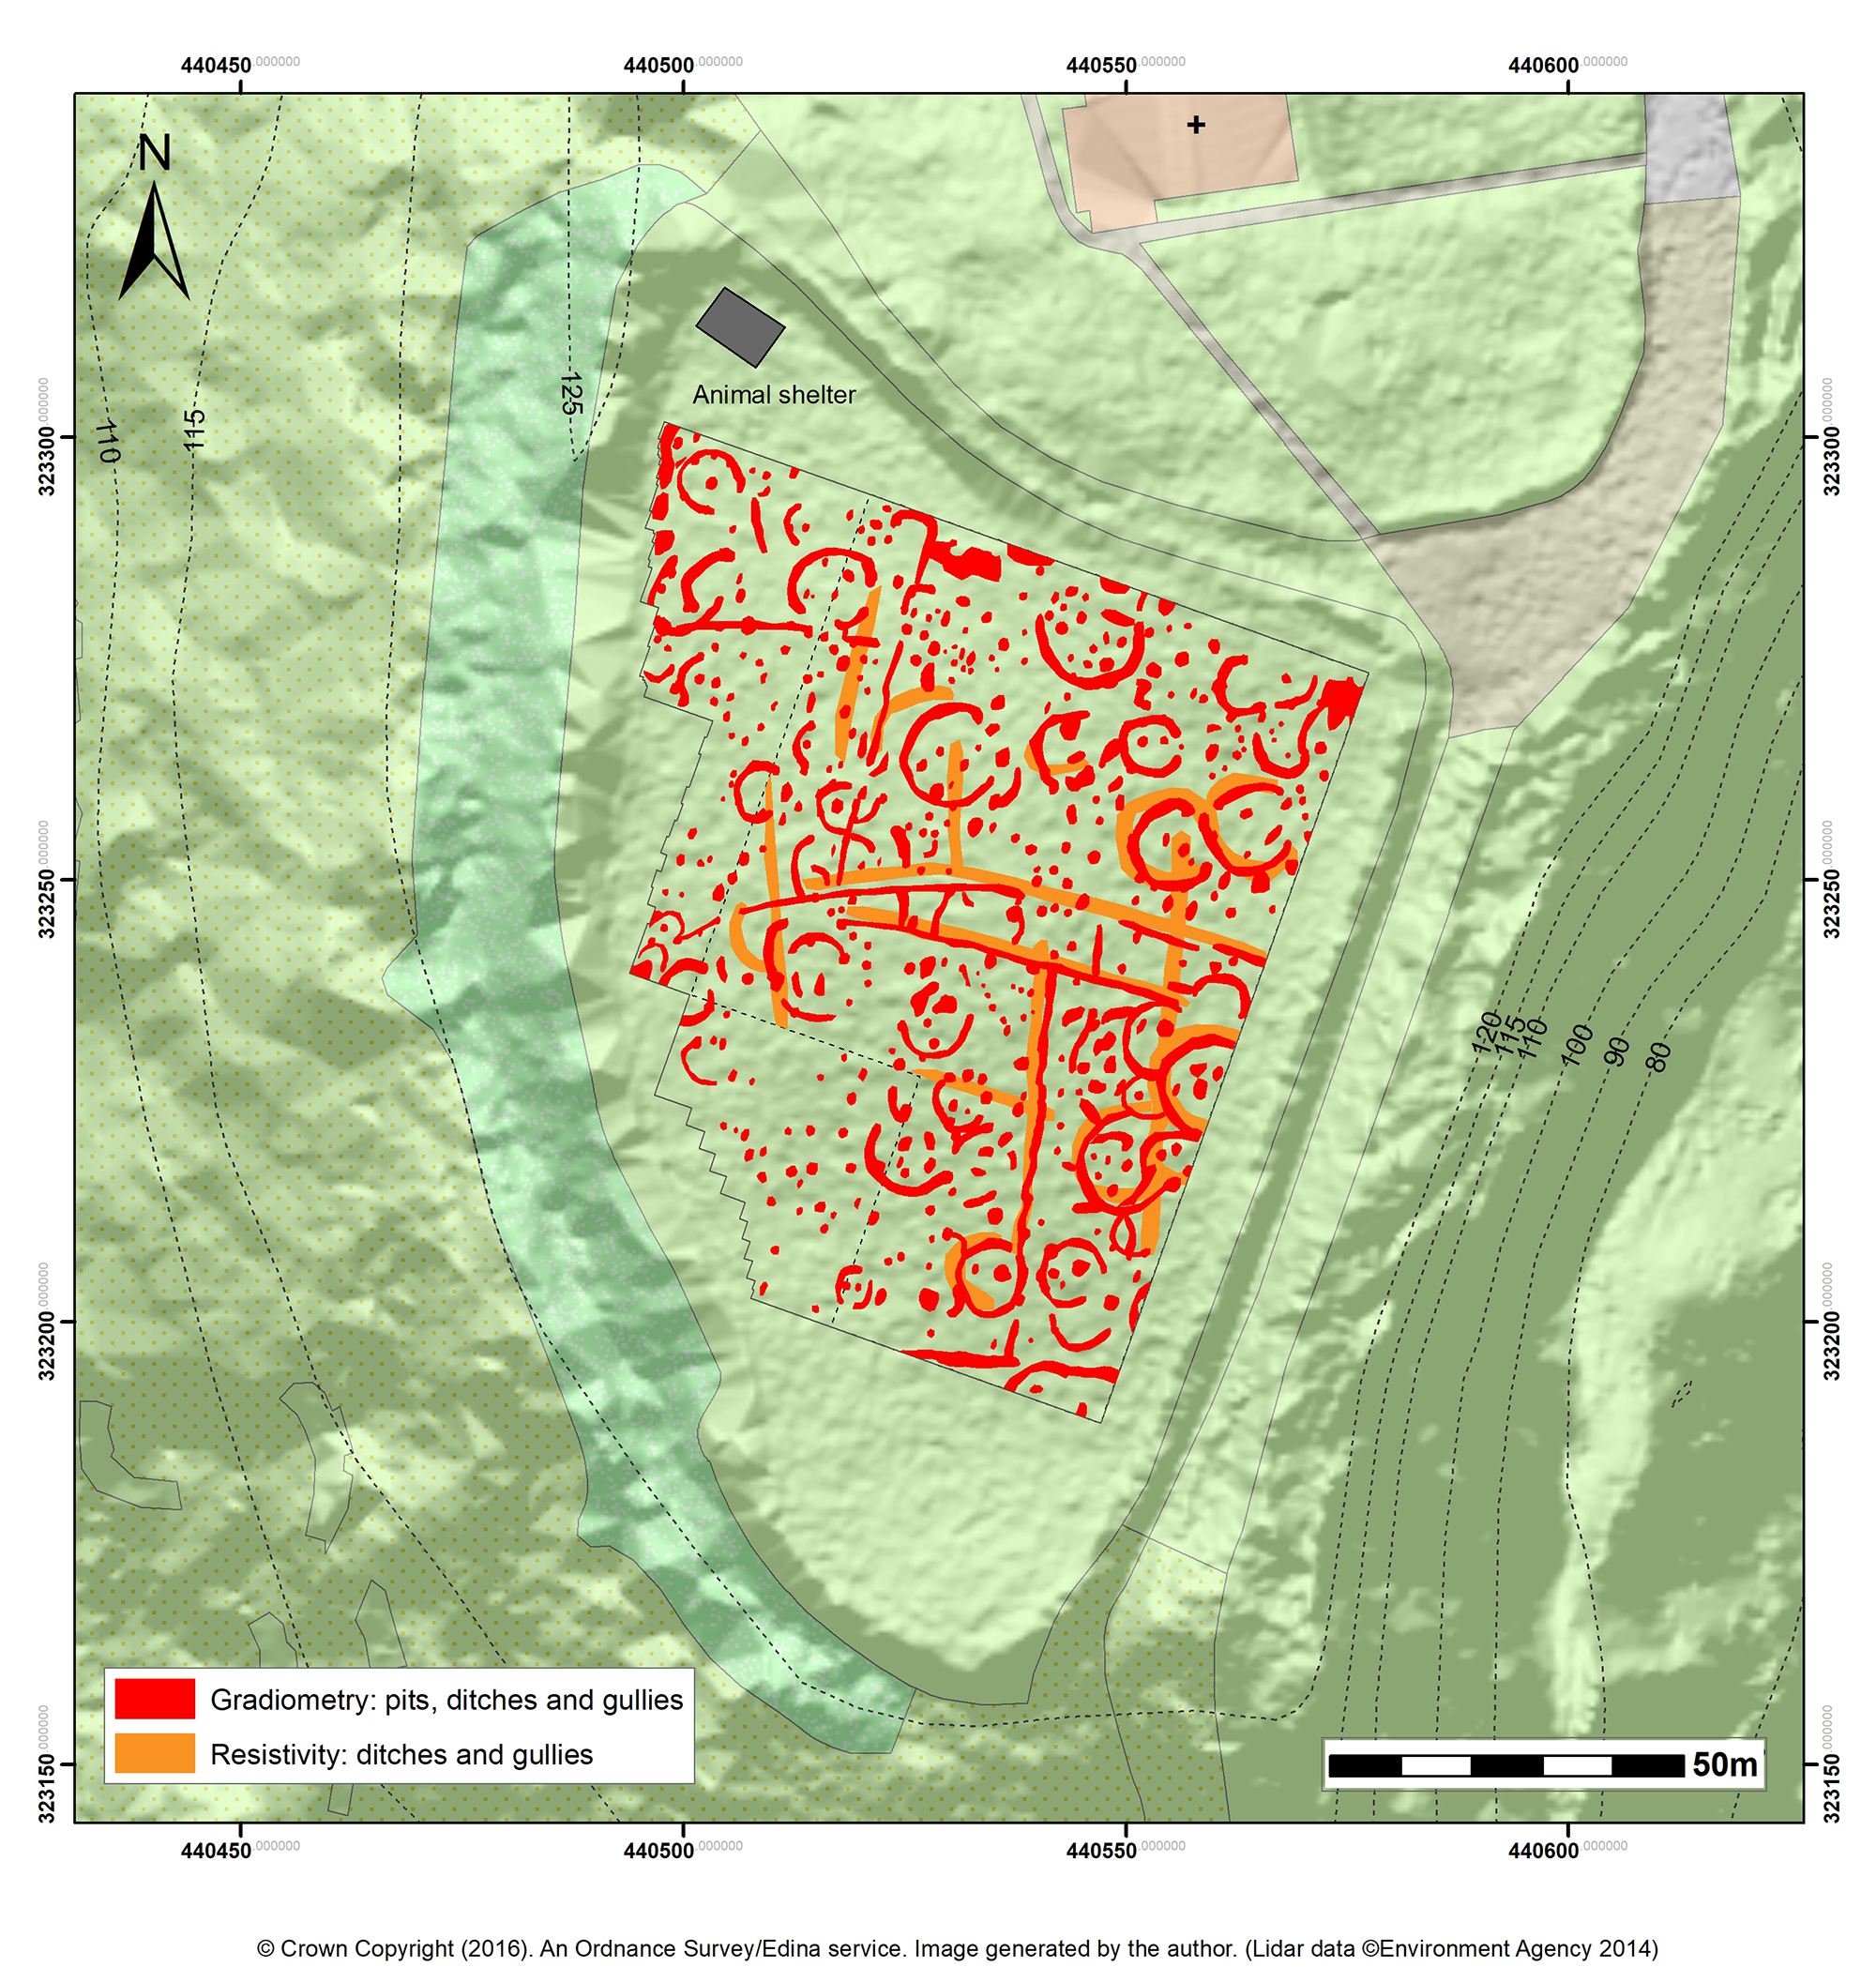
The resistivity survey (Figure 8) covering 0.46ha (1.1 acres) in the south field (Figure 8) was informed by the preliminary results of the gradiometer survey, intending to target potential archaeological features including the penannular and linear magnetic anomalies. The results are presented in a graphical summary (Figure 9).
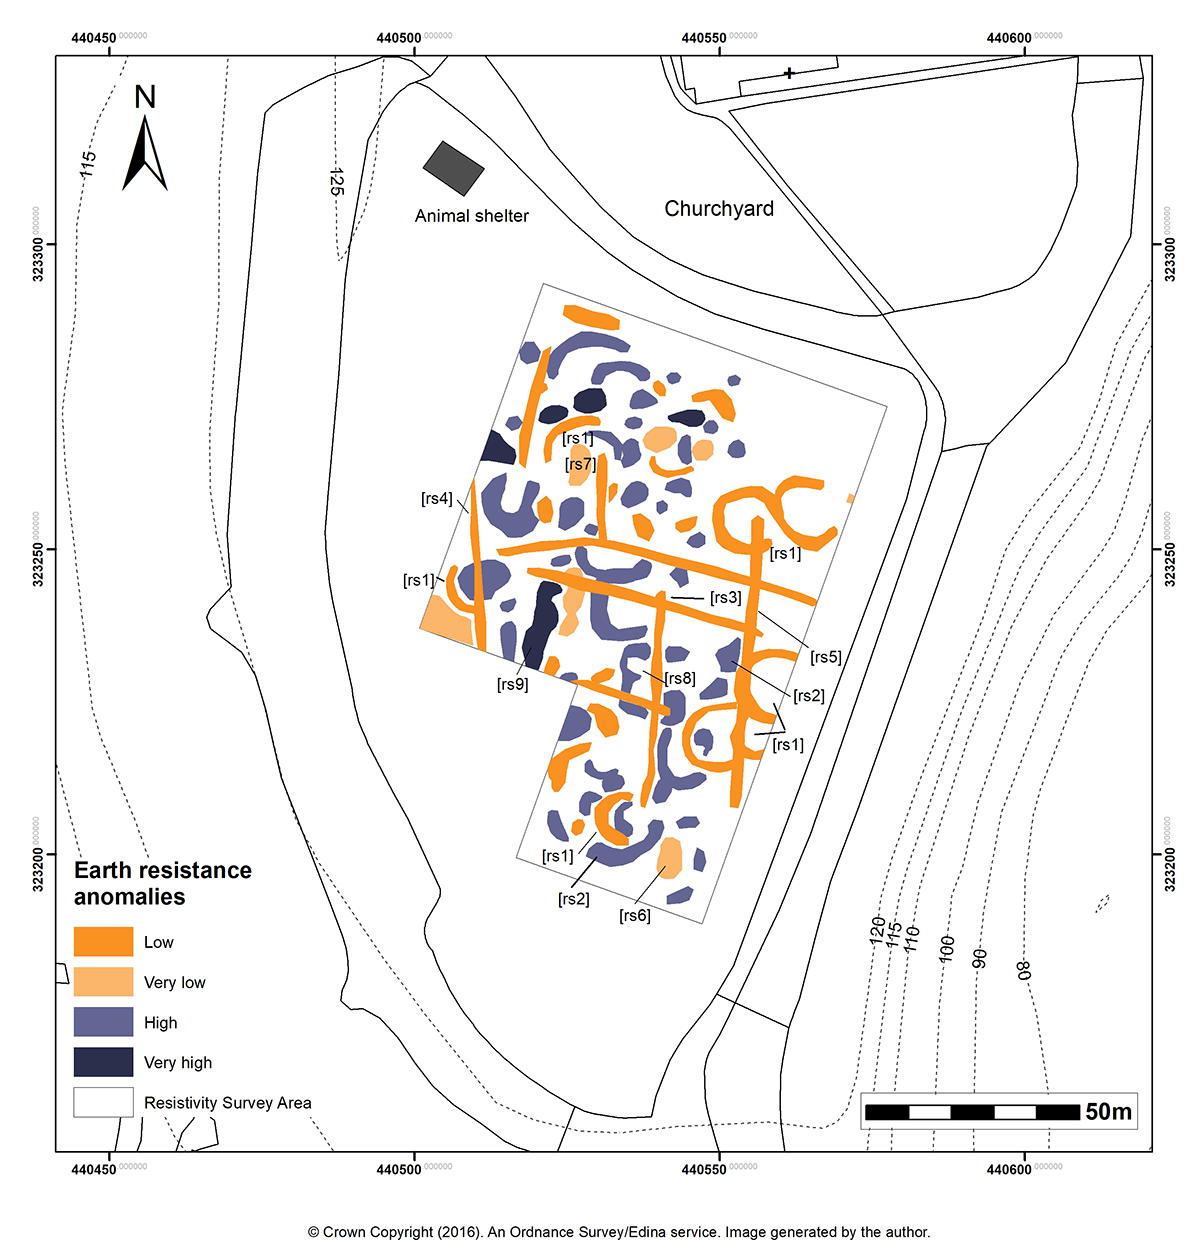
The survey records at least seven low resistance penannular anomalies [rs1], which were also revealed by gradiometer survey. Measuring between c.8.4-c.12.1m in diameter and c.1.5m-c.2.1m in width, the low resistance anomalies refer to the fills of ditch-type features.
The survey records a series of low resistance linear anomalies [rs3], measuring below c.1.3m in diameter, also recorded as positive magnetic features. Furthermore, the resistivity survey recorded four narrow rectilinear anomalies not revealed by gradiometry, three of which are orientated on a north-south alignment while the fourth is aligned east-west (measuring c.28m [rs4] and c.47m [rs5]). It is not clear whether these features conjoin or intersect one another. Linear feature [rs4] intersects a penannular feature. The areas of extremely low resistance readings [rs6-rs7] may represent areas of particularly moist soil conditions.
Several ring- or curve-shaped areas of high resistance are recorded in proximity to the outer circuits of the low resistance penannular features [rs2]. A possible rectangular-form anomaly at the centre of the survey grid [rs8] measures some 11.6m x 10.5m. Although its full extent is not clear, the very high resistance near-rectangular feature [rs9] recorded in the south-west grid records the presence of a hard surface.
While difficult to decipher, the combined geophysical surveys in the south field demonstrate a complex arrangement of subsurface archaeological features in this part of the hillfort interior, consistent with the feature types observed during past excavations.
Penannular drip gullies
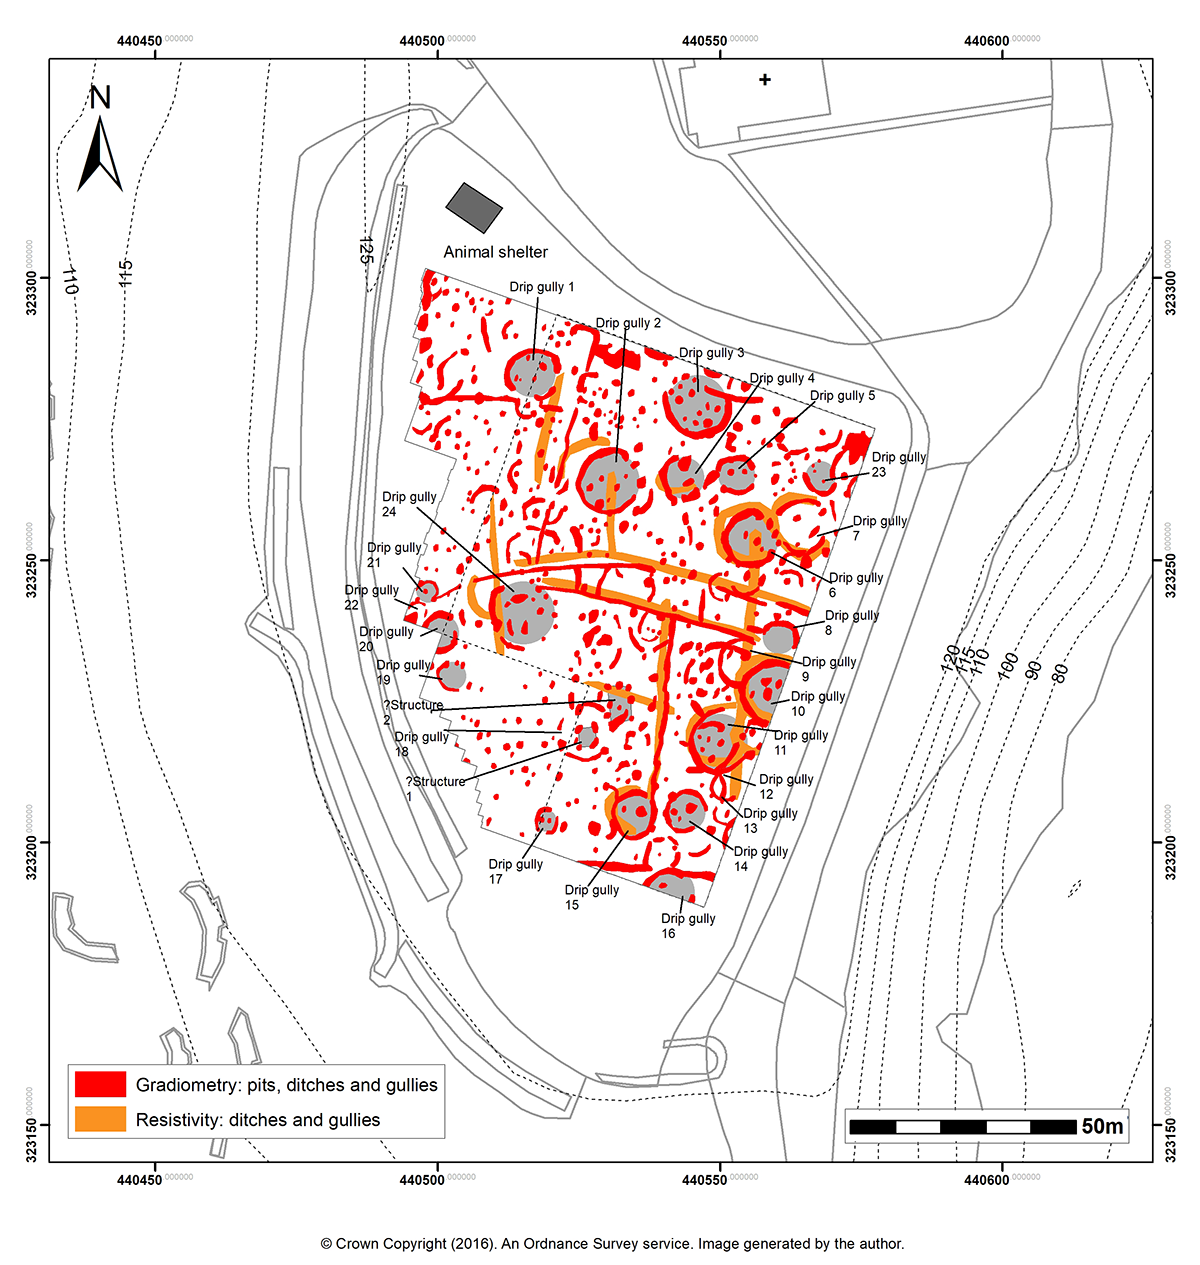
The form and geophysical response of the some of the penannular anomalies are indicative of eaves-drip gullies (Figure 10), the round ditches outside the walls and below the eaves of conical-roofed circular buildings, which comprise the dominant house form of the first millennium BC. The circuits of at least 24 drip gullies can be identified. The diameters of the gullies range between c.3.0-12.1m, enclosing estimated areas of between c.7.07-114.99m². At least 14 partial or less strongly defined penannular anomalies suggest this estimate may be greater.
| Drip gully | Estimated diameter (m) | Entrance orientation | Estimated enclosed area (m²) |
|---|---|---|---|
| 1 | 9.9 | – | 76.97 |
| 2 | 11.4 | ENE | 102.07 |
| 3 | 12.1 | – | 114.99 |
| 4 | 7.8 | ENE? | 47.78 |
| 5 | 6.6 | ENE | 34.21 |
| 6 | 9.9 | ENE? | 76.97 |
| 7 | 9.6 | ENE | 72.38 |
| 8 | 7.0 | – | 38.48 |
| 9 | 8.3 | NE? | 54.10 |
| 10 | 11.8 | – | 109.36 |
| 11 | 11.1 | ENE | 96.77 |
| 12 | 5.6 | ENE | 24.63 |
| 13 | 7.9 | – | 49.02 |
| 14 | 7.4 | E | 43.01 |
| 15 | 8.5 | ENE/E | 56.75 |
| 16 | 9.0 | ENE | 63.62 |
| 17 | 4.1 | NE? | 13.20 |
| 18 | 10.1 | E/ESE | 80.12 |
| 19 | 6.1 | ENE | 29.22 |
| 20 | 6.6 | ENE | 34.21 |
| 21 | 4.4 | – | 15.20 |
| 22 | 3.0 | – | 7.07 |
| 23 | 6.8 | – | 36.32 |
| 24 | 12.1 | – | 114.99 |
The number of overlapping circular structures (drip gullies 6-7, 9-10, 11-14), most notable in the eastern side of the area surveyed, represents a sequence of successive phases of occupation in the form of replaced buildings.
Within the drip gullies, centrally located isolated magnetic positive anomalies may represent internal pits or structural elements of the building (drip gullies 10 and 14). High resistance concentric anomalies adjoining observed circular structures may represent the wear patterns or compacted ground associated with occupation.
Where visible, the break in the drip gullies represent the roundhouse entrances, which primarily face east-north-east but range from north-east to east-south-east. In practical terms the pattern of orientation would have sheltered the building's interior, in particular its open hearth or firepit, from the dangers of the prevailing wind (Oswald et al. 2006).
A weakly defined possible curved gully (drip gully 24) measuring c.12.1m in diameter, open on its north-east side, which lies opposite an arc of three possible postholes may record some form of circular structure, possibly the 'squashed' footprint of a roundhouse or alternatively a fenced pen or windbreak.
Post-built structures
In addition to the gully-defined structures, groups of round magnetic anomalies of consistent dimensions are indicative of arrangements of structural postholes. The arrangement of four magnetic anomalies identified within the area enclosed by drip gully 18 appear to represent four postholes of a rectangular feature measuring c.3.9m long and c.3.5m wide (Structure 1). As the proposed arrangement sits slightly off-centre within the estimated gully circuit it is unlikely to belong to a central four-post 'setting' of a roundhouse similar to the example described at House I at Little Woodbury, Wiltshire (Bersu 1940; Harding 2009, fig. 7). The position of the postholes more probably suggests they belong to a separate four-post structure not contemporary with the proposed possible gully-defined roundhouse (Harding 2009, 56). Alternatively, the gully (18) may have formed a contemporaneous enclosure around the four-post structure, as seen at Elms Farm, Humberstone (Charles et al. 2000, 147).
The rectangular alignment of eight discrete magnetic anomalies of consistent dimensions may represent the postholes of a six-post timber structure measuring c.7.1m x 4.0m (Structure 2). As with many of the roundhouses, the lengthwise face of the structure is orientated east-north-east. Such a structure would have enclosed an approximate floor area of 28.4m². Small post-built structures within hillforts are typically seen as ancillary buildings, such as raised granaries, although function should not be inferred from coarse plans alone.
Pits
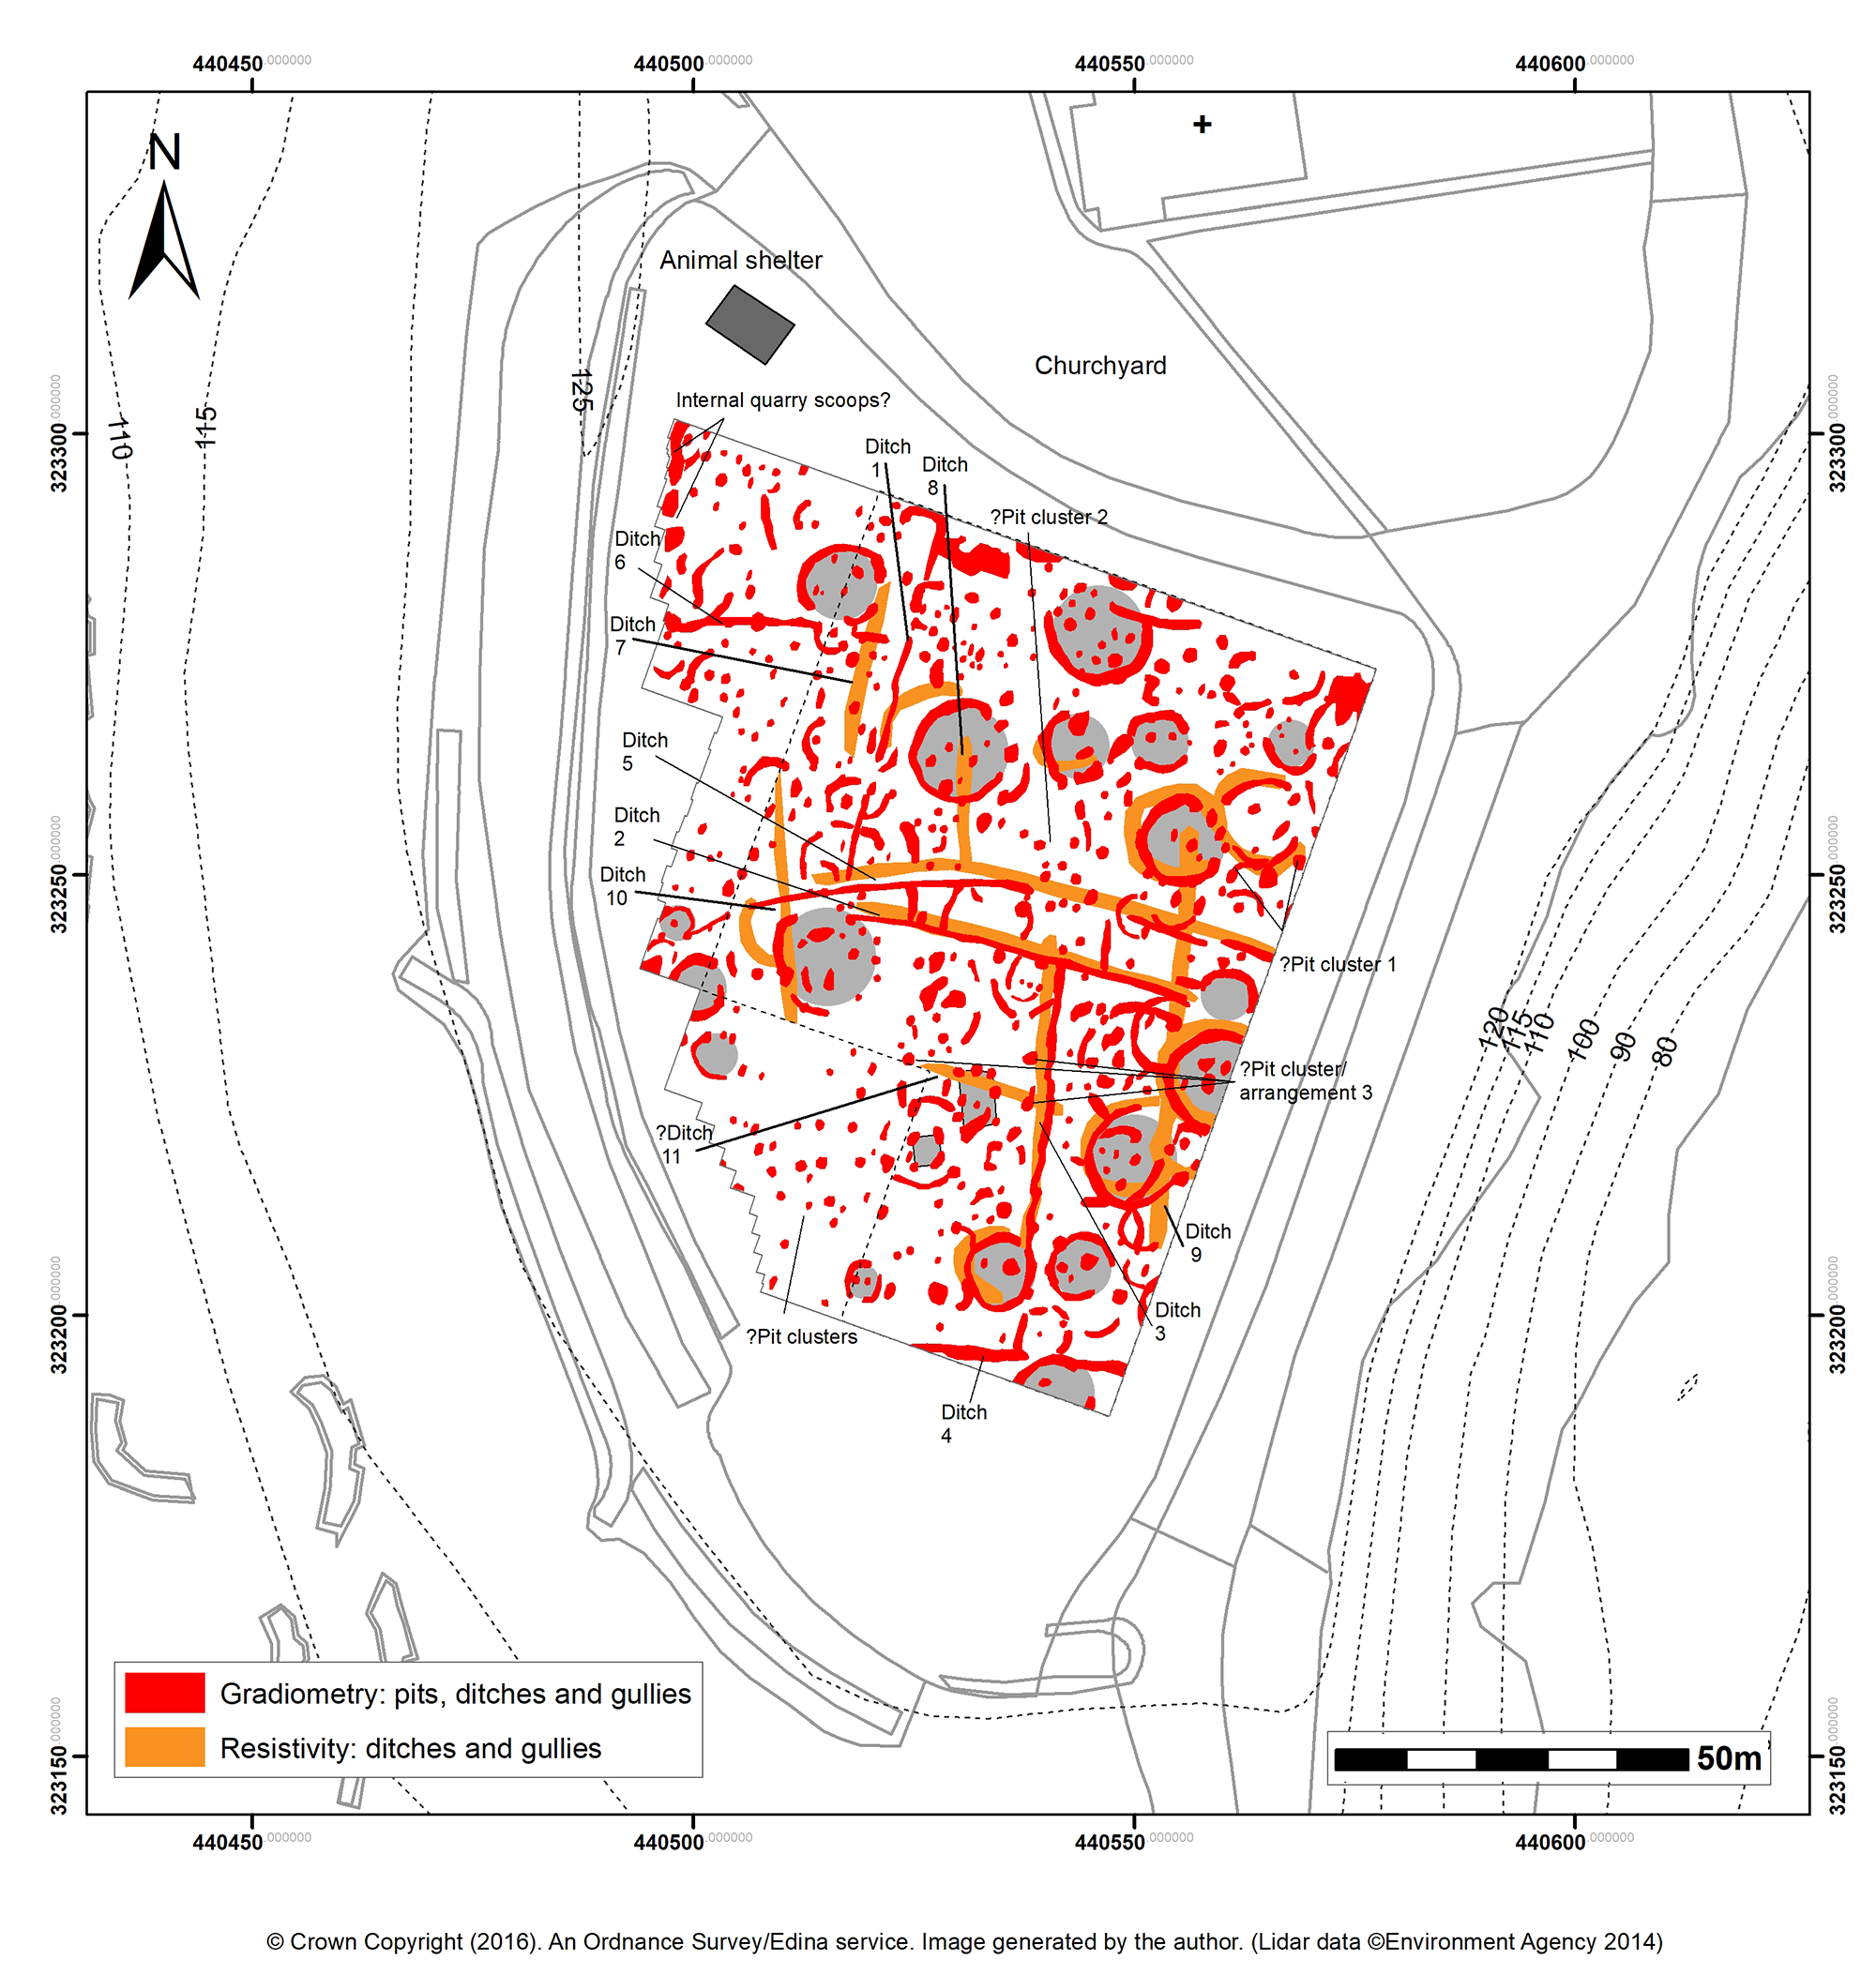
The majority of the multiple discrete positive magnetic anomalies that range in diameter between c.0.6-1.7m probably represent pit-type features. Previous excavations have uncovered numerous irregular-form rock-cut pits of a range of sizes in the eastern half of the interior, which were latterly used to deposit occupational debris as demonstrated by the assemblages of quern stones, 'Scored Ware' pottery and animal bone. The assemblage of saddle querns and 40 beehive rotary querns recovered from the site (Liddle 1982) may hint at the original function of some of the larger pits as grain stores.
The distribution of isolated anomalies throughout the survey area suggests the pits were not confined to specific areas of the interior. A greater frequency of smaller anomalies are apparent in the westerly part of the grid where circular buildings are less frequent. Of note, three consistently sized pit-type features outside of the circuit of drip gully 7 may form a cluster associated with the occupation of that building (Cluster 1). Seven irregular pit-type features in the area between drip gullies 2 and 6 may form a cluster associated with those roundhouses (Cluster 2). Three isolated anomalies of consistent c.1.2m diameters, which appear to be aligned in a rectilinear arrangement, may represent associated pits (Cluster/arrangement 3).
Rectilinear and curvilinear ditches
The positive magnetic and low earth resistance rectilinear and curvilinear anomalies represent a number of narrow infilled ditches measuring approximately 1m in width. The ditches do not correspond with any field boundary described on the earliest maps of the site dating to 1758 and 1770 (LRO DG20/Ma/46/1 and DG20/Ma/46/4).
The rectilinear ditches (Ditches 1-4 - gradiometry; Ditches 7-11 - resistivity) follow straight rather than sub-rectangular or sinuous courses; Ditches 1-4 appear to form a coherent system. Ditches 3, 4 and 9 intersect the areas enclosed by drip gullies 15, 16 and 9-12 respectively, demonstrating that the elements of the ditch system are not contemporary with the use period of some roundhouses. Similarly, Ditches 1, 2 and 5 together appear to intersect the partial drip gullies of a possible three other circular structures.
The intersection of Ditches 1 and 5 (curvilinear) suggests that the two configurations of ditch forms represent separate systems of enclosure or boundary, which presumably belong to separate occupation phases. Round magnetic anomalies along the curvilinear course of Ditch 6 suggests it may represent a fence line in the western end of the interior.
While it is not possible to put forward a date for their use, the ditches suggest that this area of the hillfort was subdivided into a series of internal enclosures over two distinct phases at a period in the site's history. Ditched and fenced enclosures may have been used to divide areas by function, to control livestock and to aid drainage.
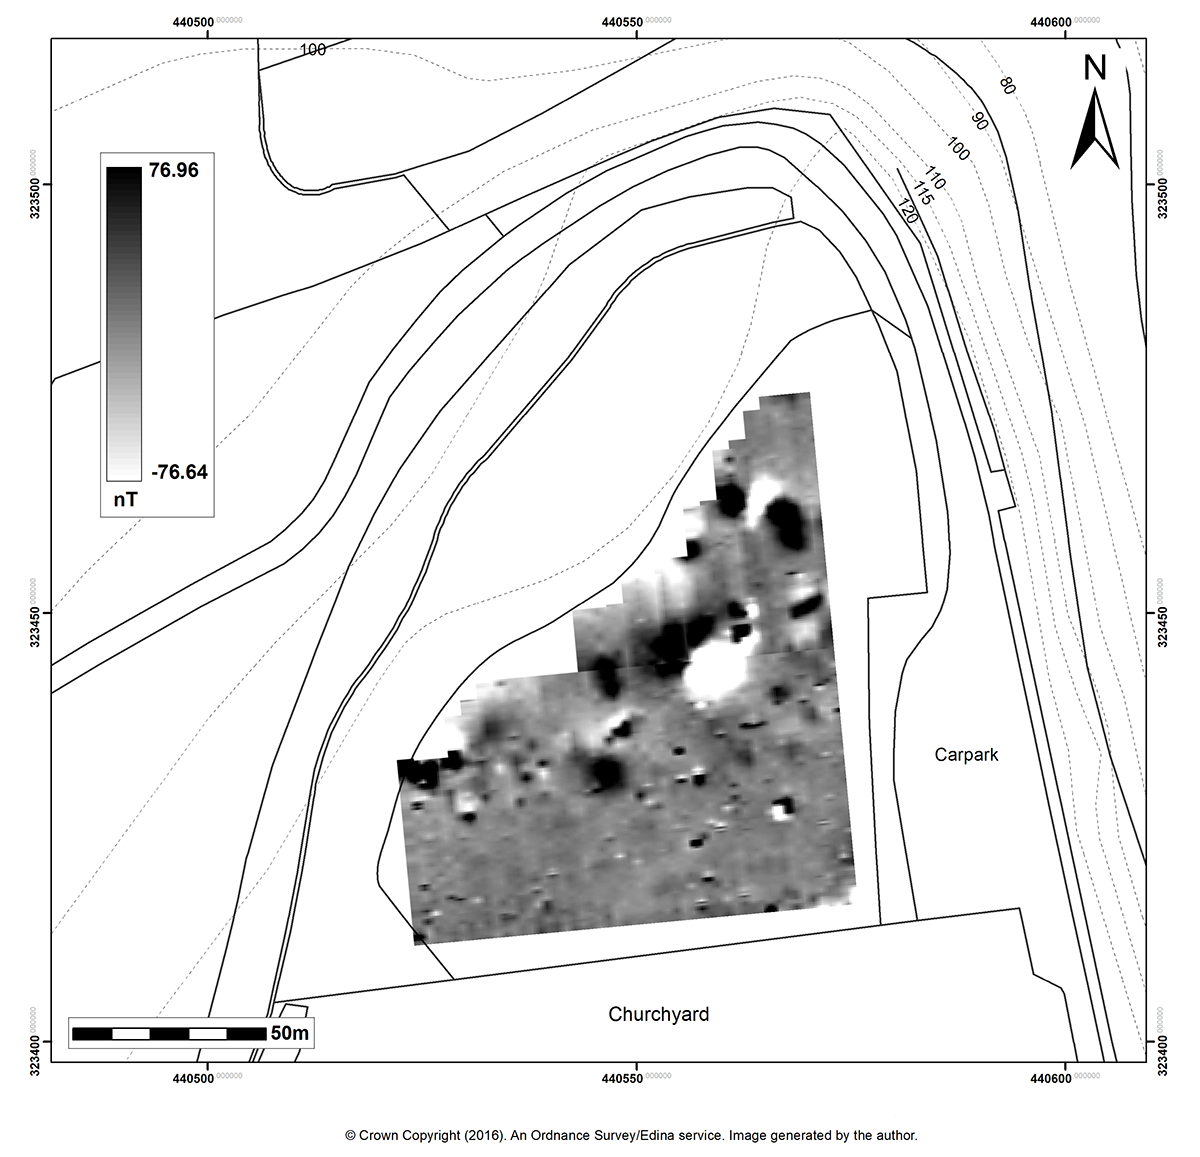
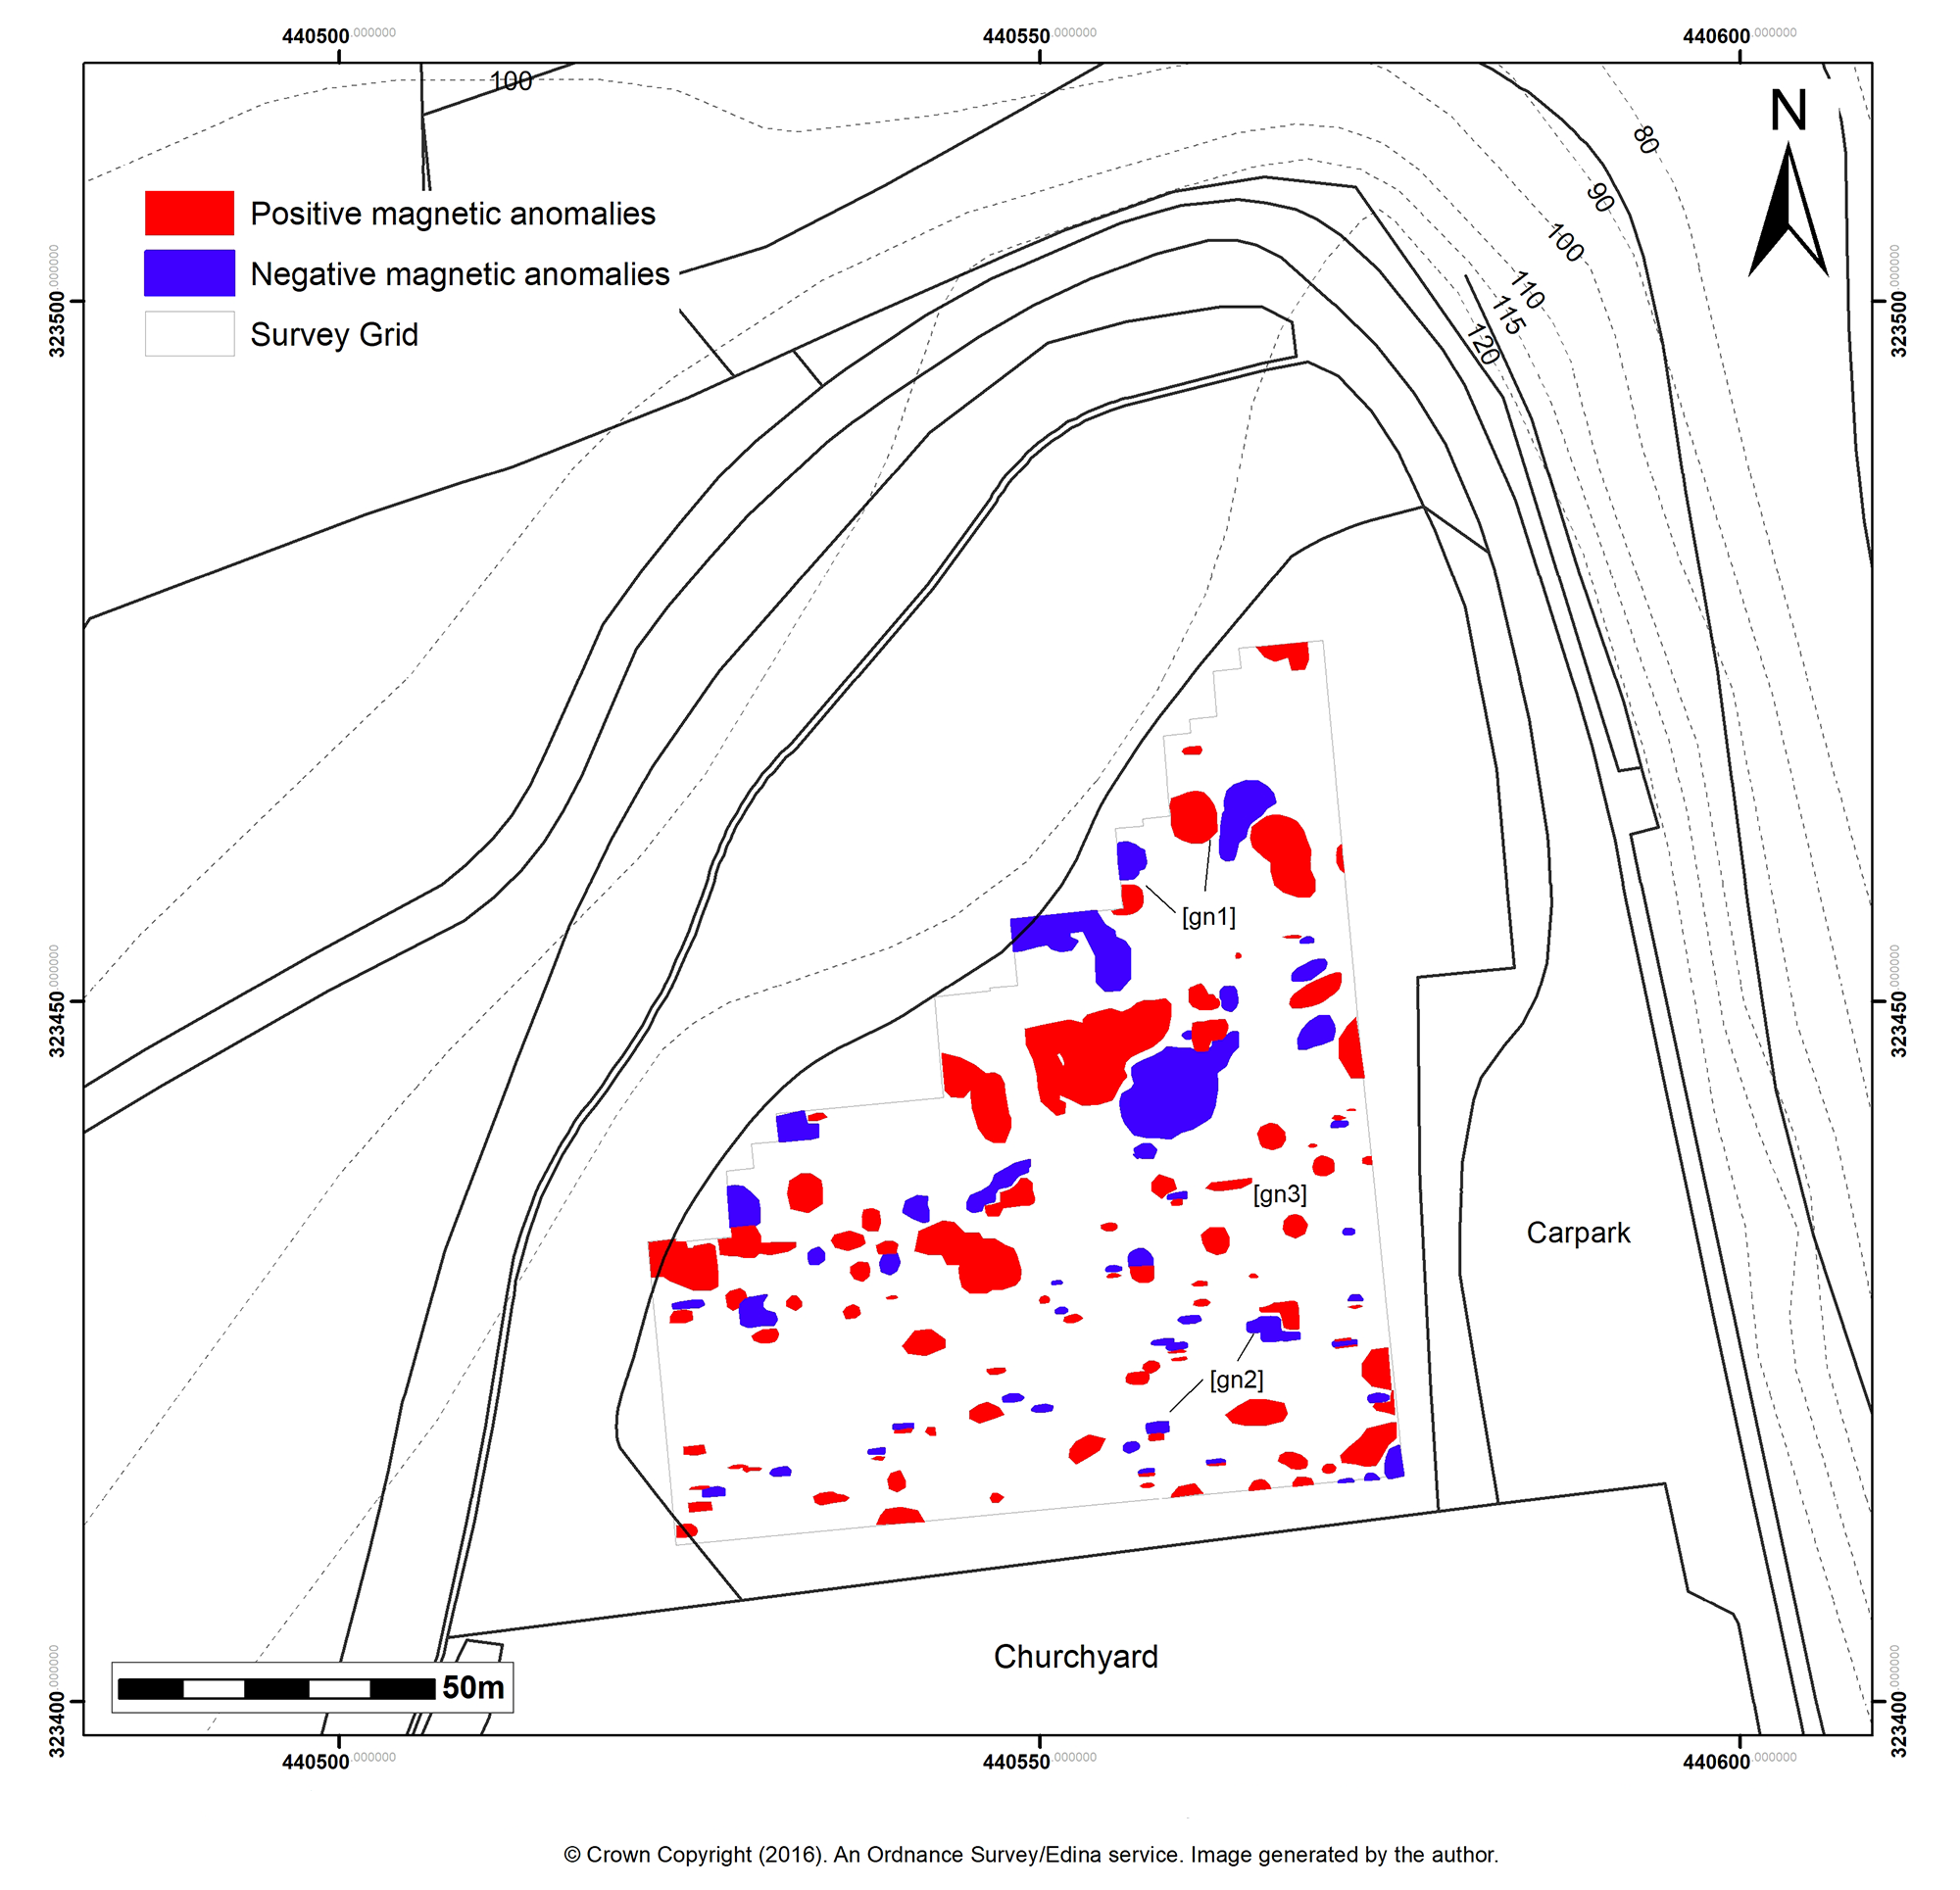
The fluxgate gradiometer survey covering an area of 0.2ha (0.49 acres) in the north field recorded a range of dipolar magnetic anomalies (Figure 13), displayed in the graphical summary of the processed survey data (Figure 14). In the northern half of the survey grid, some 13 round and amorphous-form positive magnetic anomalies measuring c.2m-c.7m are recorded, which are proximal to corresponding negative magnetic anomalies [gn1]. Similarly, in the south end of the survey grid some 15 positive features measuring <1m are proximal to corresponding negative anomalies [gn2]. Four round positive anomalies of consistent form measuring c.1m in width are also recorded [gn3].
The distinctive dipolar magnetic anomalies that characterise the rather unclear survey results from the north field likely represent the presence of near-surface ferrous and/or fired materials throughout the survey area. The positive round magnetic anomalies in the north of the survey area [gn1] may represent a circular feature. This is difficult to argue with any certainty as the form and scale of the positive anomalies differ, while the extent of the possible feature cannot be fully appreciated from this survey. The more consistent but less intensely defined positive anomalies [gn3] may represent cut features such as pits, although it is difficult to know for certain if they are archaeological. The strong dipolar readings may have obscured the visibility of possible archaeological features, making it difficult to identify individual below-surface features, if present.
The presence of near-surface ferrous or fired materials likely represents recent activity at the site. Today the ground surface of the open grassed field is relatively flat, dropping towards the north-west corner consistent with the hilltop's topography. Detailed examination of historic air photographs has offered one explanation. An oblique air photograph taken in 1949 demonstrates the uneven surface of the field, with a distinct dip in the centre of the field. The photograph also shows that trees and shrubs were growing in the field, which is corroborated by the vertical aerial photograph taken ahead of Kenyon's excavation (Kenyon 1950, plate 1). Such tree and shrub clearance, surface levelling and modern visitor activity may have contributed to the dipolar magnetic anomalies.
The 'hillshade' visualisation reveals approximately 350m of the west side of the univallate enclosure – today obscured by dense shrub cover – which survives in various states of preservation. The model put forward by Wacher (1976-7, 3-5) to describe the east and north-east sectors of the rampart describes a bank with a berm before a ditch and a counterscarp bank, constructed in a single-phase. The western ramparts have been investigated only by hachure plan (Ordnance Survey 1882 first edition map), save for Kenyon's partial section into the north bank of the west in-turned entrance (Kenyon 1950, 19-20).
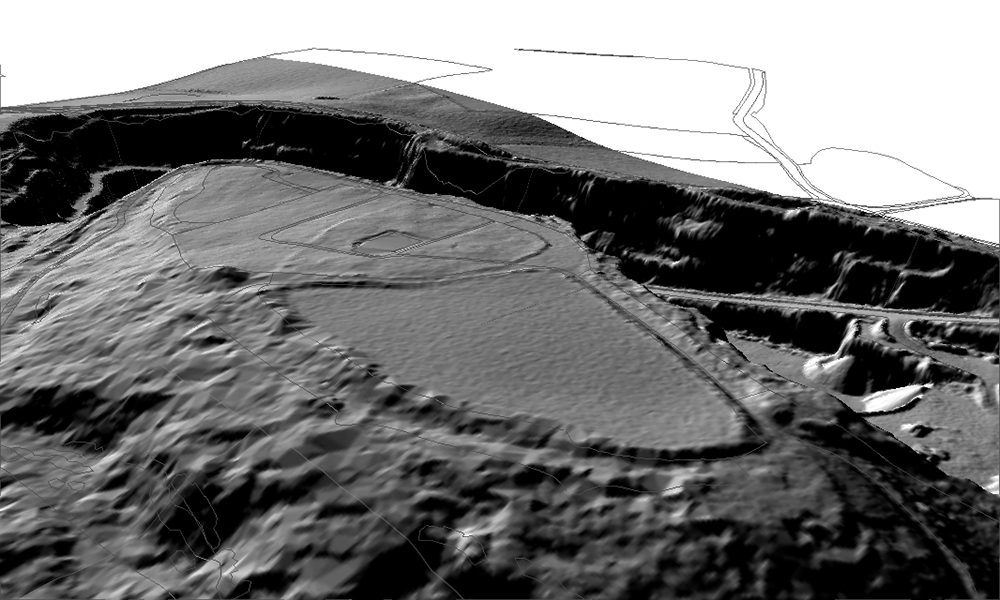
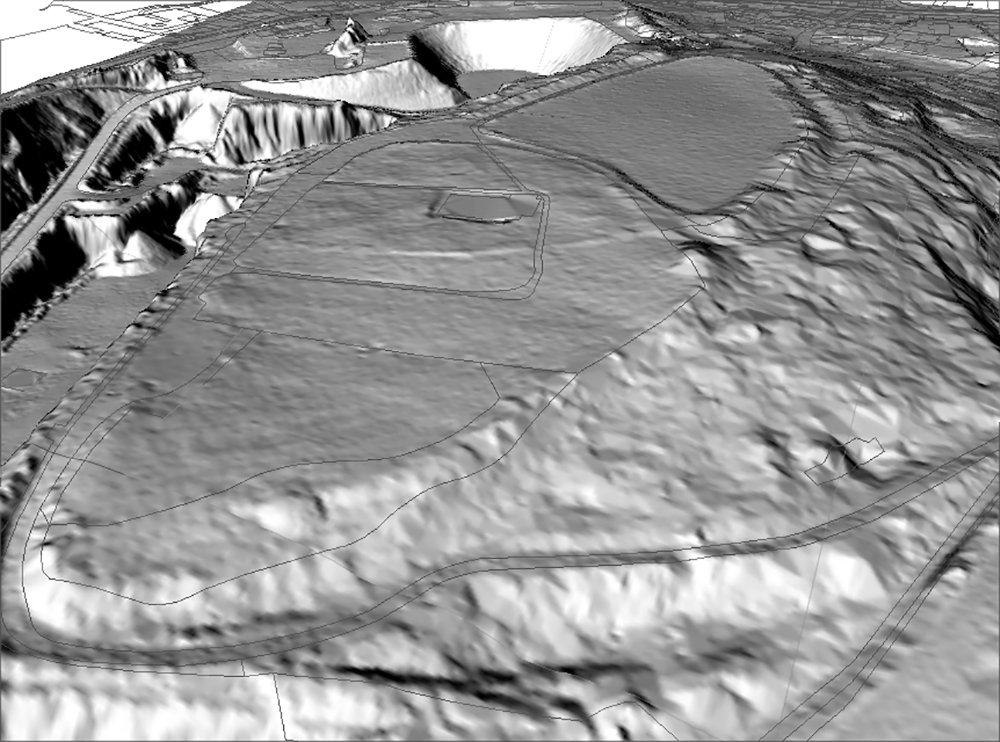
The ramparts, which extend for 200m south of the in-turned west entrance, are relatively well defined, comprising a bank some 14m wide, rising up to c.3.1m above the ground below, and a ditch 4m wide with a depth of less than 1m. A part of the possible counterscarp bank on the outside of the ditch, surviving in the southernmost corner of the ramparts, appears to be up to 8m wide, rising above the ditch by 1m. Pockmarks – the result of historical quarrying into the hillslope – visible on the visualisation appear to have disturbed the form of the possible earthworks downslope of the bank and ditch.
The ramparts north of the west entrance are less well defined. Some 175m of the mutilated bank is visible from the model, which rises between 3.5m-5.0m above the ground below, but not above the ground level of the north field. The ditch earthwork appears to be absent in this part of the hillfort. The presence of quarry pockmarks and the proximity to the modern road suggests that the ditch has since been destroyed.
Overall, the DTM-derived visualisations do not appear to reveal any significant new archaeological features but comprise a useful management tool to understand the extent and condition of the surviving hillfort earthworks.
Cite this as: Whittaker, C. 2019 Breedon Hill, Leicestershire: new surveys and their implications, Internet Archaeology 52. https://doi.org/10.11141/ia.52.6
Internet Archaeology is an open access journal based in the Department of Archaeology, University of York. Except where otherwise noted, content from this work may be used under the terms of the Creative Commons Attribution 3.0 (CC BY) Unported licence, which permits unrestricted use, distribution, and reproduction in any medium, provided that attribution to the author(s), the title of the work, the Internet Archaeology journal and the relevant URL/DOI are given.
Terms and Conditions | Legal Statements | Privacy Policy | Cookies Policy | Citing Internet Archaeology
Internet Archaeology content is preserved for the long term with the Archaeology Data Service (ROR). Help sustain and support open access publication by donating to our Open Access Archaeology Fund.