Cite this as: Adler-Wölfl, K. and Skomorowski, R. 2025 GIS Tools for Urban Archaeology in Vienna. Site Mapping with Different Geometries, Internet Archaeology 70. https://doi.org/10.11141/ia.70.10
The number of construction projects in Vienna, Austria, has increased considerably in recent years, notably driven by climate protection measures, such as the development of new underground lines and the expansion of district heating and cooling systems. Particularly in densely built city centres, these large construction projects pose a significant logistical challenge. Undertaking excavations in such contexts, characterised by deep stratigraphy and tight time constraints, underscores the critical role of archaeological and historical research before digging begins, to ensure the quality of results.
To create accurate forecasts for construction projects, large and complex amounts of data must be processed. Geoinformation systems (GIS) can help with this, and point-based GIS mapping represents the first tool used in Vienna's arsenal. Since 2000, the cultural property register (Kulturgüterkataster) has been available to the public online (Börner and Öllerer 1998; Mosser 1998; Liebert and Mosser 2005). In 2008, a new GIS-based internet portal, Wien Kulturgut, (Figure 1) was launched (Börner et al. 2008; Mosser & Krause 2012). This provides point-based GIS mapping of all known archaeological sites, based on ViennaGIS, the city of Vienna's GIS. The basis of Wien Kulturgut is a digital multi-purpose map, in which various layers can be added, including archaeological sites. The colours of the points indicate the dating of the site (green: prehistory; red: Roman period; blue: Middle Ages; brown: modern times; grey: unknown), while the shapes of the points refer to the type of find (diamond-shaped: single find or stray find; circles: graves; squares: settlement features; orange cross: fossil find).
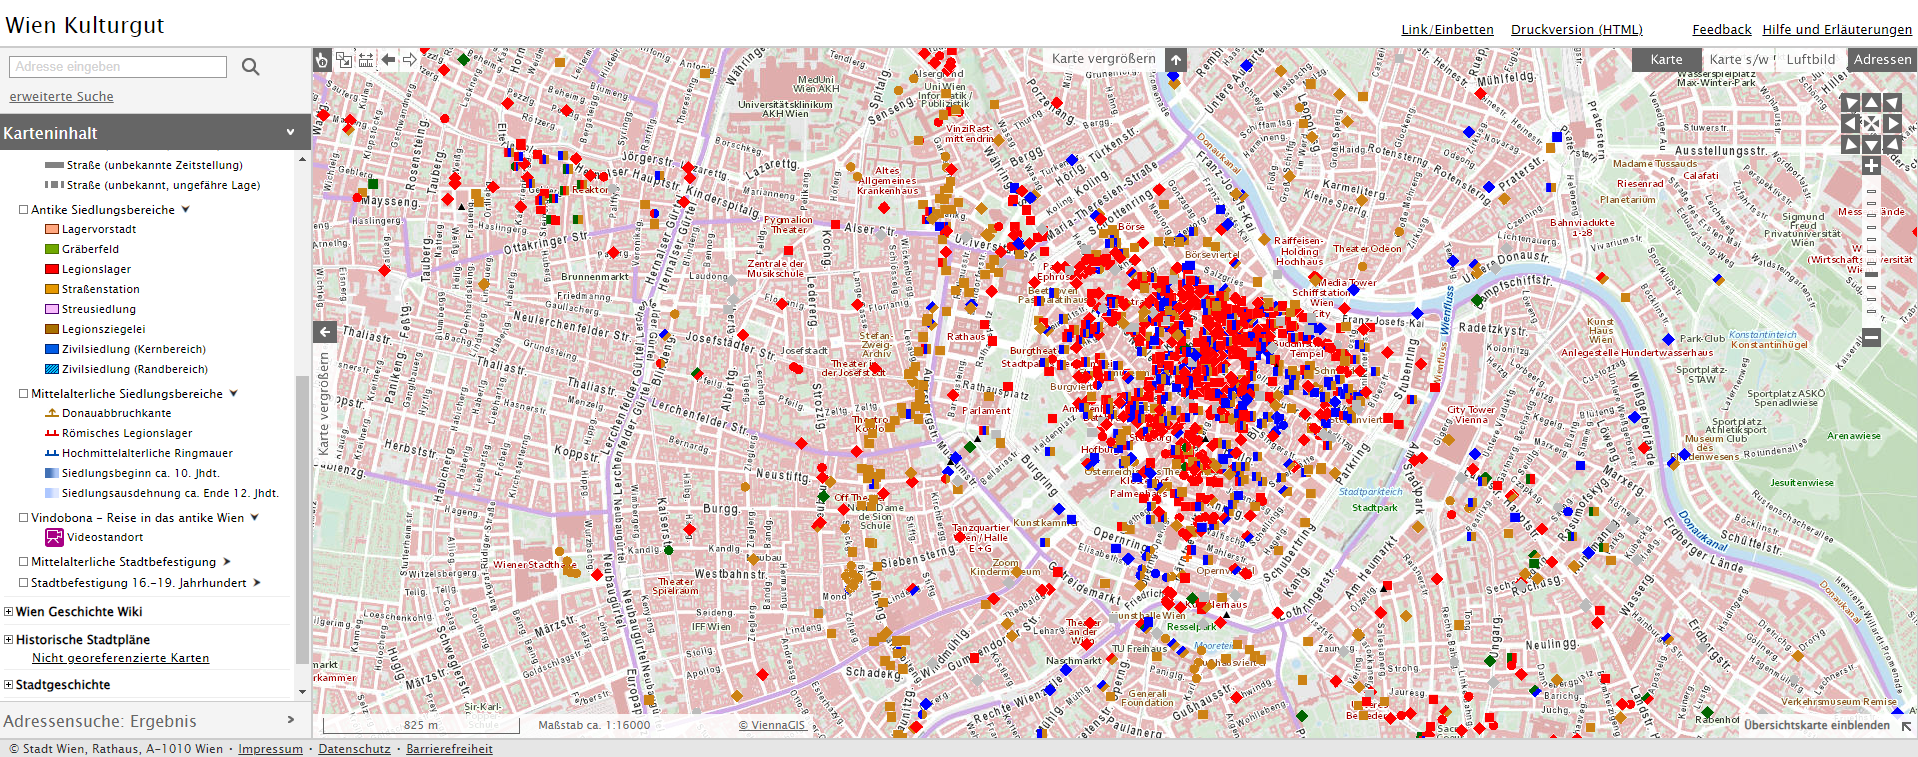
Each individual archaeological site is uniquely identified by an excavation number (Grabungscode), comprising the year of discovery and a consecutive number. For example, in the case of the Frankhplatz excavation, this is '202030' (3D-Models from the excavation Frankhplatz). This code system was introduced in the early 1990s and also serves as the primary key for the associated database. More than 3000 excavation numbers have been defined in Vienna so far, and around 50 new ones are added each year. The database provides a great deal of other information as well, including the address and dates of the archaeological site, a list of the features and finds, a short description of the excavation results, and associated references.
Grabung Frankhplatz by Crazy Eye on Sketchfab
Apart from this information, the service Wien Kulturgut allows the overlay of the current map of the city with different historical maps, which is useful for preparing archaeological reports. Additionally, the Vienna History Wiki layer can be added, which provides access to information on individual buildings and topographical objects such as streets and places.
While the internet portal Wien Kulturgut provides a lot of information, it has some disadvantages, particularly for use by the public, and by developers and contractors. In practice, the point-based system provides no information about the actual size of archeologically relevant areas. In other words, just using points says too little about the chance or risk of discovering archaeological remains on a building site. For visualising the full extent of sites, extensive GIS mapping in the form of polylines or polygons is advantageous. The Vienna City Archaeology Department is therefore currently collaborating with the Federal Monuments Office to implement this approach for Vienna.
The second tool used in Vienna is therefore polyline-based GIS mapping. This is based on the excavation results, which are documented as polyline features using AutoCAD; so far 30,000 polyline features have been located in Vienna by GIS. Since 2005, features have been measured using a total station in combination with an AutoCAD system. During the process of measurement, a clearly defined layer name is maintained in the AutoCAD structure. This ensures that later on the information stored in the system is easily identifiable.
The layer name follows strict rules. It consists of the excavation number, the feature number, an abbreviation for the feature type, for example 'fm' for a wall foundation, and the time period, for example 'RZ' for Roman period (e.g. 202030_355_fm_RZ).
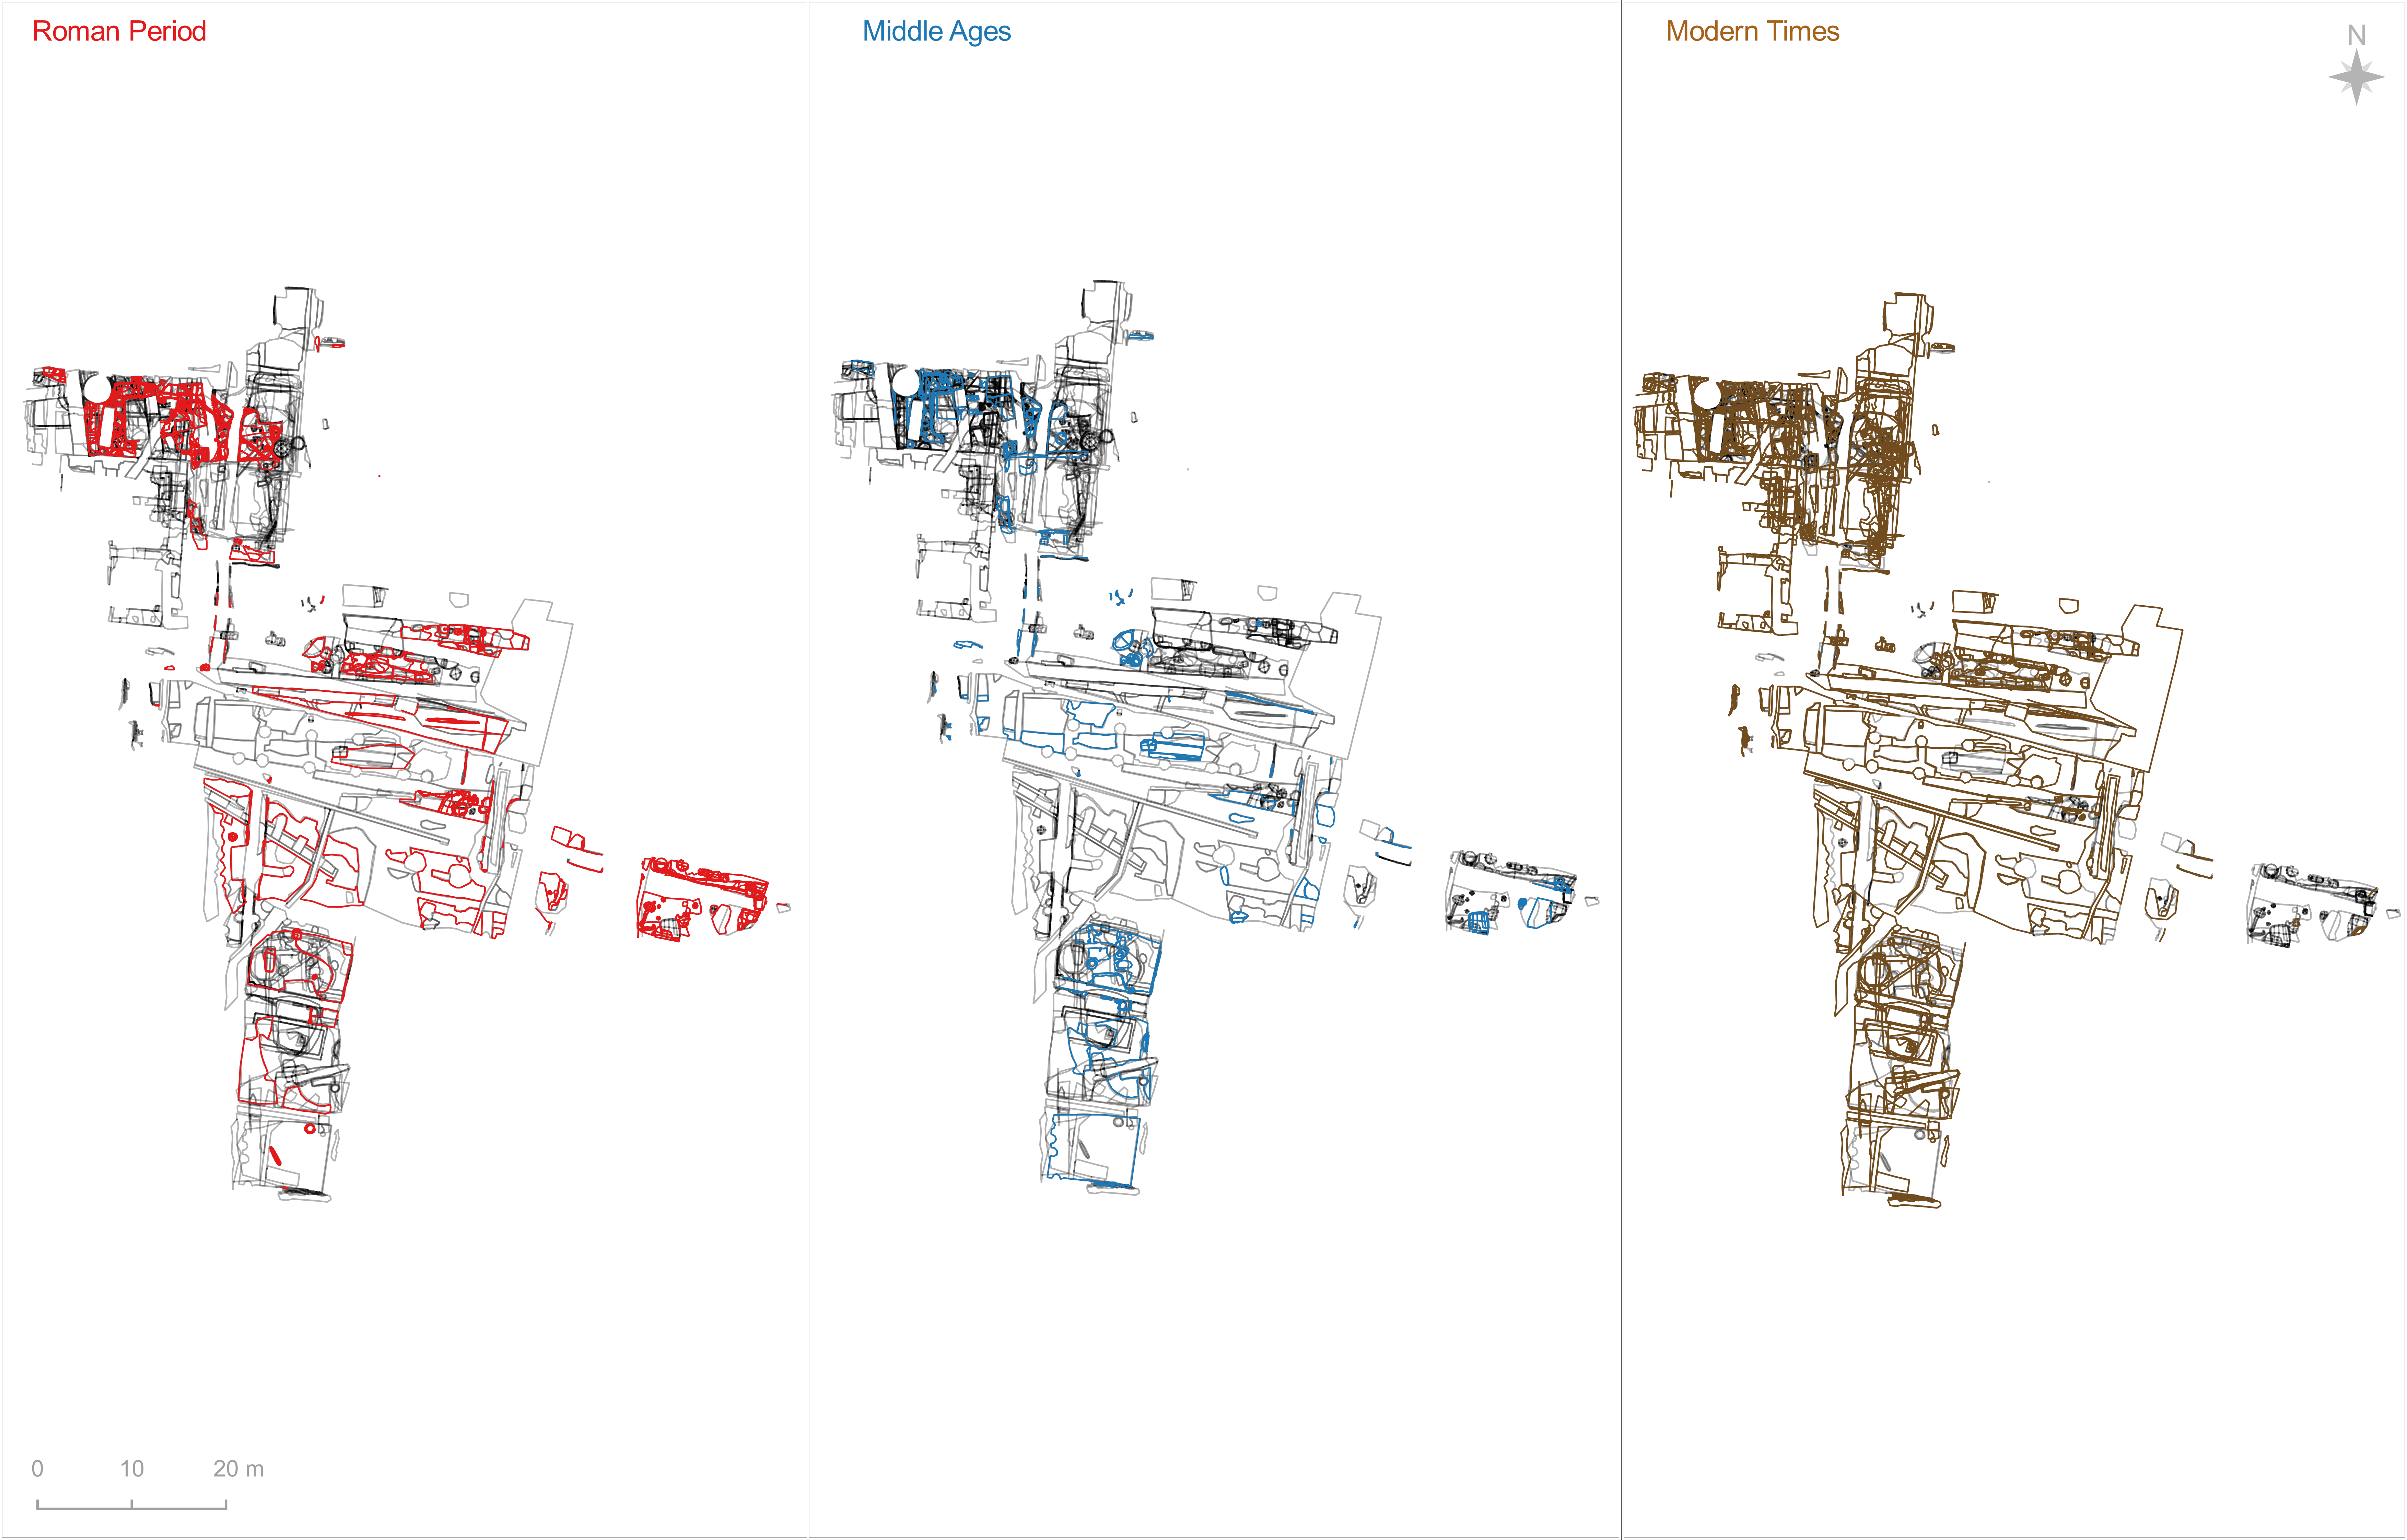
The next step is to transfer the data to a GIS tool. In GIS the abbreviations are written out in full in an attribute table. Once the data is harmonised, simple searches can be carried out, for example relating to different time periods. In the case of the Frankhplatz excavation, a temporal query identified features of the Roman period in red, the Middle Ages in blue, and modern times in brown (Figure 2).
A third tool is polygon-based GIS mapping. Mapping in the form of polygons is a very useful way of visualising sites at their largest possible extent. The Vienna City Archaeology Department is currently working on this project in cooperation with the Federal Monuments Office. The impressive vector-based GIS mappings and historical landscape reconstructions compiled by Severin Hohensinner, based on several master theses at BOKU University Vienna, were used as the database. These maps, recently completed on behalf of the Wien Museum, show the historical landscape and settlement development of Vienna from the late Iron Age to the present day (Figure 3).
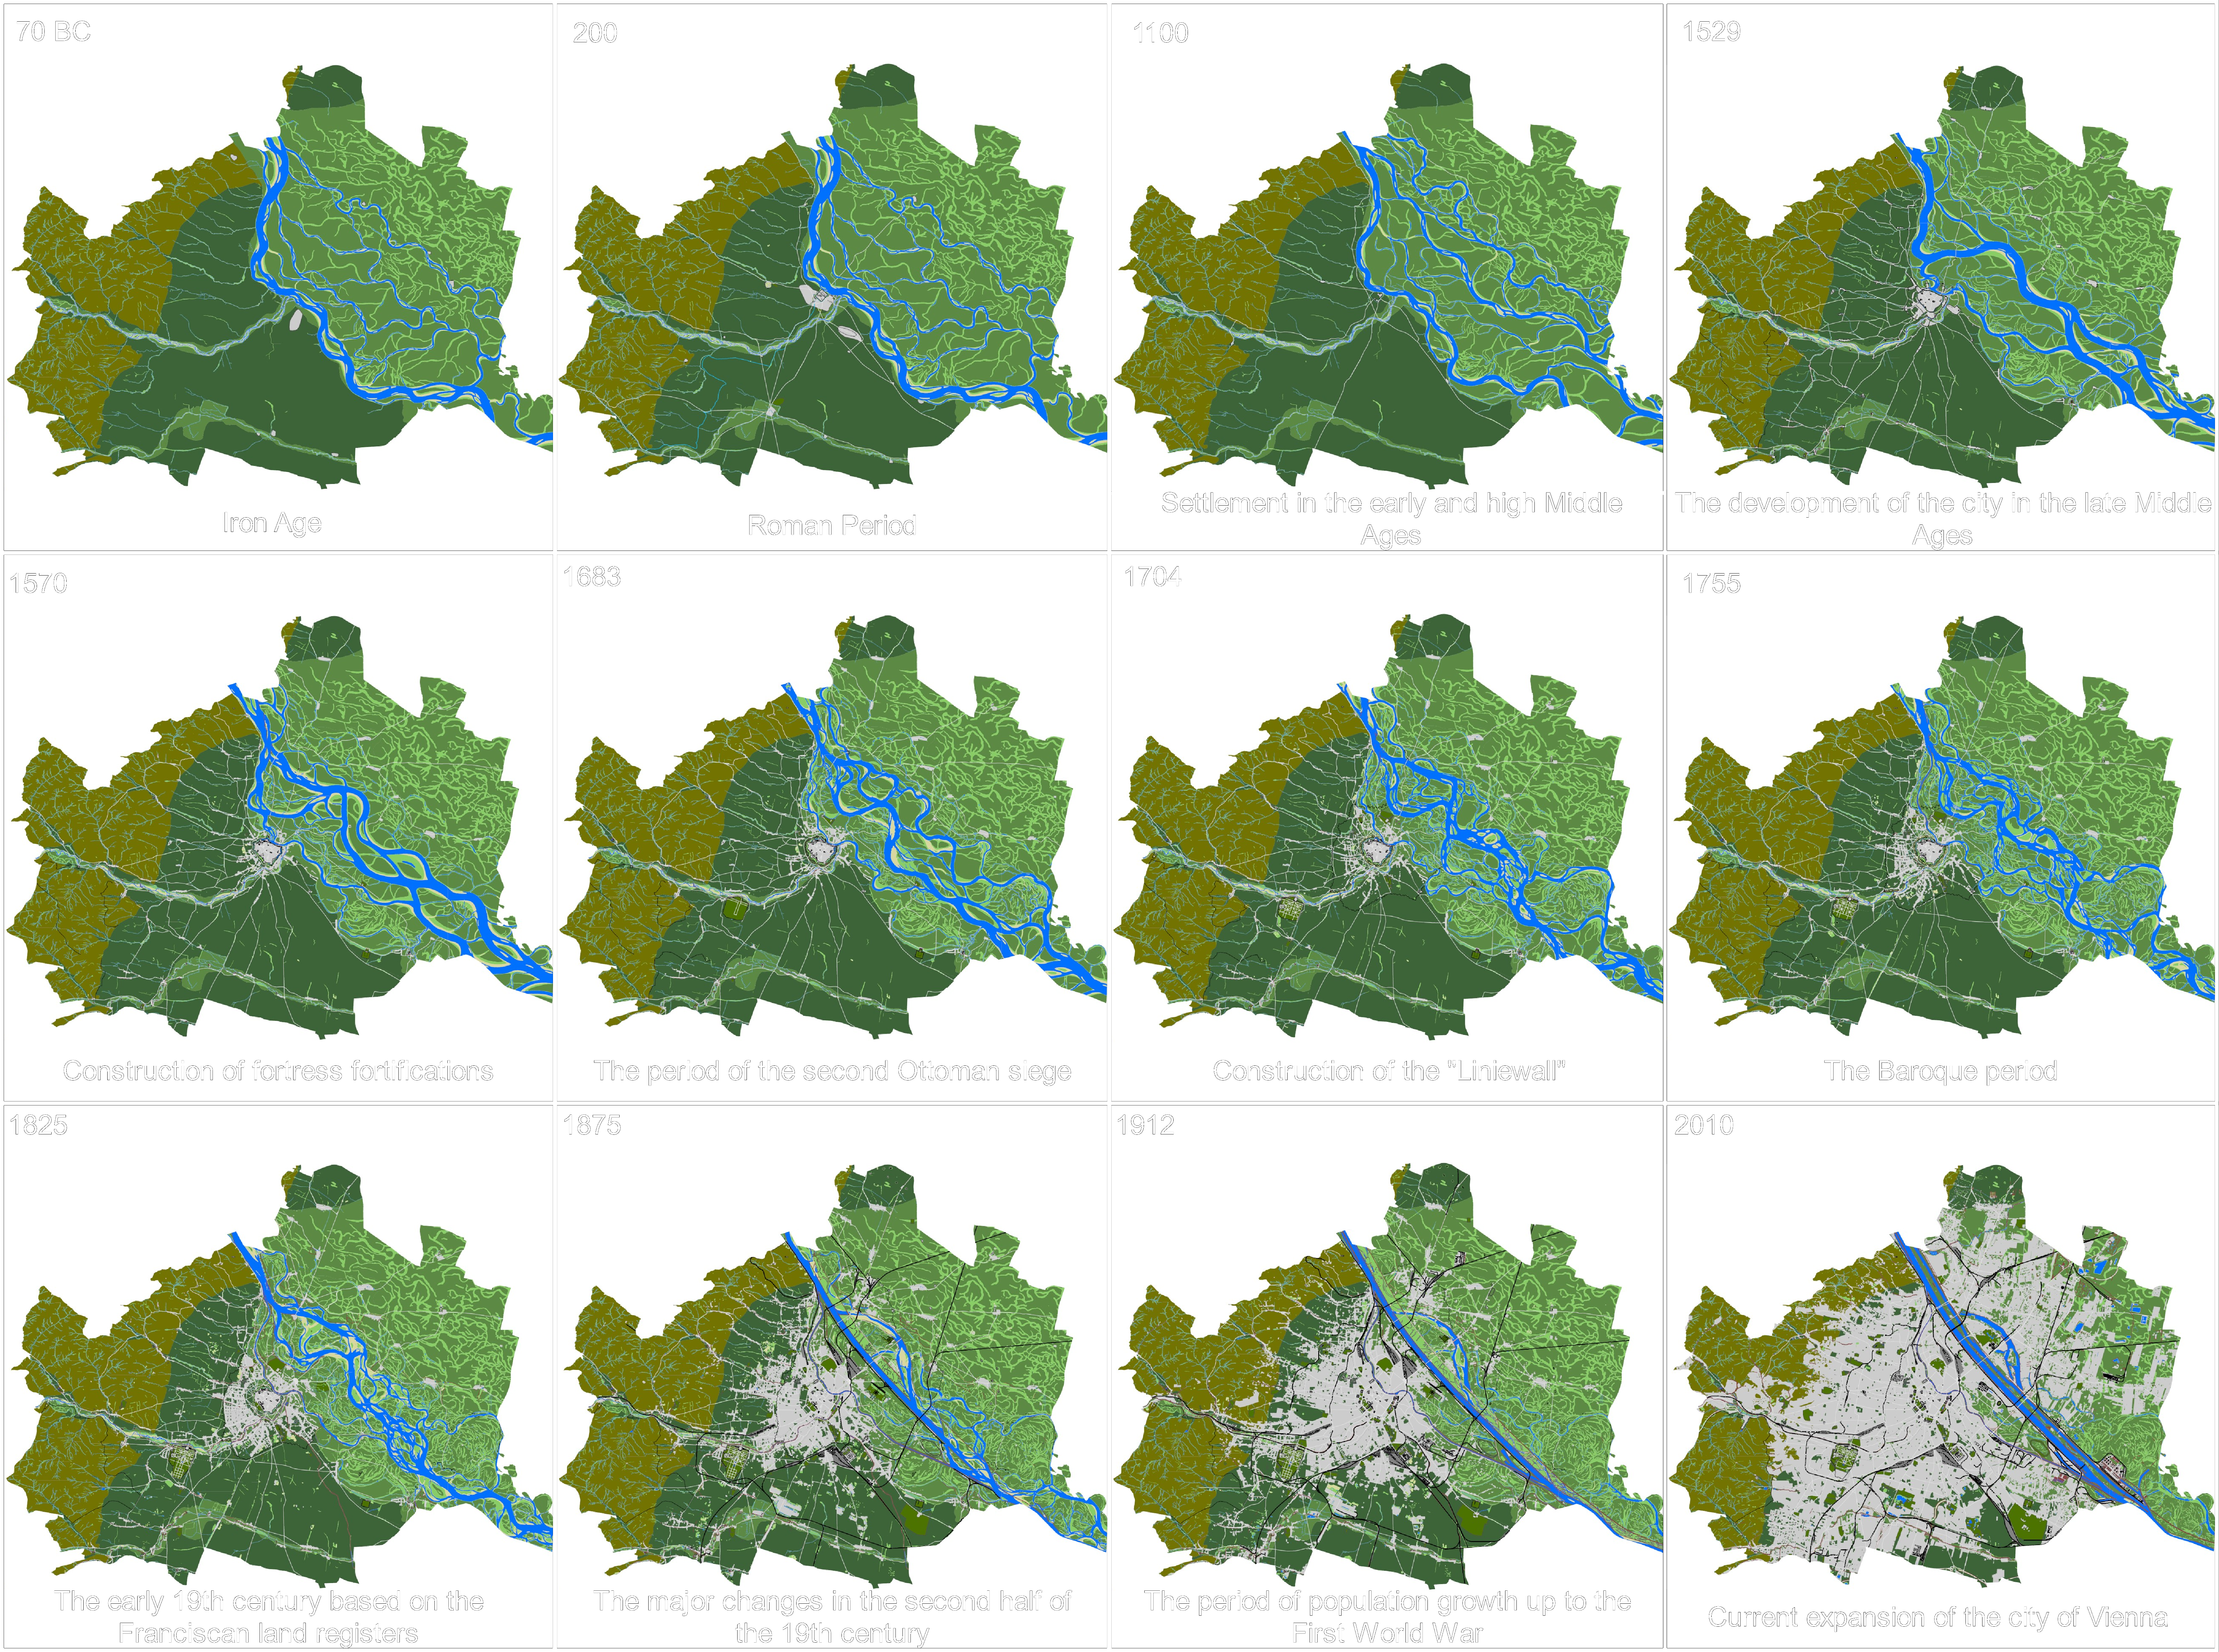
On the maps, geological formations are visualised in different shades of green and brown; changes in river landscapes, especially the Danube, in blue; and changes in settlement areas in grey (Figure 3). The maps track the area from the late Iron Age, through the period of Roman settlement, the decline in the early and high Middle Ages, the development in the late Middle Ages, the fortress fortifications during the Renaissance until the second Ottoman siege, the Baroque period, the 18th and 19th centuries, up to the present day.
The mapping of the archaeological and historic settlement areas is based on the settlement polygons created by Severin Hohensinner. Attributes were added in accordance with the specifications of the Federal Monuments Office. These include: a unique location name; administrative data; object-related data; and broad and narrow age determinations. The nomenclature provided by the Federal Monuments Office allows object-related but also temporal queries.
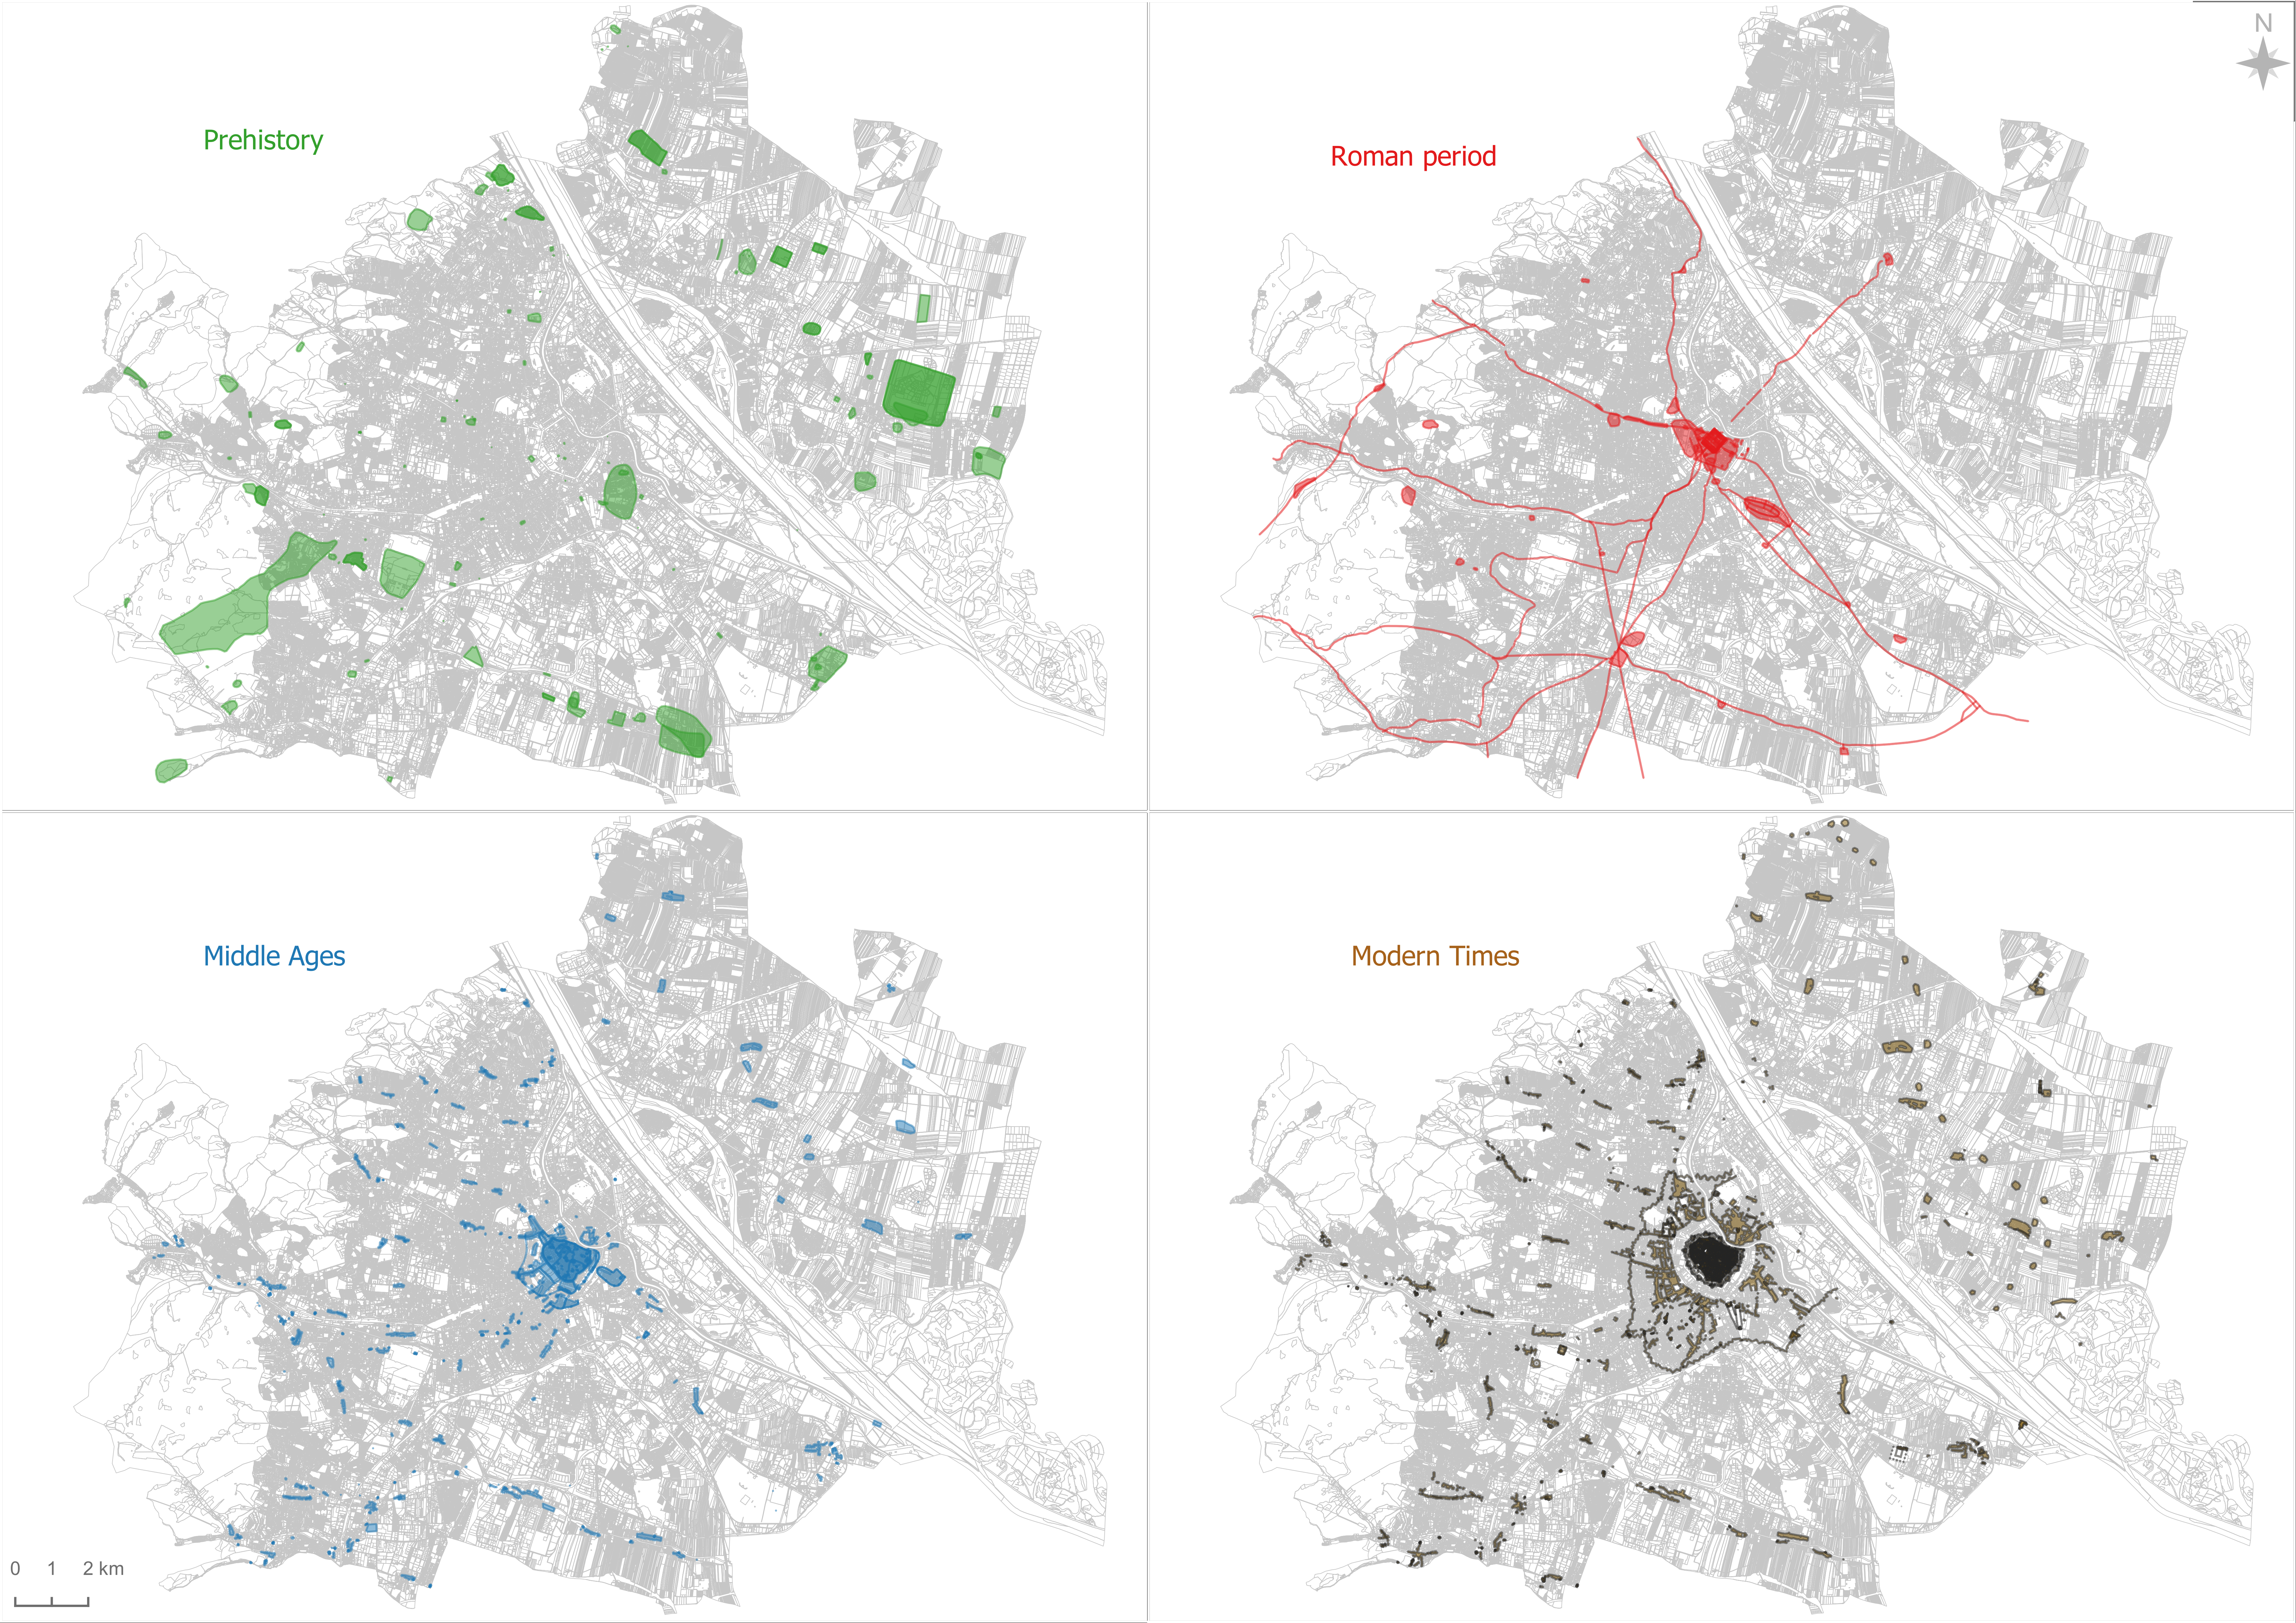
For example, the mapping of Roman sites in Vienna contains the location of the legionary fortress, the canabae legionis, the older auxiliary fort, various civil settlements, the roads, the brick factory of the Legion, and, last but not least, the burial grounds.
This process has also been carried out for prehistory, the Middle Ages and modern time periods (Figure 4). For example, known medieval settlement polygons have been supplemented and attributed, including the medieval town and surrounding villages, suburbs, fortifications, districts and known sacred buildings.
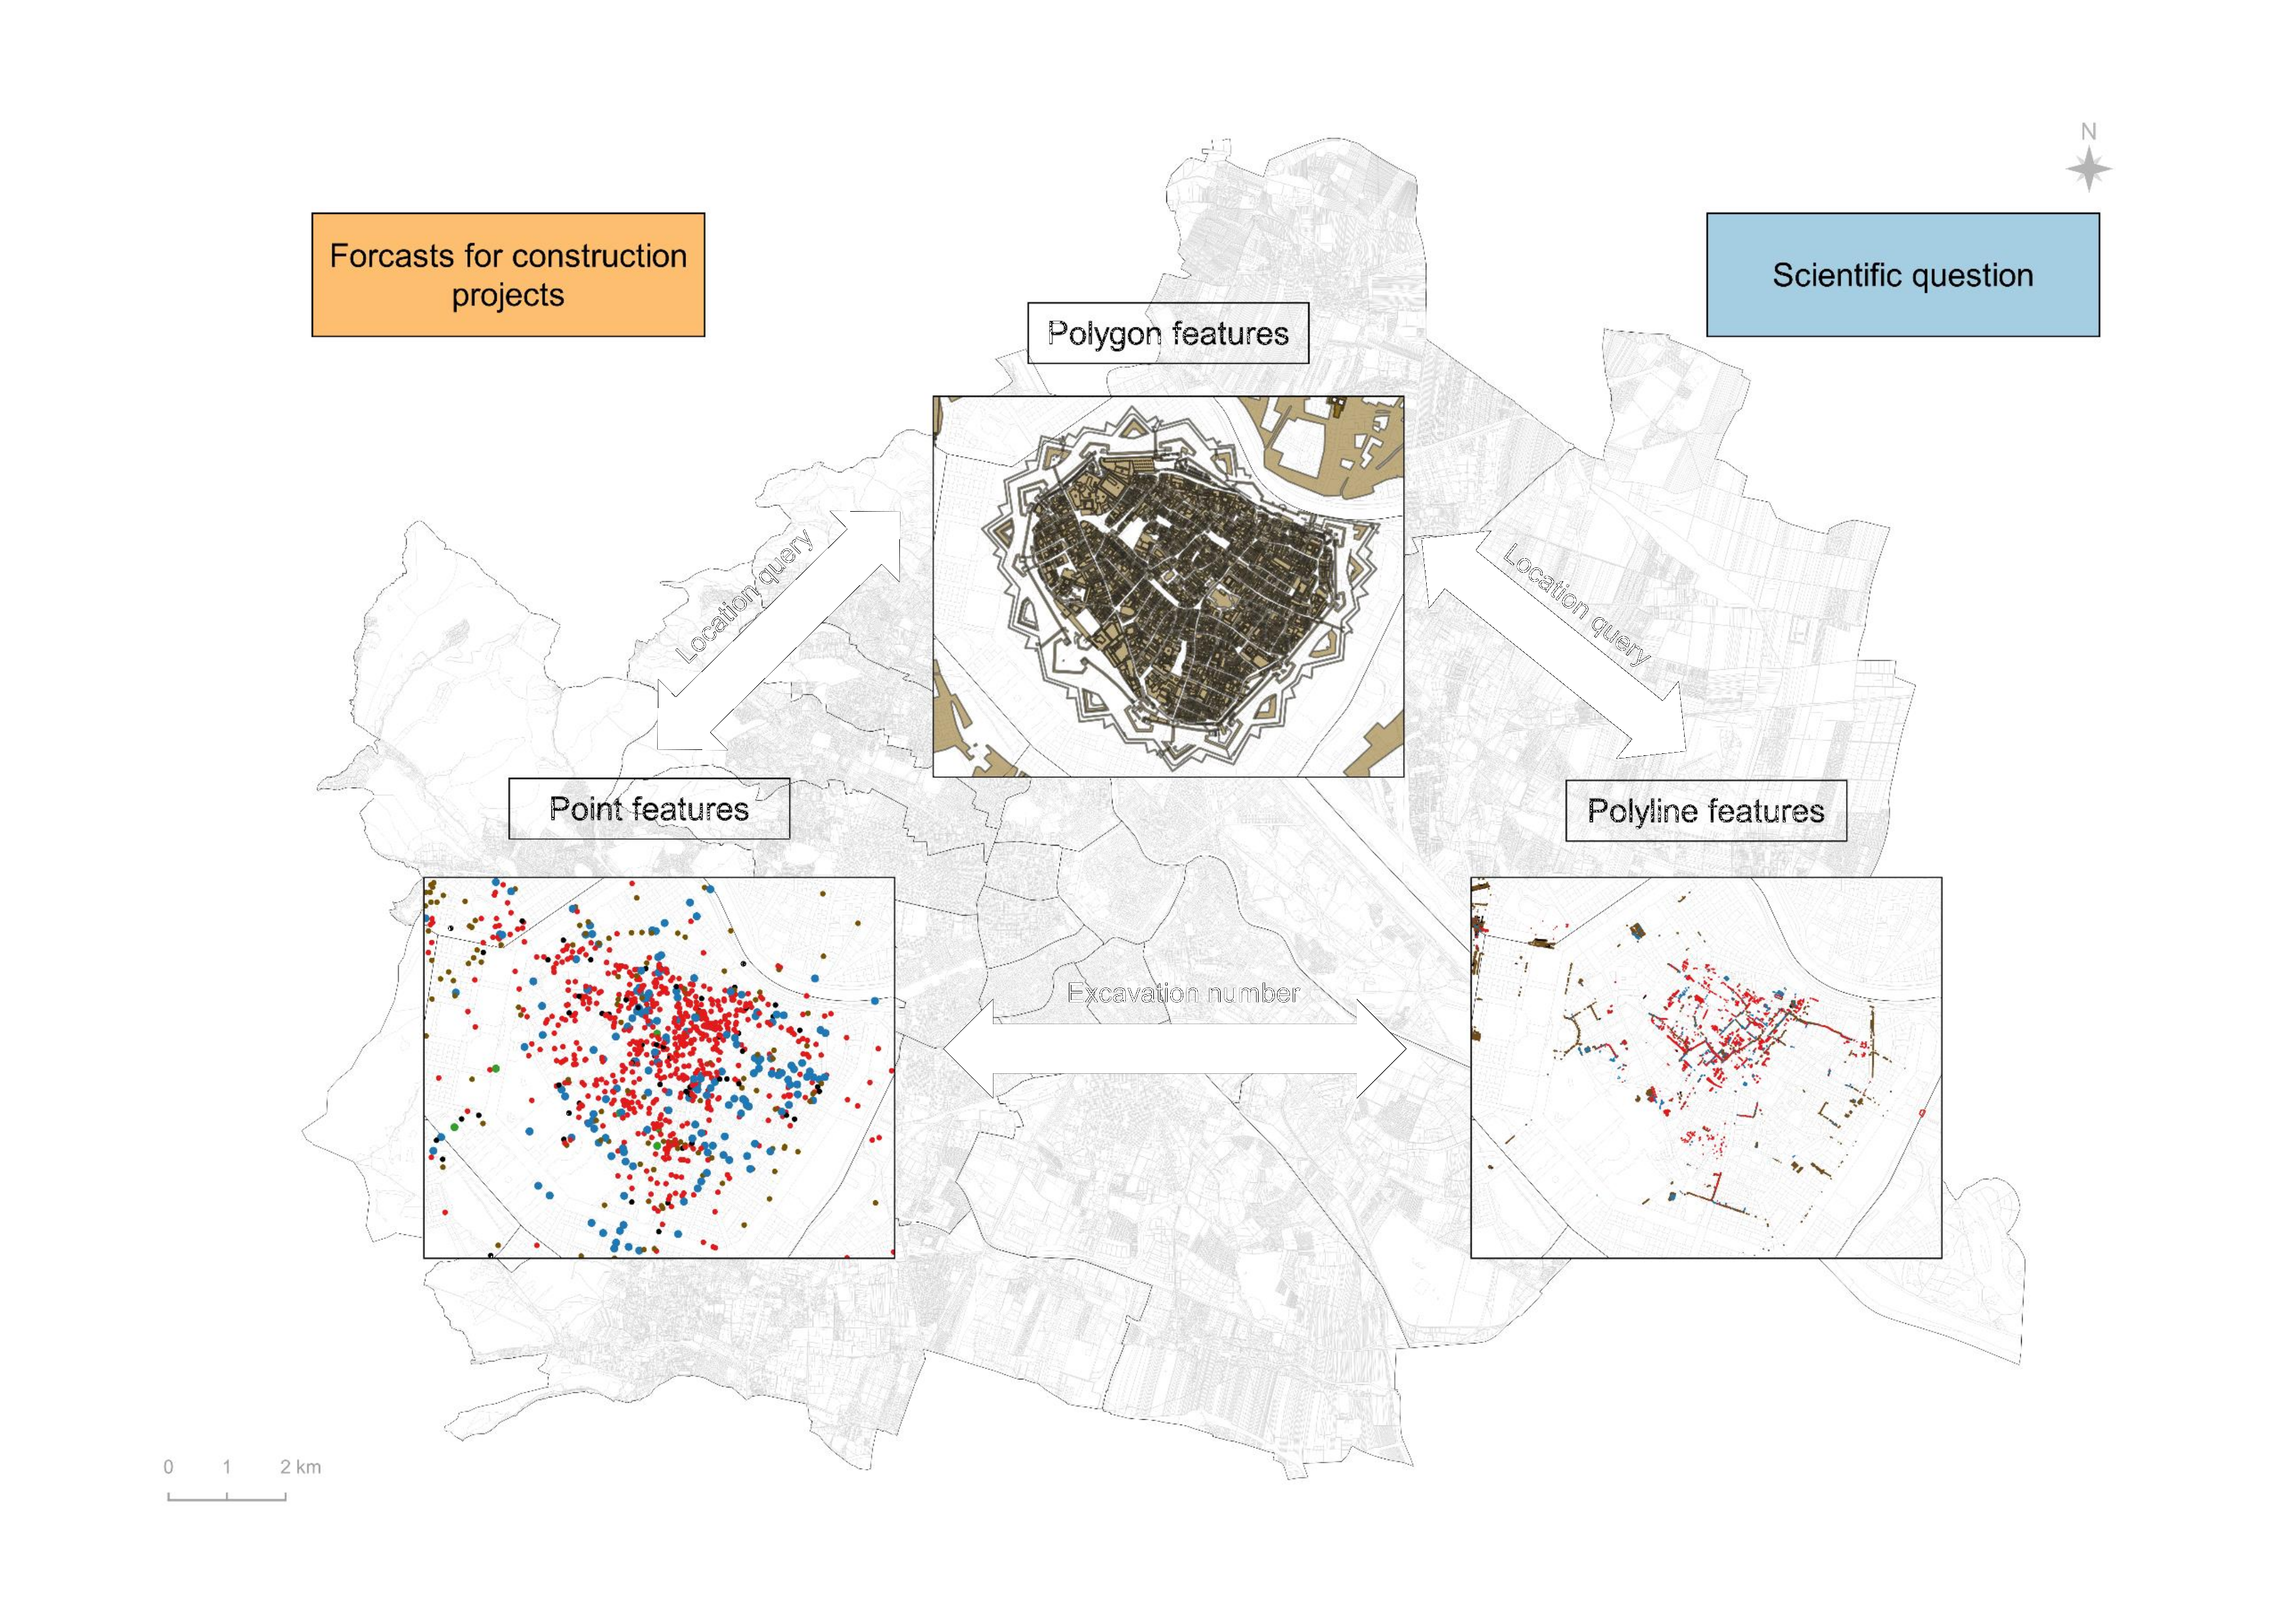
All three tools have a relationship with each other. The point features and polyline features are related via the excavation number. The polygon features are related to the point features and the polyline features via a location query (Figure 5). The GIS tool connects the different kinds of data to a map, integrating the location data with several types of visual data and descriptive information.
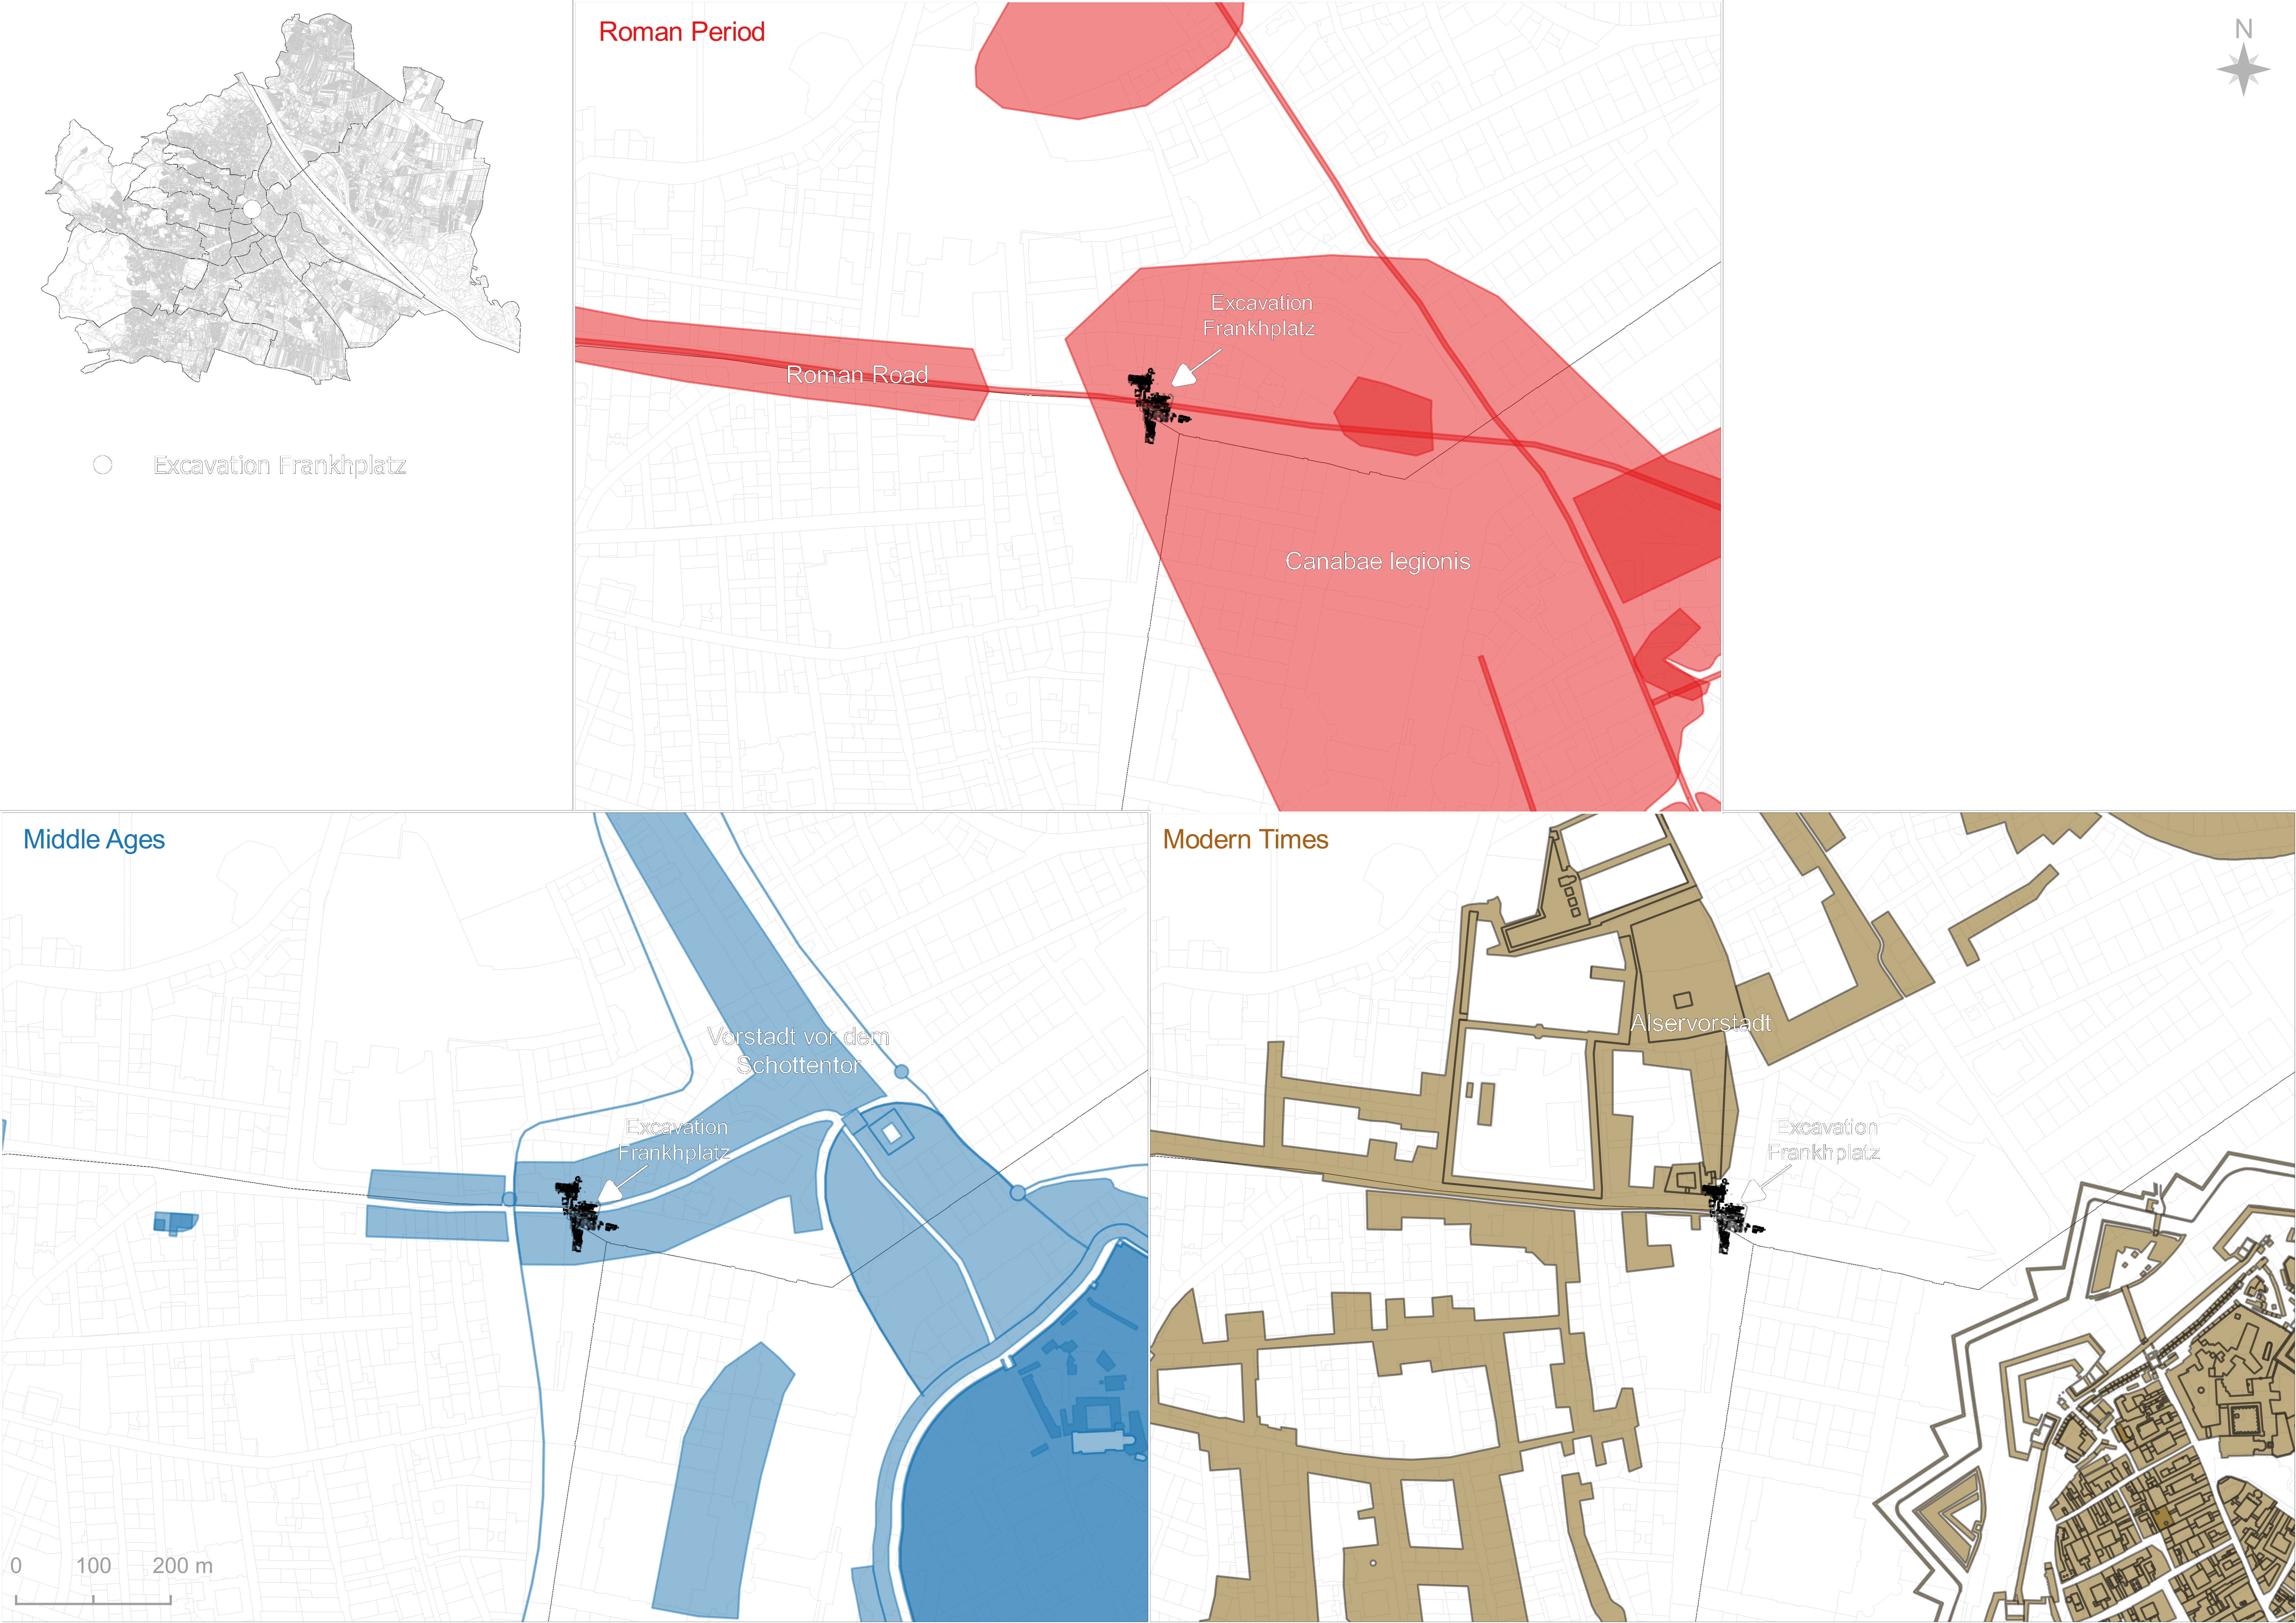
For instance, when analysing an excavation, the GIS tool identifies, with the help of a location query, in which polygons particular features are located. Again using Frankhplatz as an example, the relevant features are located within the Roman canabae legionis, the medieval suburb in front of the Schottentor, and the modern suburb of the so-called Alservorstadt (Figure 6).
The city of Vienna plans to transfer the current online service Wien Kulturgut to a geoportal in 2024 or 2025. The new geoportal is based on the Masterportal web application. Masterportal is an open-source geoportal, originally designed by the city of Hamburg and used in various German cities, and is constantly being further developed. It uses Open Geospatial Consortium (OGC) standards and is based primarily on vector data. The new polygon features are to be integrated into the new geoportal and will be accessible online.
Within the new geoportal, point-based GIS mapping combined with excavation results in the form of polylines and polygon-based GIS mapping will serve as a key tool for archaeological research and precise archaeological forecasts for construction projects, but also for heritage management and public access.
Internet Archaeology is an open access journal based in the Department of Archaeology, University of York. Except where otherwise noted, content from this work may be used under the terms of the Creative Commons Attribution 3.0 (CC BY) Unported licence, which permits unrestricted use, distribution, and reproduction in any medium, provided that attribution to the author(s), the title of the work, the Internet Archaeology journal and the relevant URL/DOI are given.
Terms and Conditions | Legal Statements | Privacy Policy | Cookies Policy | Citing Internet Archaeology
Internet Archaeology content is preserved for the long term with the Archaeology Data Service (ROR). Help sustain and support open access publication by donating to our Open Access Archaeology Fund.
 Home
Home