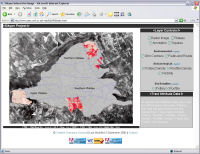
Figure 10: The final prototype of the Sikyon interactive image in IE6
View the prototype Sikyon SVG tool (opens new window). Must be viewed in Internet Explorer 6+ for full functionality.
The Sikyon interactive image was developed using a combination of the previously mentioned technologies. Other technologies, such as XHTML and CSS, were also deployed but play a secondary role to the main two. As discussed earlier, the predominant goal of the Sikyon interactive image was to design it as an independent VRE tool with the intention of incorporating it into a fully fledged VRE at a later stage. In this sense, the Sikyon interactive image is a proof-of-concept type application. This is evident in the fact that it is a lone tool and lacks a comprehensive set of data. However, it is still a useful tool for the Sikyon Project in its current state, and follows a structure that will allow for further developments in the future. Given the previously declared needs and objectives, the design of the Sikyon interactive image was built off the existing resources. This was primarily the GIS shapefiles and AutoCAD files that were used as the chief research resources of the project's members.
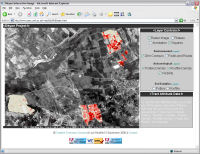
As mentioned previously, the spatial data residing in the GIS is continuously compiled by the various members of the project and required little intervention in preparation for the interactive image. Since SVG is not supported by ArcView, an intermediary application was required to convert the shapefiles into the SVG format. Adobe Illustrator CS2 was used for this process. A set of shapefiles were carefully identified based on their assumed usefulness to the principal members of the project and then exported into the Encapsulated PostScript (EPS) format. The layers were divided into three kinds: environmental, archaeological, and survey specific. The environmental layers consisted of the 20-metre contours and field and roads. The associated archaeological data made up the archaeological layers while the survey-specific layers were the imposed boundaries set out by the project. Owing to limitations of the export function in ArcView, a fixed view window was established and then the required layers were turned on before exporting. Layers are not preserved by the export function from shapefile to EPS so several exports were required to maintain the desired separations.
The first EPS file was simply opened using Adobe Illustrator and subsequent EPS files were embedded using the 'Place...' option. The placement of the additional EPS files were not always in the correct location so some manual relocation was necessary. As the files were imported one by one into Adobe Illustrator, a check was performed to ensure data integrity. Annotations were added at this stage to identify the three zones of the plateau. As the image reached a satisfactory stage, the EPS file was converted into SVG.
At this point many adjustments were made to the physical size of the file displayed and even some changes to the layering organisation. Once the right object size and layering order was achieved, the SVG file was saved and prepared for the XHTML document. The binary code created by Illustrator was removed from the working copy.
However, with the support of SVG in ArcGIS 9.2, this process is significantly simplified by removing the need to use Adobe Illustrator as an interim measure. Maps can be exported as SVG directly out of ArcGIS 9.2 which means less time is required creating the images and there is less chance of human error creeping into their creation. Additionally there is an ArcGIS plug-in which allows you to associate attribute ids from the shapefile's attribute tables with the SVG elements. Originally this would have been done by hand, which was both tedious and time consuming. Now when a map is exported as SVG the appropriate tract, square, or object id could be associated with the corresponding SVG element.
With the SVG file prepared, it was necessary to embed the image in an XHTML document and prepare the layering functionality. SVG images must be embedded into XHTML/HTML Web pages using one of two methods. The W3C approved method is with the use of the OBJECT element, which is a general-purpose element that can be used to embed a number of other objects in XHTML/HTML Web pages (Watt et al. 2003, 484). There are issues with this method, one of which is variable browser support. As Watt et al. caution, "On occasional Windows machines using IE, the object element seems not to work at all for SVG images. The reasons are unclear" (2003, 486). Instead, the recommended method is to use the unofficial EMBED element. While this is not an official W3C HTML element, it does enjoy widespread support from browsers. Because of this the XHTML document containing the SVG image will not validate against the W3C standard. However, since this is the only fault of the code and it is a necessary work-around, the Web page can be assumed to be valid for all intents and purposes. The code used to embed the SVG image in the XHTML document can be seen in Code Listing 2.
Code Listing 2. Using the EMBED element for SVG images
<div id="svg">

		<embed src="Images/SVG/sikyon.svg" id="sikyon" name="sikyon" type="image/svg+xml" width="701" height="506" pluginspace="http://www.adobe.com/svg/viewer/install"></embed>

</div>
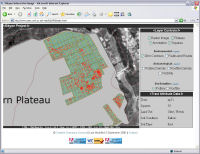
To enable the various layers in the SVG image to be turned on and off, JavaScript was employed. The code applied by Holly Wright (2006) for layering controls was used as a template for the Sikyon tool (Appendix). This allowed for in-page check boxes to control the layer visibility within the SVG image. To make sure the interactive image was usable it was paramount that useful layer controls were in place.
Once the layer controls were established, Ajax functionality was addressed. A simple XML file was designed, holding tract information such as tract ID, number of squares per tract, land-use, soil condition, and soil type and square information such as square ID, pottery counts, roof tile counts, visibility, etc. This XML file acted as a data set which could be accessed through the Ajax technique in the absence of a more permanent option such as a relational database.
Describing the step-by-step process of the JavaScript functions is excessive and tiresome. The appendix has the entire code listing for the JavaScript which can be investigated to understand the procedures better. In summary, an onmouseover event in the SVG document triggers a JavaScript function to initiate asynchronous communication between the client and server. Once this has been established, the client requests information from a separate XML resource relative to the initial onmouseover event. Once the appropriate data has been retrieved by the client, the relative area of the Web page is updated without refreshing the entire document. This is a rather simple example compared to the potential that exists using the Ajax technique. Nonetheless it is an excellent model of the mechanics of the technique and provides an effective tool for the Sikyon project members.
© Internet Archaeology/Author(s)
URL: http://intarch.ac.uk/journal/issue23/5/5.html
Last updated: Tue Mar 25 2008