
Figure 13: An example of Firefox 1.5 failing to render the SVG correctly
The Sikyon interactive image prototype is a good example of the potential of VRE-style online tools, yet it is still not without its problems. The standard controls to manipulate images provided by the Adobe SVG Viewer, such as panning and zooming, are absent when the interactive image is viewed in Firefox 2.0.0.12. There were also unknown issues with even viewing the image sometimes (Fig. 13). While this is a surprise since Firefox boasts of native SVG support, the Mozilla SVG Project acknowledges that they 'are still a long way away from full SVG support' (Anon. 2006a). Viewing the interactive image in IE (6 or 7) with the Adobe SVG Viewer is currently the only browser that allows greater functionality of the SVG image. IE is the primary Web browser used by the members of the Sikyon Project so this is not currently an issue for the Sikyon Project's use of the tool. However, this may present problems for other potential users or projects wishing to employ a similar tool. In theory this shouldn't be an issue, but with the varying degrees of support from the browsers at present, it is.
With the mechanics of updating the SVG file a work in progress, the anticipated issue of file size should be addressed. With only two seasons' worth of data the SVG file has already reached 3.5 Mb and takes around 10 seconds to load in IE. One-sixth of this size is due to the associated aerial photograph which is not critical to the use of the tool and may be removed from later versions. Also the photograph was taken in the 1980s, making it a questionable reference tool for the current layout of the plateau. Even with the aerial photo removed, the file is an uncomfortably large 2.9 Mb. Under the original permit for the project, five years of survey are expected. Assuming consistency of data gathering over the final three seasons, based on the amount gathered from the first two, the final SVG file could be around 7 Mb (subtracting the aerial photograph and the static environmental layers).
This potential issue could be alleviated by splitting up the single image into three according to the zone divisions. This would, however, remove the capability to compare data on a plateau-wide scale, which for some types of query would be undesirable. The only way to bring down the file size of the SVG file is through dividing the image or excluding data. As SVG is a data-driven format, the source code elements of the image could be stored in a relational database. This would then allow the user to select which layers or parts of the image they wish to be displayed, which would in turn cut down on the overall file size of the image. As time goes on, another possibility is that the infrastructure of the Web will continue to advance, making waiting for a 7 Mb SVG file over the Internet a thing of the past. An example of the staggering speed with which technology moves is the terabit fibre-optic cables which are being developed for possible use in 2010 (Agence France-Presse 2005). File size issues over the Internet have always been a source of concern (Holtorf 1999; Basu 1999) and will most certainly continue as greater demands are made on the Internet by its users. Yet beyond transporting the file over the Internet, the client machine will still have to process the SVG image, which could potentially still slow down the delivery and display of the image. The advantage of using SVG to display the image is that once the file is loaded, no more requests to the server are required. This means that while the user may have to wait slightly longer for the file to load, afterwards zooming, panning and manipulating layers is quick and seamless without repeated calls to the server.
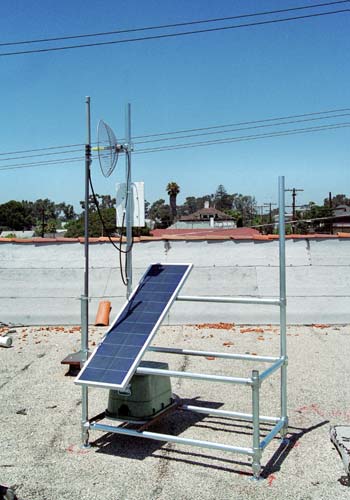
It is a given that the amount of data included in the interactive image for the Sikyon Project will continue to increase. However, how the tool might be used throughout the lifespan of the project is unclear. The intended current use of the interactive image is as an online reference tool for the various members of the project. In the future, the interactive image could be used on laptops or other mobile devices in the field and utilise solar-powered WiFi (Anon. 2006b). This would allow fieldworkers to access information pertaining to an area on site or upload data directly to the server as needed. This is not an immediate goal for the project, but the potential is impressive. In its current state, the tool remains flexible enough to be used for different types of investigations as well as capable of handling more data and layers. If particular specialists want different questions answered, the tool and its data can be tailored accordingly.
Yet as the survey aspect of the project comes to an end, the type of questions asked will change as the aims and objectives of the project mature. Building on the findings of the survey, the next phase of the project will have a plethora of information relating to the assumed usage of the plateau. As excavation is the next logical step of the project, veritable 'ground truthing' of the survey data can be observed. By comparing the surface finds of the survey with the excavation findings, the usefulness of this unique type of survey can be tested. The question of whether the survey methods employed at Sikyon were valid will definitely be at the forefront of every project member's mind; however, changing needs may produce different questions for the data. The excavation decisions will ultimately be driven by the survey data and attempt to elaborate upon them. At this later stage, the interactive image becomes a sophisticated reference tool which can also perform ongoing data management functions. The interactive image can maintain the entire set of spatial data for the project in an online format which is accessible, as described earlier. The question will be whether it is feasible to incorporate the future data produced by the Sikyon project into the current interactive image or whether separate tools will be required. The VRE model will hopefully provide the framework for these kinds of future developments.
© Internet Archaeology/Author(s)
URL: http://intarch.ac.uk/journal/issue23/5/6.1.html
Last updated: Tue Mar 25 2008