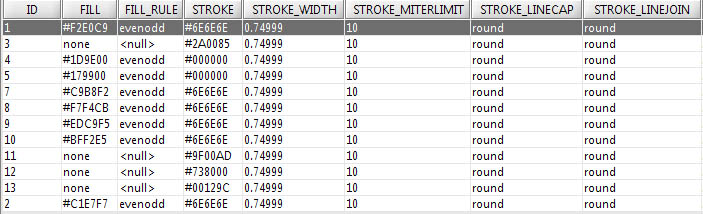
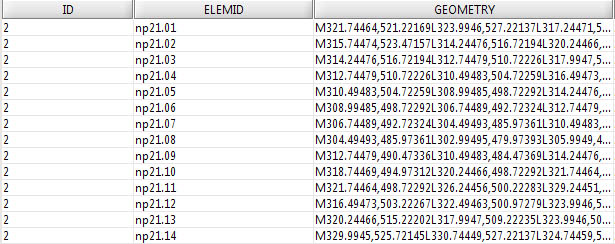
Figure 15a and 15b: Screenshots of the presentational and geometry tables which are fundamental to the recent development of the tool
As the Sikyon Project progresses, the interactive image developed will evolve and change according to the user needs. The current version of the interactive image is a prototype, so there is naturally only enough data to show that it works. As more data comes in, season after season, the practicality of using a static SVG document and XML file for the attribute data will be in question. To begin to tackle this, some further work was undertaken to address these potential future issues as well as exploit some of the inherent advantages of SVG.
It was decided that since SVG is a data-driven format, it would be best to store each individual SVG element and its presentational attributes in a relational database. In this way an interface could be designed which allowed the user to select which layers or information were of relevance and display only those. Since a user of this tool doesn't necessarily need to see every layer, there is no need to load an SVG image with every layer included, which would in turn lower bandwidth requirements and processor load. To accomplish this, the SVG document had to be dissected so that the element's geometry was in one table and its presentational attributes were in another table. Only the raw data was stored in the tables, so the characters which bound the data within the SVG elements (such as parentheses, less than and greater than signs) were removed. This process was mostly automated using find and replace functions, but occasionally manual intervention was necessary. The tables that had the elements' geometries had two id fields, a style id and an element id. The style id was a foreign key to the presentational attributes which was stored in a display table. Since most of the styles for a given layer are the same (i.e. stroke width of 10 and green fill for all tract elements), these data were normalised and input into a separate table. The element id was the unique id which related the element to its attribute data in the database or associated XML file. The display table contained the style id as well as presentational elements such as fill, stroke, stroke width, etc. For an example of the table, see Figure 15.
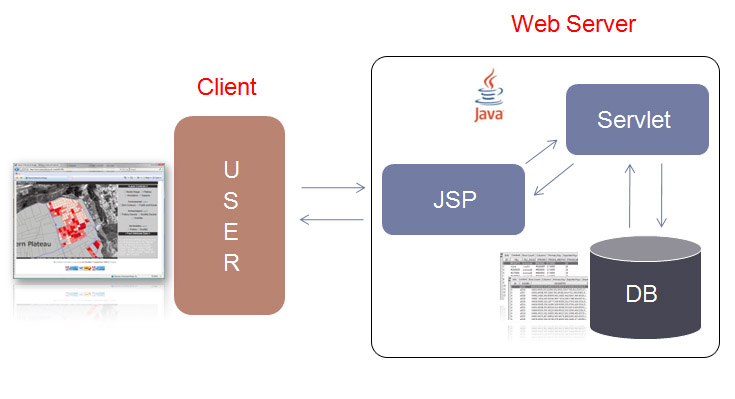
Now that the raw data of the SVG document was safely stored in a relational database, a method to reconstitute the document dynamically was needed. This was accomplished with a combination of JavaServer Pages (JSP) and a Java Servlet. Simply stated, a request was made from a form on the JSP page which was sent to the servlet. The servlet processed what the user actually wanted to see and using some basic logic sent off a request to the database for the appropriate data. The data were returned and the servlet reconstructed the raw data into a well-formed SVG document. This now allowed a user to check a box related to the layers of data they wanted to view, and then have an SVG image returned to them with those requested layers.
The potential of SVG managed in this manner is very promising and the above example is a simple yet powerful instance. Storing raw SVG data in a relational database allows developers to give users full control over what and how the SVG image is displayed. Each element's associated attribute data can also be stored in related tables in the database which adds richer data to the tool. Since the Sikyon Survey Project already maintains a relational database, it is unnecessary to export the data into an XML document. The XML document would quickly get to an unwieldy size, and managing or modifying it would become a greater task than is necessary. Managing the SVG data alongside the attribute data for each element in a relational database creates something similar to a content management system (CMS), which is used by many larger Web sites. The ultimate goal for the Sikyon tool would be to have a Web interface which allows users to dynamically create and interrogate SVG maps built from a relational database. It would also be useful for a user to be able to query the project database and have an SVG map output alongside the query results to provide context. This is all very possible, but is currently only a future aim of the Sikyon tool's developers.
© Internet Archaeology/Author(s)
URL: http://intarch.ac.uk/journal/issue23/5/6.2.html
Last updated: Tue Mar 25 2008