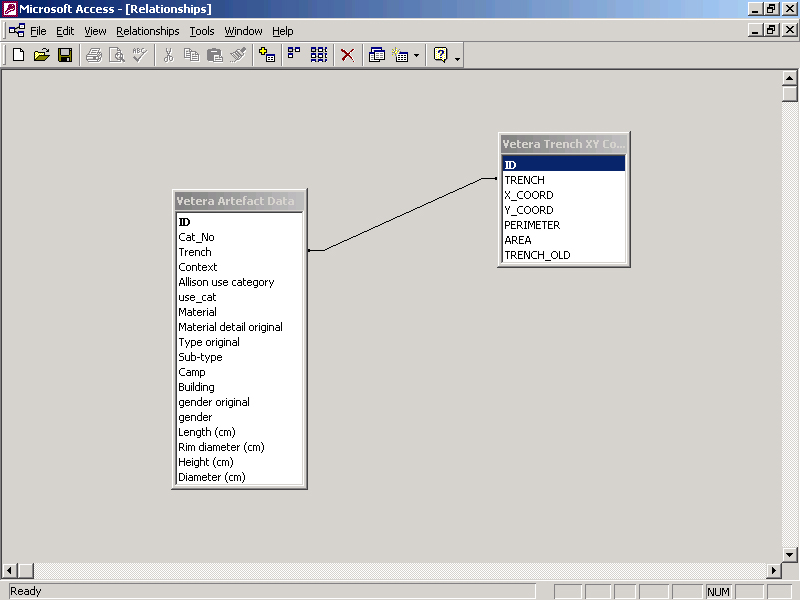
Figure 17: Access database relationships page exemplifying how the relational database was structured
Data in the electronic catalogue produced using the process explained in Section 7.1 could not be used directly to plot artefact distributions in ArcGIS. This catalogue stored data by catalogue entry. ArcGIS, with its limited database capacity, was unable to generate quantitative summaries of the data by excavation provenance, in this case the excavation trench or, more specifically, the XY coordinates of the trench. This was done by importing the artefact catalogue into a relational database programme and using its query function. Microsoft Access was used in the project (Figure 17), but, in theory, any commonly available relational databases could be used.
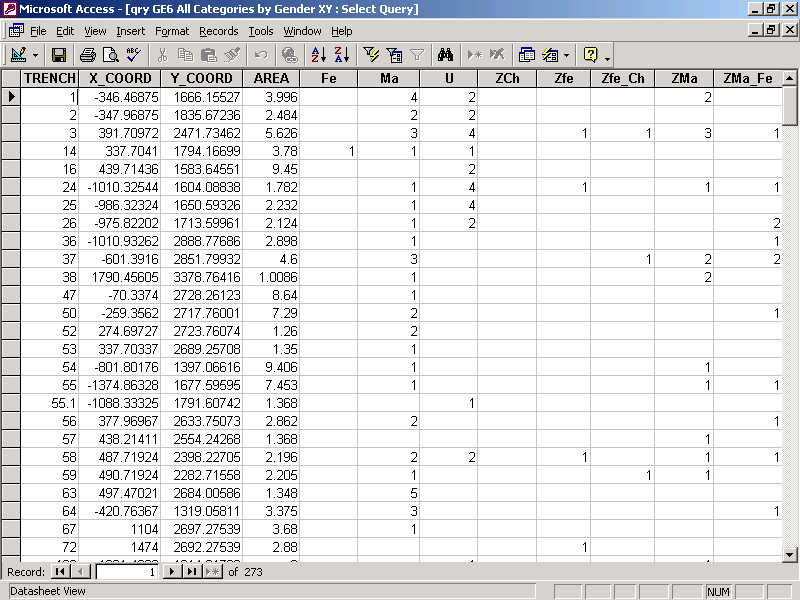
In the first instance, Access cross-tab queries were used to generate, from the main electronic catalogue file, a quantitative summary of the number of artefacts from any given interpretative category found in each excavation trench. The query counted the number of occurrences of each class (e.g. number of male, female artefacts) within each specified classification field (e.g. gender), within each trench (Figure 18).
Figure 18: Access query output showing the summaries by trench and gender categories with null values (i.e. empty cells).
Data was plotted in the GIS maps using the arbitrary XY coordinates for each trench produced using an ArcGIS script (see section 6.2). Unprovenanced artefacts were given an arbitrary provenance code and XY coordinates so that they plotted outside the south-west area of the fortress. XY coordinates were not added to each individual catalogue entry, but added to the summary data for each trench and data point from a separate data table in Access using a query. It should be noted that this process was necessary for Vetera I, whose site plan and artefact catalogues contained no XY coordinates, but was unnecessary for several artefact catalogues used in the Engendering Roman Spaces project which have their own XY coordinates systems (e.g. Ellingen - Zanier 1992).
The queries summarising the quantity of each class of artefacts in any excavation trench formed the basis of the plots used in ArcGIS. Incorporating the tables into ArcGIS was, however, not a straightforward process.
Several options were tested, including linking directly to the queries in Access using the Microsoft OLE DB provider for ODBC driver in ArcGIS. This is potentially a useful means of adding tabular data to ArcGIS but was rejected in this case as much of the data became unplottable, especially in pie-charts, perhaps the most useful chart style in ArcGIS for this type of data. The reason was simple: the Access queries generated null values in the query tables when no occurrences of a specified artefact class were found in a data row. ArcGIS 8.3, which we used for the analysis of the Vetera data, would ignore any row, and thereby excavation trench, containing null values in its pie-chart plots, effectively excluding most of the data in many queries. The Access 'fix' for this problem (Nz function, which replaces null values with zeros) is not a standard SQL command. It therefore could not be read by ArcGIS using the OLE DB for ODBC driver, and so would have rendered tables containing it largely useless.
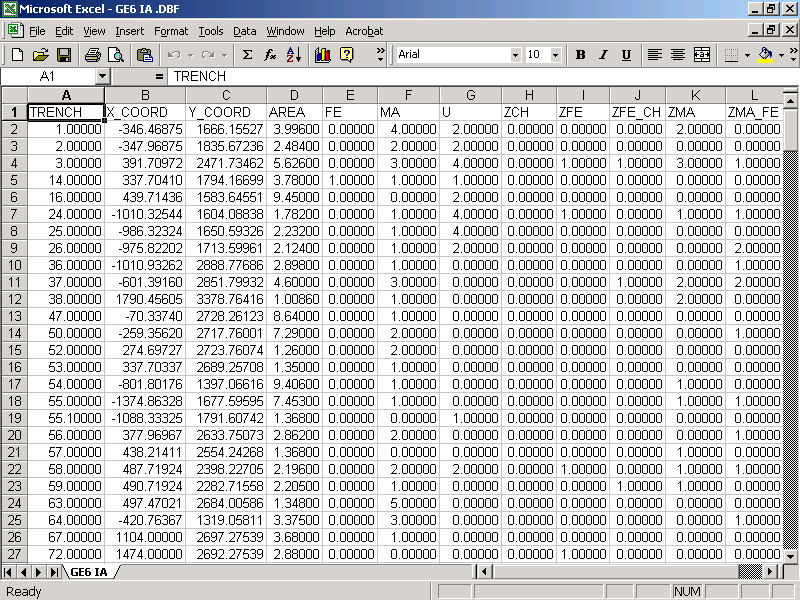
A further problem was that directly linking to Access queries prevented the addition of calculated fields. Such fields are useful as a means of rapidly adding extra information to maps without going back to the original data. The solution to these problems was either to use Dbase IV files, exported from Access and separately imported to ArcGIS after replacing the nulls with zeros manually, or to use the ArcCatalog component of ArcGIS, which performed the operation automatically (Figure 19). An identical process was used to prepare data tables for Arcview 3.2, which also required SQL consistency.
Figure 19: .dbf table of the summary data with the null values in the gender categories filled with zeros
SQL consistency and the insertion of null values into Access queries caused major problems in the conversion of the electronic catalogue into a form that was readable and plottable in ArcGIS. The solution that has been used to date is robust and relatively simple, although suffers from the production of numerous tables in Dbase IV files. A well-structured file logging and storage system has minimised the potential confusion caused by production of multiple files. While use of the DBase IV files was not as elegant as direct connection to Access, it provided a flexible and rapid 'fix' to this technical problem. Another 'fix' to the null value problem would have been to totally re-design the catalogue database totally as a series of fully normalised related tables. While this was an elegant solution to the problem, the potential extra benefits of that course were not thought to be worth the considerable time investment it would have taken to reformat the Vetera catalogue of some 11,000 entries with 11 major category fields.
Since completing the analysis for Vetera I, however, we have been using ArcGIS 9 for other military sites and have found that this newer version can resolve some of these difficulties with null value translations.
© Internet Archaeology
URL: http://intarch.ac.uk/journal/issue17/4/7.2.html
Last updated: Mon Apr 4 2005