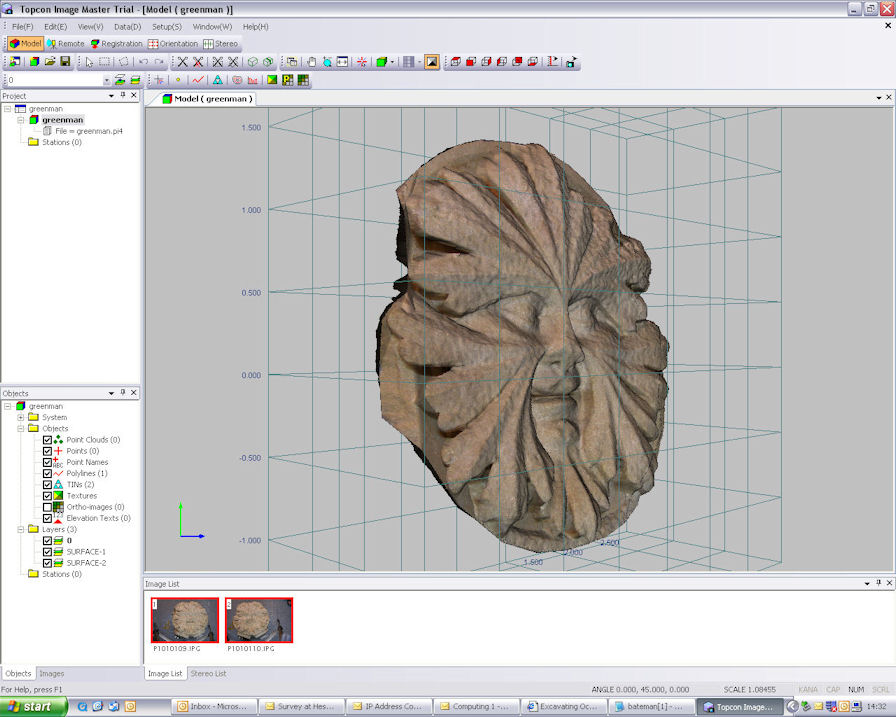
Figure 1: The ImageMaster interface. The subject is a 13th-century roof boss from the abbey church of Zaraka, Greece, carved with a green man design
Dept. Archaeology, University of York. Email: awm106@york.ac.uk
Cite this as: Masinton, A. 2008 Review of ImageMaster Close-Range Photogrammetry Software by Topcon, Internet Archaeology 25. https://doi.org/10.11141/ia.25.6
UK availability and pricing from TerraDat Geomatics
Minimum system requirements: 32 bit Windows 98, ME, 2000, XP; Pentium 4 2.0 GHz; 512Mb RAM; minimum 5 Megapixel digital camera.
Introduction | ImageMaster | Caveats | Workflow | Summary and Conclusions
With the release of Photosynth, Microsoft has taken the quest for the 'holy grail' of close-range photogrammetry one step closer to its goal while also placing that goal in the hands of non-specialists. That holy grail is the acquisition of three-dimensional measurements from photographs taken by different cameras for which no data are known in a workflow that is intuitive and simple to learn. However, the developers of Photosynth seem to be unaware that they have come so close to reaching this goal. Their aim for Photosynth seems to have been to develop a web-based picture-viewing application that delivers a basic level of immersive experience. When asked whether they would make an exporter for the point clouds the application produces (so that the clouds can be integrated into other applications), an official rep replied, "Sure, it's a very interesting and natural idea to generate mesh from point cloud and do texture mapping. But this release is to show us a new way to orgnize (sic) their (sic) photos (spatially!), while still preserving the originality of photos" (Hou 2008).
The quest continues. To archaeologists, the potential benefits of a tool that can extract relatively accurate measurements from photographs taken by non-metric cameras are enormous. Subjects featuring complex relief and irregularity - skeletons, for example - would no longer have to be subjected to labour-intensive on-site recording and drawing. Such features could be photographed and then moved quickly, the measuring and drawing occurring later, during post-excavation. Buildings and landscape archaeologists have long used photogrammetry in the recording and analysis of their subjects. However, the considerable expense, expertise and specialised equipment required to produce photogrammetric plots has limited its routine use in poorly funded and smaller projects. If the expense, expertise and equipment could be reduced, then photogrammetry could potentially become as common an archaeological tool as the camera and tape measure.
Some steps have already been taken to bridge the gap between professional-grade photogrammetry and non-specialists. Two web-based tools are available: Arpenteur and Arc3D, both directed at the recording and conservation of buildings. Arpenteur has been available since 1998. It is a joint project between MAP-GAMSAU CNRS laboratory at the School of Architecture at Marseille, and MAP-PAGE based at Strasbourg. Its goal is to provide a suite of tools for architectural close-range photogrammetry for use in archaeological research. The learning curve is steep; cameras must be calibrated with other proprietary software and outside tools are needed to visualise the data (Arpenteur 2008). Arc3D is a newer service, launched in 2006 as an EPOCH project involving a number of European institutions. It stands between Arpenteur and Photosynth, creating dense three-dimensional meshes with phototextures based on a series of photographs taken with uncalibrated cameras. Simply register, upload photos using their uploader and wait for the results. The system frequently rejects photograph series and the secret to what constitutes a 'good' series of photographs is somewhat difficult to determine, despite a friendly tutorial. Either the system works or it does not. Results, when they are achieved, vary greatly in quality. A set of sample data is available from the Arc3D website and these are useful in evaluating whether Arc3D is a suitable tool for a specific project (Arc 3D 2008).
The negative side of all of these tools is that they are web-based. If photogrammetric data is needed on site then a solution based entirely on a local computer is required. Web-based services such as these are also unreliable in that they can (and do) disappear without warning. Project funding or interest at the home base may simply evaporate, resulting in the demise of the service. Also, support for users is minimal. Finally, the data produced are not always interoperable with other applications. The most interoperable of the three is Arc3D because its file format is readable by the opensource MeshLab (MeshLab 2008), which is capable of converting the data to a variety of de facto standards which are widely accepted by a variety of other applications.
Relatively inexpensive (about £800) local machine solutions have been available for many years. The standard for close-range photogrammetry is PhotoModeler by Eos Systems (Eos Systems 2008). There is also its near-twin ImageModeler now owned by AutoDesk (AutoDesk 2008). Both packages use series of photographs taken by consumer-grade digital cameras to extract information about the three-dimensional space recorded by the camera. The user identifies points within those photographs to build up simple models of features of interest. While labour-intensive, these packages have made great strides in automation and streamlining of workflow while also becoming more and more robust. In some instances, no information about the camera is needed in order to achieve a successful result. While ideal for subjects with relatively simple geometry, little relief and that are easily photographed in their entirety, these packages are not ideal for recording more complex objects to a high degree of precision. Organic or extremely irregular surfaces are not suitable for measurement by these programs, nor are extremely irregular surfaces or subjects which are only partially visible or are difficult to photograph from different angles. (It should be noted that Photomodeler has recently released Photomodeler Scanner, which automatically creates dense point clouds and detailed surface meshes based on stereo pairs (Eos Systems 2008).)

Figure 1: The ImageMaster interface. The subject is a 13th-century roof boss from the abbey church of Zaraka, Greece, carved with a green man design
One close-range photogrammetry solution that stands somewhere between high-level photogrammetry with metric cameras, laser scanning and Photomodeler is ImageMaster (formerly PI-3000) from Topcon and distributed in the UK by TerraDat Geomatics. ImageMaster is close-range photogrammetry software using pairs of images taken with consumer-grade digital cameras. If combined with measured control data, the software is capable of results accurate to within 2-4mm with a focal length of 1.5 metres (English Heritage 2007, 28-29). It generates true orthophotos as well as three-dimensional, phototextured surface meshes containing tens of thousands of individually measured points. The generation of the surface mesh is done automatically, after initial setup and orientation. It also allows the user to trace features with 3-D polylines laid down directly on top of the surfaces in the photographs, which can then be exported to CAD. It also has the capability of working with point cloud data from scanning devices. It can generate a surface mesh from points as well as perform alignment of multiple meshes.
Animation showing a phototextured mesh created by ImageMaster. The mesh is a model based on a single image pair of the west door of York Minster. Click and drag the object to rotate it.
The software itself is easy to use, if not exactly user-friendly, with a clearly linear workflow and capable of moving from images to measured surfaces in as little as fifteen minutes. Because of the low-cost cameras that can be used, the high potential accuracy of results, and ease of use of the software, ImageMaster can be a substitute for more expensive laser scanning and structured light technologies. Relative to the cost of scanning equipment, the price of ImageMaster (£8,000 per license) is more affordable. Because it is a software-based solution requiring minimal hardware in terms of both computing and cameras, it is much more portable and versatile than scanning. Finally, since it is image-based, the three-dimensional data produced by the software is automatically photo-textured, something that many scanning solutions continue to struggle with.
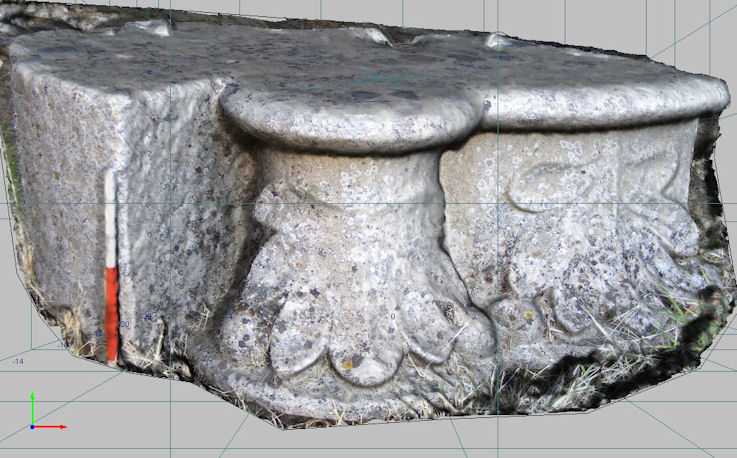
Figure 2: A mesh with phototexturing. The subject is a 13th-century capital from the abbey church of Zaraka, Greece
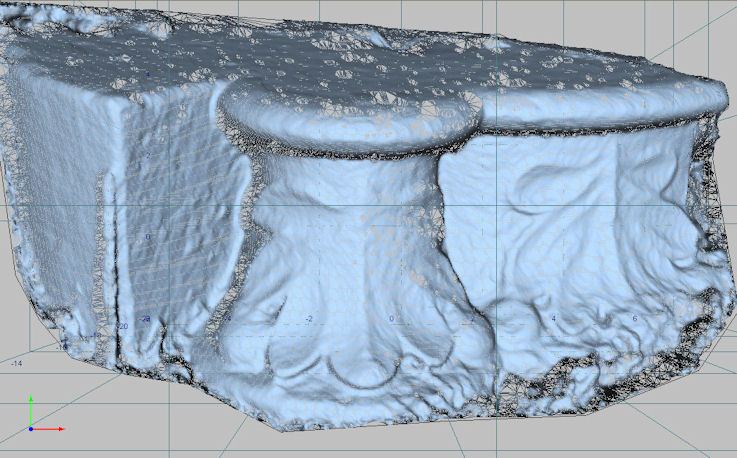
Figure 3: The same mesh as Figure 2 without phototexturing
The software is capable of producing high-quality surface meshes of subjects ranging from landscapes to small artefacts, depending on the quality of control in the initial acquisition of data, and the quality of photographs used. There are numerous case-studies available on the TerraDat website (TerraDat 2008a). An in-depth, independent evaluation of the software using prehistoric rock art as a subject has been conducted by English Heritage (Bryan 2006). ImageMaster is developed for use in conjunction with Topcon's own surveying equipment and the primary audience is industrial surveyors. However, the archaeological applications are numerous. They fall into two groups, depending on the desired result: measurement and 3-D modelling.
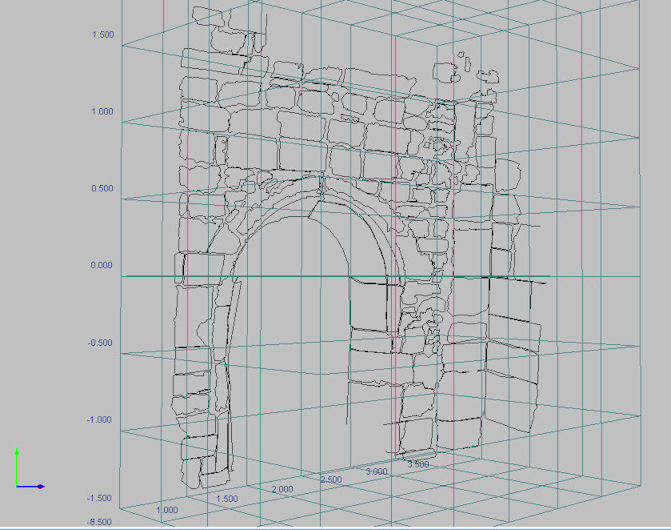
Figure 4: Stone-by-stone digitisation with 3-D polylines laid directly upon the subject's surface. South door of St Martin-cum-Gregory, Micklegate, York
ImageMaster is first and foremost a measurement tool. For irregular surfaces with a high degree of organic geometric complexity, such as skeletal remains or features in trenches, the software offers considerable advantages. Its capability of laying down 3-D polylines on top of complex surfaces allows extremely detailed drawings to be created in 3-D off site. ImageMaster also generates true orthophotos that allow the integration of complex data into the conventional recording workflow. For archaeological applications requiring 3-D models of complex surfaces - for visualisation, conservation, reconstruction and public presentation - ImageMaster is something of a dream come true. It is ideal for modelling surfaces with complex relief, such as architectural sculpture or artefacts. The surfaces the software automatically generates can be exported with their phototextures to other 3-D software (although with some difficulty, as described elsewhere in this review). To generate such models, especially where high degrees of precision are not a top priority, time on-site or with the subject is minimal while detailed models are generated quickly and with a minimum of user attention required. Of course, making those models efficient and usable elsewhere is still a labour-intensive process.
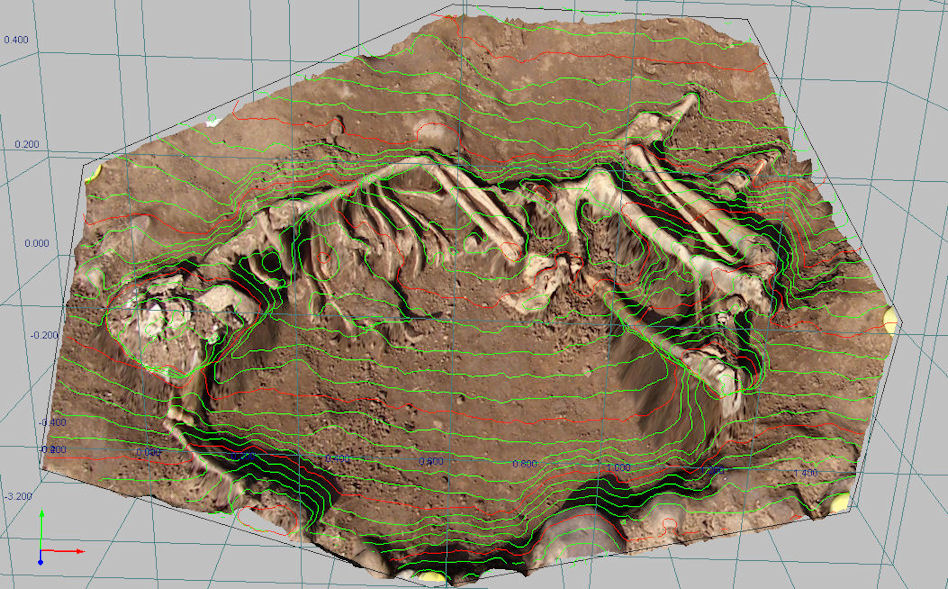
Figure 5: Skeleton
in situ
with countour lines overlaid
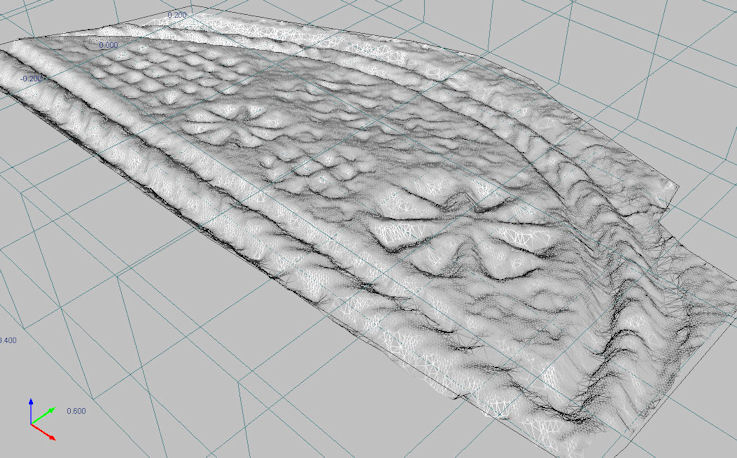
Figure 6: Oblique view of a mesh generated over a subject with complex low relief. Tympanum, Braithwell church, Rotherham
With all of these advantages to recommend it, ImageMaster would seem like a panacea for survey projects requiring measurement of geometrically complex subjects. However, there are some caveats. While in theory it is a tool suitable for three-dimensional measurement of everything from landscapes to grains of sand, in practice it is better suited to some subjects and not to others. There are limitations of subject. Subjects lacking surface contrast or geometric complexity are difficult for the software to 'see' since it relies on computer vision techniques to 'understand' the space represented by the stereo pair, and these techniques rely on contrast. Surfaces that are more or less planar and smooth have a tendency to 'bubble' in ImageMaster. The subject may also be too large. The further away the camera is from a subject, the poorer the accuracy of the results. Therefore, the camera would have to be quite far from a very large subject, such as a cathedral, in order to fit the entire subject within both images of the pair. This means that the subject occupies too few pixels for the software to produce a useful 3-D solution. Related to this are problems of hardware and software. A large subject can be measured using a series of image pairs. However, the more pairs that are required, the more system resources the software needs in order to process the increased amount of data, the slower the system runs and, eventually, grinds to a halt. Also, the 3-D meshes produced by using large series of pairs become unwieldy for many computers to display (especially multi-core machines without a dedicated graphics processor, which is an increasing standard).
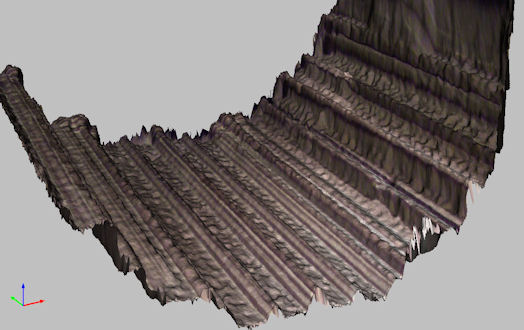
Figure 7: Detail of a mesh where the surface has 'bubbled'
The subject of overlapping stereo pairs also leads to another limitation: cameras and photography. ImageMaster has not achieved the Holy Grail of 3-D surface reconstruction from images taken with uncalibrated cameras. That is, ImageMaster must know the lens and other physical properties unique to every camera and every lens in order to produce accurate measurements (or any measurements at all). Therefore, images produced by unknown cameras cannot be used (so the possibility of producing measurements from Victorian stereo images, for example, or from aerial photography for which camera parameters are unknown, is remote). Fortunately, there is a calibration program included that makes the process of calibrating the camera a simple one. However, the camera itself must be capable of 'locking down' its focus and zoom. The calibrated settings for all images in the series must be consistent. For some point-and-shoot cameras this is simply not possible. The skill of taking suitable pictures is also surprisingly difficult to learn, which means that sometimes a subject must be re-photographed if ImageMaster rejects the first set of images taken because of poor correspondence between images.
Finally, there are limitations of the software itself. Sometimes, despite having a suitable subject, a calibrated camera, and carefully composed images, ImageMaster will simply fail to produce a result. The reasons for this failure are frequently difficult or impossible to understand because the feedback from the software is often cryptic. If it works, it works.
The ImageMaster workflow is linear but not inflexible. At any stage in the process one can go back to a previous step and make adjustments. New data can be added and old data can be removed at any time. However, when setting up a new project the workflow is generally: set up control (optional) --> take pictures --> import images --> identify pairs --> import/identify control points (if these have been measured) --> identify tie points to link pairs --> identify pass points --> generate true stereo images --> define breaklines and polylines --> generate surface measurement --> export for integration into other software for further use. This may seem like a long process but in practice it can be quite quick. The great benefit of this workflow is that the software is designed to (almost) intuitively lead the user through these steps. Non-specialist, non-archaeologist community volunteers have been successfully and quickly trained to use the software to a high level of productivity (Bryan 2006). It has also been successfully integrated into undergraduate projects and even projects where college students are involved. This ease of use and simplicity of workflow is one of the major advantages of this software.
Establishing metric and spatial control in any photogrammetry project is important. In ImageMaster projects, however, it is not always necessary. The software is capable of producing excellent results without any control points. In these cases, the results have arbitrary scale and rotation. They are highly accurate within themselves but they have no relationship to the wider world. This can always be added later, of course, and such results are frequently adequate. However, if the subject requires numerous stereo pairs, is part of a broader project such as an excavation, or its spatial location is important, then establishing control is strongly recommended. This is usually done by measuring clearly and precisely identifiable points, usually survey targets on or near the subject, using a TST (Total Station Theodolite). These measured points should appear in the first and last image pairs, and it is helpful if they appear in other pairs as well, if there are more than two. These will greatly assist the software in understanding the space in the photographs, and they will also increase the accuracy of results. The results will also be scaled and rotated correctly so that they will appear in the correct location and at the correct size and orientation relative to the rest of the site grid. If the correct size of the subject is all that is needed, then a scale bar or other suitable scale reference can be placed near the subject and included in the photos.
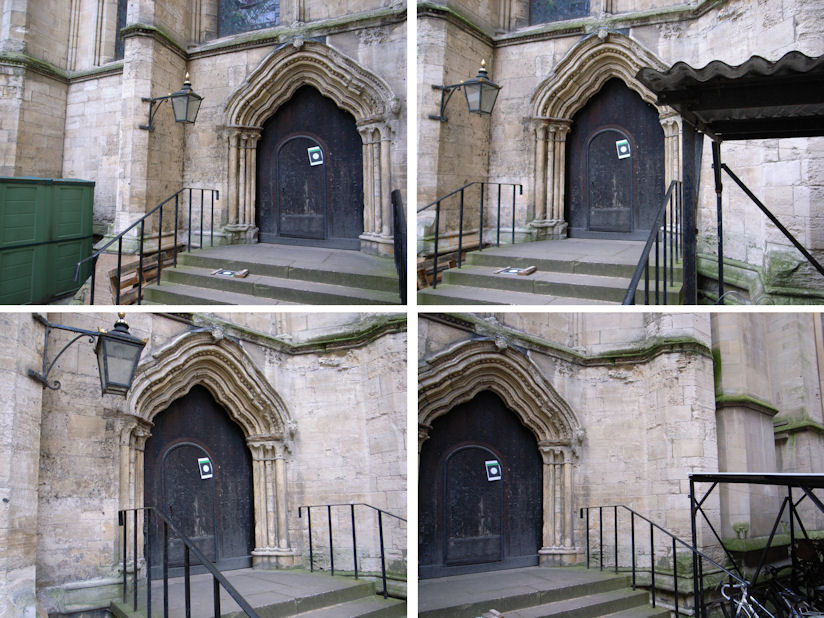
Figure 8: The four image pairs used for measuring the north transept door of York Minster. Note the survey target in the centre of the door
Taking useful stereo pairs is something of an art and the best way to take good pictures is to practise. A good rule of thumb is that the separation between left and right images should be about one-third the distance between the camera and the subject. So, if you are three metres from your subject, you would move one metre to the right after taking the first picture. Pictures should be as sharp as possible and the focus and zoom should not change. The plane of the picture should also not change. If you imagine a plane perpendicular to the body of the camera, both left and right images should be taken on the same plane. That is, you should not rotate the camera left or right between shots in order to get more of the subject in the frame. It is surprising how hard it is to remember that these pictures are for measurement and not valuable for their aesthetics. Finally, the subject should be well-lit but not raking, the lighting being as even as possible and not changing between pictures, and there should be as few obstacles (such as tree branches) as possible between the camera and the subject.
In ImageMaster the process of importing images is called image registration. This simply means that you browse to the location of the images and select those images you wish to add to the project. During image registration, you must also load the appropriate camera calibration file. Once the images are imported, stereo pairs must be registered. This is done by simply clicking on the images in the correct sequence. The first click is the left image of the first pair, the second is the right image of the first pair/left image of the next pair if you are working with a sequence of pairs, and so on. The 'register stereo pair' icon is clicked and the pairs appear in the hierarchy at the left of the screen.
The orientation process is the stage where the user gives ImageMaster the information it needs to define the space represented by the images. Survey data can be imported and matched with visible points in the images. Tie and pass points are common points in each image. These are identified using the 'Measure image coordinates' dialogue box. You select the stereo pairs you would like to work with, then enter a name for the first point, and simply click on the position of this point in each image, then select 'Measure' from the dialogue box. The process is the same for tie points, which tie together stereo pairs, or pass points, which are simply common points visible in both images. ImageMaster has automatic centre and corner detection which can greatly increase the accuracy of the final results. It also has an automatic point-matching feature that will attempt to match a point the user identifies in the first image with the same point in other images. Sometimes these features work and other times they fail. Whether done by the software or by the user, however, the points need to be identified as precisely as possible.
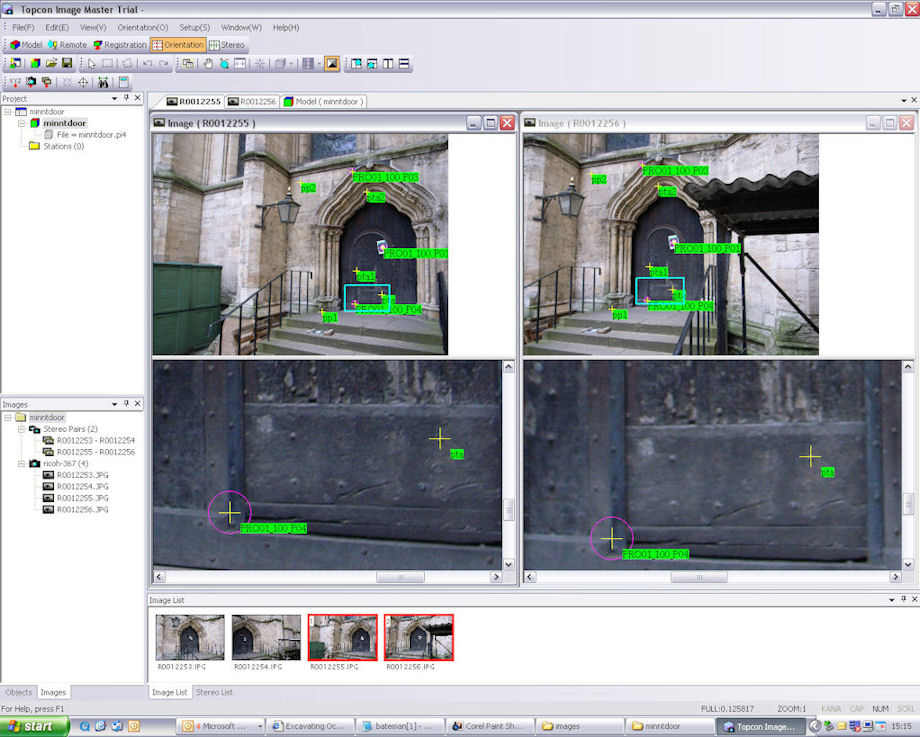
Figure 9: The ImageMaster orientation screen
If no control points were measured but the distance between two points is precisely known (such as two ends of a scale bar), then this measurement can be given to the software in the 'Measure image coordinates' dialogue after the 'Calculate' button is pressed once all points have been identified. Including at least one known measurement greatly increases the accuracy of the result and also helps the software to understand the space.
Once a calculation is made, the results will be returned in a table that appears in a new window. The most important columns, however, are 'Judge' and 'Y-Parallax'. Judge reports on whether the calculation of each stereo pair was successful or not. 'OK' means that it was, otherwise the cell will be blank. Y-Parallax is a measure of the difference in perpendicular distances between the plane of the camera and a common point in both images. A value under 1 is deemed successful, although the smaller the value the better the orientation. If a stereo pair has failed, then it is possible to change or add points and recalculate. Sometimes, however, a pair will simply not work and must be discarded.
If a calculation is successful, then the user can proceed to generate a true stereo pair and begin to take measurements. A stereo pair is generated automatically by moving to the stereo screen after images have been registered. This results in a calculation that can take up to several minutes. When the computer is finished the user will be presented with the two images of the pair more-or-less distorted displayed side by side on the screen. The cursor will be dual green cross-hairs, one for each image in the pair, which correspond to the same point in each. At this point the software understands the space in the images and is ready to begin measurements. This screen behaves like a simple CAD system. Layers can be created and options for colour and visibility can be set. Points, line, and polylines can be laid down on top of the surfaces in the images simply by clicking on them in the left image. Sometimes the software requires refinement of its understanding of the space. This is needed whenever the cross-hair on the right image does not correspond to the same location as the cross-hair in the left image. To adjust the right cross-hair, simply scroll the mouse wheel. Because this is frequently required, this is the most time-consuming part of the workflow and can take hours or even days to complete if something as detailed as a stone-by-stone tracing is attempted.
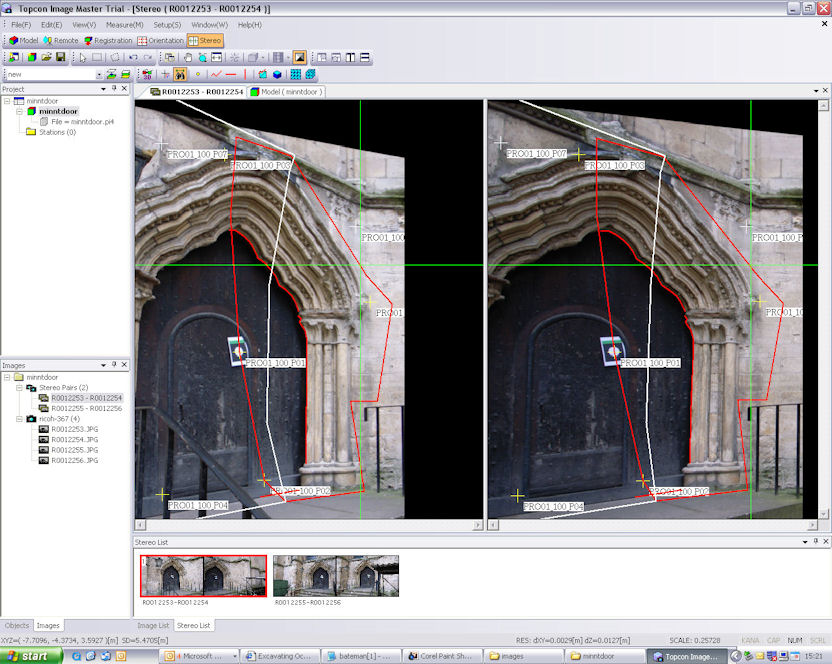
Figure 10: The ImageMaster stereo screen
Breaklines, portions of the image where there is a sharp corner or where part of one object covers part of another behind it, can be identfied by polylines. Areas where the user wishes to generate a 3-D surface can be identified by closed polylines. All polylines within or crossing into this boundary will be considered breaklines when the surface measurement is generated. Individual planes or surfaces can be defined by points or polylines as well. This is useful where there are flat regions in the subject, such as window glass, which the software might otherwise have a difficult time measuring. It can also be used to simplify the geometry of a subject to reduce it to its most efficient and representative form. For example, this might be useful for a house where all that is required is the outline of the principal geometry in three dimensions, but where the surface texture of the walls and materials that make up the house are not important. If ImageMaster were not given this information, then it would attempt to generate a mesh to represent the house. The mesh would be composed of many thousands of points, which in all probability would not be terribly useful nor particularly convenient to work with.
Finally, a closed polyline can be selected and the area within this can be measured automatically as a mesh composed of 3-D points. The 'Auto surface measurement' button begins this process, which is automatic and can take up to an hour to complete if the density of the mesh is fine and the computer hardware is slow. The density of the mesh to be generated can be set by the user. In projects where control points were measured, or where the distance between two points was defined, the mesh density is based on real-world dimensions. Otherwise, an arbitrary value can be defined. If the resulting mesh is too coarse, then a new one can be generated based on a new density value.
Multiple meshes can be created from multiple stereo pairs. They can be viewed separately or together in the 3-D viewer by turning on or off the layers for each mesh. A variety of viewing options is possible. By default the mesh is shown fully photo-textured and shaded according to default lighting within the software. The mesh without the texture can be viewed and the shading and lighting can be altered. The mesh can be rotated, panned and zoomed by using the mouse. Contour plots at user-defined intervals can be created and cross-sections can also be generated.
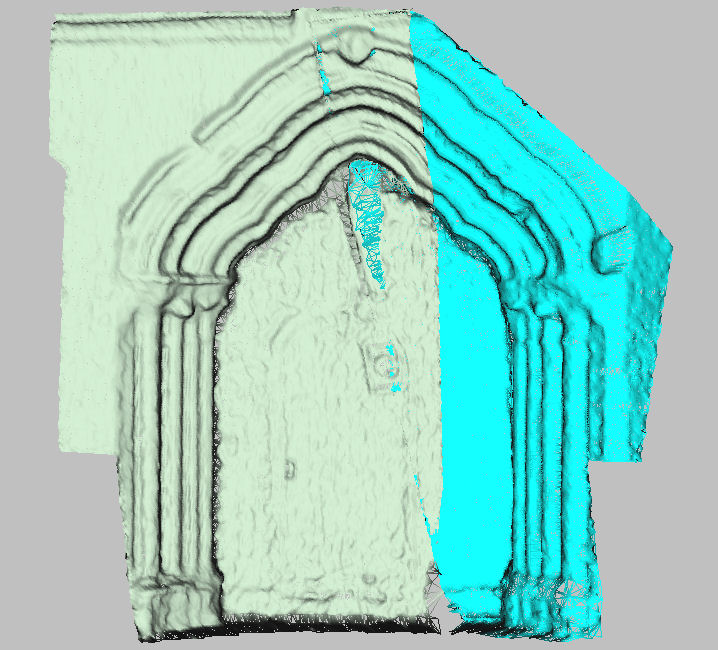
Figure 11: Two meshes joined into one model
The final stage in an ImageMaster project is exporting the results for use in other applications. This is the weakest aspect of the software. The most important export option is the orthoimage. ImageMaster is capable of generating orthoimages where all planes of geometry visible in an image are rectified. While this is a 2-D image, it can be imported into any standard CAD package and traced with assurance of metric accuracy for all features. This is especially important in map creation but also in producing metrically accurate line drawings of subjects with complex surfaces, such as sculpture, or organic materials, such as bones. ImageMaster generates the orthoimage based on the rotation of the object set by the user. This is a tricky process and is best accomplished by using the option within the software to align the object to two points that define a straight line.
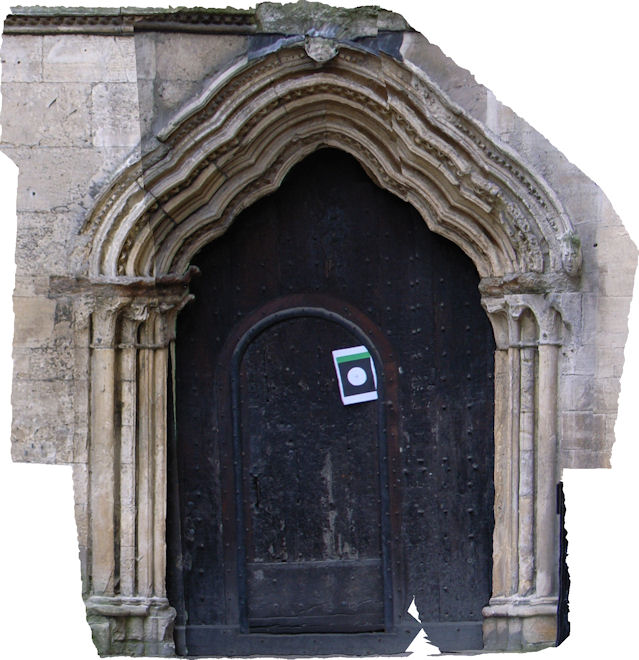
Figure 12: The final orthophoto
Three-dimensional data may also be exported. Points, lines, polylines and meshes in the form of TINs (Triangulated Irregular Networks) may be exported to dxf format, making them suitable for CAD import. The 3-D mesh can also be exported as a csv file of xyz point data or as a VRML (Virtual Reality Markup Language) file. The phototexturing is available only for VRML export. While the VRML file is fairly efficient, this is a dying format and many CAD and 3-D packages cannot read it and fewer still can convert it.
A VRML file generated by ImageMaster (download Cortona 3D viewer
here)
Topcon gave their close-range photogrammetry software a makeover when they changed its name from PI-3000 to ImageMaster. They made it look and feel much more like a present-day Windows software package than its previous incarnations. They also added support for laser scan data, including multiple point cloud alignment and registration, displaying multiple models at the same time, and working with the giant datasets that various scanning techniques generate. However, at its core, it is still the old PI-3000 with very few of its often bewildering quirks ironed out. The English-language version of the software still carries a heavy accent. Although spelling mistakes in the main menus have been corrected, many of the error messages are incomprehensible. The manual is worse. While it contains numerous helpful diagrams, the text itself is so poorly translated as to render it useless (this despite my personal offer to write a more comprehensible manual in exchange for a license). Fortunately, TerraDat Geomatics, the UK reseller, provides helpful tutorial material and resources as well as a day of face-to-face training. They also offer active ongoing support. There is also a small user community hosted by TerraDat, although registration is required to view discussions (TerraDat 2008b).
More frustrating, however, is ImageMaster's limited export capabilities for textured meshes. This is its single greatest drawback. Like the developers of Photosynth, Topcon does not appear to have understood the breadth of the applicability of its software. This is evident in its almost non-existent marketing of the software. It is also evident in the limited export options within the software itself. ImageMaster can create orthophotos, which are useful for creating two-dimensional traces of complex subjects. These export in standard image formats, which make them easy to use in other applications. DXF export is also fairly complete, allowing 3-D vector data, including meshes, to be used elsewhere. However, if you want to work with the meshes it creates with the textures in place then you are extremely limited. The limitation of VRML as the only file format that allows for export of meshes with mapped textures is difficult to overcome. This weakens ImageMaster as a tool for modelling and visualisation.
In spite of this, the benefits of ImageMaster are many. While the nearly £8000 price tag for a single license is high, its ability to use photographs from non-metric cameras on low-spec computers means that few other costs are incurred in bringing good-quality photogrammetry to the desktop. Compared to the cost of laser scanning and high-grade photogrammetry work-stations, the cost of ImageMaster is extremely attractive. Basic operation of the software itself is easy to learn and also to teach, meaning that non-specialists can begin working with photogrammetry rapidly. It is capable of producing two- and three-dimensional data, which means the software functions well within the more conventional world of orthophotos and 3-D polyline CAD plots but also becomes an extremely useful tool for high-level three-dimensional visualisation. The quality and accuracy of data produced are comparable with laser scanning while the process of acquiring the base data in the field is much simpler and more portable. While not a catch-all automatic measuring solution, it does offer a clear way forward, balancing cost, accuracy, efficiency and usability. It is a tool that well deserves a place within the archaeological field toolkit.
Arc3D, 2008 Arc 3D Webservice. http://homes.esat.kuleuven.be/~visit3d/webservice/v2/links.php Accessed: 28 September 2008.
Arpenteur, 2008 Arpenteur: ARchitectural PhotogrammEtric Network Tool for Education and Research. http://arpenteur.net Accessed: 28 September 2008.
AutoDesk, 2008 3D virtual tours software, photo-realistic 3D modeling software, photogrammetry software - Autodesk VTour and ImageModeler. http://imagemodeler.realviz.com Accessed: 28 September 2008.
Bryan, P., 2006 The Northumberland and Durham Rock Art Project. http://www.ceg.ncl.ac.uk/heritage3d/downloads/workshop2006/bryan2.pdf Accessed: 28 September 2008.
English Heritage, 2007 3D Laser Scanning for Heritage. Swindon.
Eos Systems Inc., 2008 PhotoModeler - Close-range Photogrammetry Software . http://www.photomodeler.com/index.htm Accessed: 28 September 2008.
Hou, D., 2008 'Recreate a 3d scene with textures', 28 August 2008. Online posting. Get Satisfaction. http://getsatisfaction.com/livelabs/topics/recreate_a_3d_scene_with_textures Accessed: 28 September 2008.
MeshLab, 2008 MeshLab. http://meshlab.sourceforge.net Accessed: 28 September 2008.
TerraDat Geomatics, 2008a TerraDat Geomatics - 3D Photogrammetry Software Sales and Service . http://www.terrageomatics.com Accessed: 28 September 2008.
TerraDat Geomatics, 2008b New Photogrammetry User Forum. http://www.terrageomatics.com/pidiscuss/categories.php Accessed: 28 September 2008.
Internet Archaeology is an open access journal based in the Department of Archaeology, University of York. Except where otherwise noted, content from this work may be used under the terms of the Creative Commons Attribution 3.0 (CC BY) Unported licence, which permits unrestricted use, distribution, and reproduction in any medium, provided that attribution to the author(s), the title of the work, the Internet Archaeology journal and the relevant URL/DOI are given.
Terms and Conditions | Legal Statements | Privacy Policy | Cookies Policy | Citing Internet Archaeology
Internet Archaeology content is preserved for the long term with the Archaeology Data Service. Help sustain and support open access publication by donating to our Open Access Archaeology Fund.