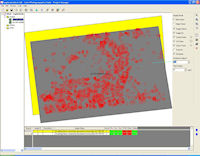
Figure 55: Automated DEM extraction from stereo CORONA images in ERDAS Leica Photogrammetry Suite
High-resolution topographic data in the form of digital elevation models (DEMs) are valuable in archaeological research. While DEMs are most commonly used as a simple base-map in GIS applications, they can also be employed as powerful datasets in their own right. DEMs have been employed in automated detection of mounded archaeological sites in eastern Syria (Menze et al. 2006), mapping ancient canal levees in southern Mesopotamia (Hritz and Wilkinson 2006; Gasche and Tanret 1998), and modelling of hydrological patterns and ancient irrigation potential in Yemen (Harrower 2010). Despite the potential of such studies, high-resolution topographic data are simply unavailable for most areas of the Near East, where the best available dataset is still SRTM Level 1 data, with a nominal ground resolution of 90m. A somewhat better 30m resolution DEM has now been generated via stereo ASTER imagery, but even at this resolution, most sites and cultural features would not be apparent, and filtering methods designed to improve the generation of the ASTER DEM seem to have erased many mounded sites. The kinds of extremely high-resolution LiDAR-based DEMs that have been used so effectively for archaeological applications in Europe (e.g. Devereux et al. 2005; Bewley et al. 2005) and the Americas (e.g. Chase et al. 2011) would be both cost-prohibitive and legally problematic to collect in most areas of the Near East. CORONA imagery, which can produce DEMs of 10m spatial resolution or better, thus offers a very promising and powerful tool for archaeological and other research in the region. Moreover, CORONA-based DEMs are historic, thereby documenting the topography of a landscape that has been changed, sometimes dramatically, since the 1960s. It enables us to create high-resolution elevation models of areas flooded by reservoirs or flattened by irrigation projects, and can even be used to map the topography of individual sites that have been damaged by earthmoving or other forces (Casana and Cothren 2008).
Since the early 20th century, stereo aerial photos have been the basis for most topographic mapping, and CORONA were acquired with this capability in mind. Traditionally, two overlapping stereo images were placed on a stereo plotter, a device that enables an analyst to view images in stereo and carefully trace topographic lines onto a map. Today, several photogrammetric software applications, such as ERDAS' Leica Photogrammetry Suite, offer digital tools designed to mimic this traditional process using a floating cursor. Generating topographic data from stereo images in this manner is certainly possible, but requires considerable skill on the part of the analyst and is very labour intensive, so would be impractical over very large regions. Alternatively, several software packages now offer the capability to generate digital elevation models (DEMs) automatically from stereo aerial images. The principles behind doing so are relatively straightforward, although results can be highly variable depending on image quality, terrain relief, and other factors.
Figure 55: Automated DEM extraction from stereo CORONA images in ERDAS Leica Photogrammetry Suite
If camera parameters and image geometry of two overlapping CORONA images are established via any of the methods outlined and these images are accurately orientated with respect to the ground, the three-dimensional ground coordinates of any feature that can be identified in both images may be computed via forward space-intersection (Wolf and Dewitt 2000, 150 & 327-45). This can be accomplished manually, with the user selecting identical points, or tie points, that are visible in both images, but many thousands of such points would be required to produce a reasonable DEM. Modern methods of DEM generation via soft-copy photogrammetry use image correlation techniques to automate the tie point selection process. In one implementation of this process, the user instructs the computer to select every nth pixel in the left image, find the matching point in the right image, and then compute its ground XYZ coordinates. The known orientation of the images restricts this search along what is known as an epipolar line. A rough knowledge of possible elevation values, derived from an existing DEM such as an SRTM, can help to limit the search to a segment of this line. Because this process relies on the uniqueness of the surrounding image content to find good matches, reducing the search space is important. It is also important to pre-process overlapping images such that the contrast of the images is relatively high and the two images closely match in terms of brightness. In many CORONA images, there were differences in image quality from the forward and aft cameras, and the more ways the two images vary from one another, the more difficulty software will have in automated point matching. In one example, automated tie point generation performed in ERDAS Leica Photogrammetry Suite produced good results in some parts of the image but poor results in other areas (tie points are shown as squares) (Figure 55). Manually adding additional points where software has difficulty can greatly improve results.
Figure 56: 10m DEM produced from stereo CORONA images for the northern Ghab Basin in western Syria. Automated extraction produces better results in areas of higher contrast, such as mountains, than in the flat plain.
To date, our efforts to extract DEMs from CORONA stereo pairs has been reasonably successful in areas where image contrast is good and topographic variation is relatively significant, as in the Orontes River Valley of western Syria. We achieved quite good results in this area, selecting every fifth pixel for matching, producing a 10m DEM of the valley. The resultant image reveals many subtle features of terrain relief, including mountains surrounding the valley, the courses of both modern and ancient river levees in the valley bottom, and mounded archaeological sites throughout the plain. While very useful for many purposes, the DEM, in this case generated in ERDAS LPS, also contains numerous errors appearing as high spikes or low troughs. It is particularly problematic in the flat plain where it is more difficult to achieve good matches, and thus good elevations, due to homogeneous areas of farmland and areas exhibiting repetitive patterns. These errors and the product DEM can be improved through a variety of methods, including the manual inputting of tie points wherever automated image matching is poor, or alternatively editing the DEM directly.
Figure 57: A 10m DEM with orthoimage draped over the Euphrates River Valley in Syria (relief exaggerated 5x). This entire area has now been flooded by the construction of the Tabqa Dam.
Figure 57 illustrates a somewhat improved DEM of the Euphrates River Valley in northern Syria, in this case a 10m DEM generated from a stereo pair, overlaid by an ortho-image of the same area. With topographic relief exaggerated by five times, this now completely flooded portion of the river valley can be mapped in 3D. Individual archaeological sites are evident in both the valley floor and terraces above, while their relationship to local topography is clear. Closer examination reveals many areas where the product DEM is less than perfect, again a result of sometimes incorrect point matching by the software. Despite its flaws, the DEM has much value, particularly in heavily affected areas like this one where no other options for high-resolution DEMs are available.
An attempt to map the very flat landscape of the Diyala Plains of southern Mesopotamia, the region explored in the classic volume The Land Behind Baghdad (Adams 1965), illustrates many of the potential difficulties in getting good results from DEM extraction (Wesolowski 2012). In this area, the homogeneous landscape and extremely flat surface, featuring many repeating patterns of fields, made automated tie point generation quite poor. However, where features are visible on the CORONA imagery, such as along ancient canal levees, these appear relatively clearly on the product DEM. The results illustrate with great detail the relative height and pattern of the ancient canals that course through this early irrigated plain.
As long as CORONA images are well-orientated to one another and to the ground, the main difficulty we encounter with topographic data extraction from CORONA imagery lies in the ability of software packages to identify matching points in two stereo images successfully and accurately. The above examples illustrate that with current technology, this process still requires significant help from the user in the form of image balancing and enhancement, manual tie point generation for homogeneous areas, and significant processing of results to remove artefacts and mistakes in output DEMs. As the sophistication of photogrammetric software steadily improves in the coming years, as is the case in applications designed for 3D photogrammetry using ordinary digital photos such as AgiSoft's Photoscan or AutoDesk's 123D Catch, the product of automated DEM extraction from CORONA stereo pairs will also likely improve.
© Internet Archaeology/Author(s)
University of York legal statements | Terms and Conditions
| File last updated: Fri Sept 21 2012