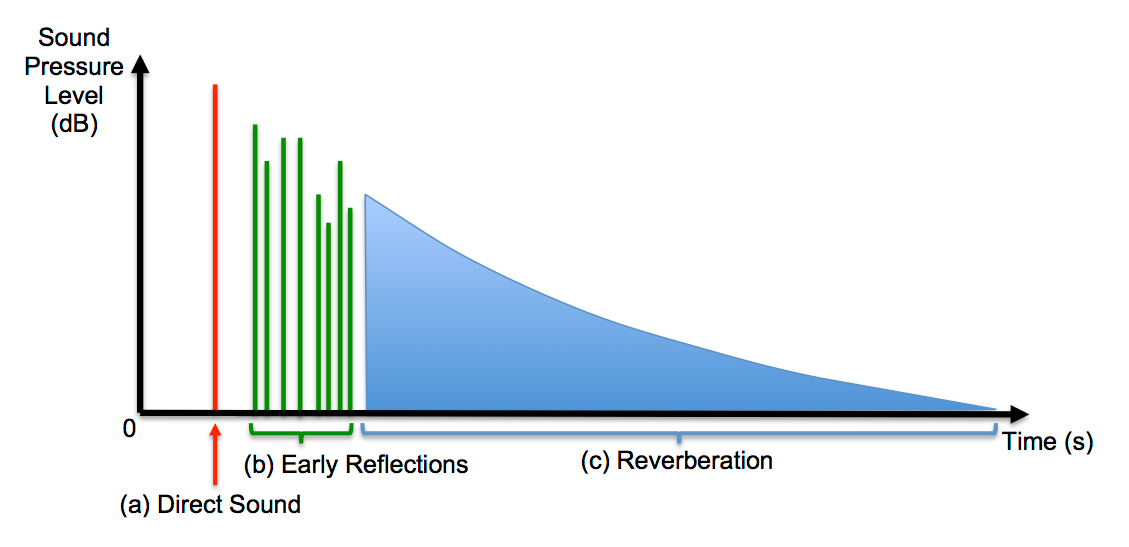
Figure 1: The echogram profile of a typical impulse response from an enclosed space, demonstrating how a short, impulsive sound – like a handclap, balloon pop or gun-shot – at the source position arrives at the measurement position in three stages: (a) the direct sound arrives via the straight line path between sound source and measurement position, arriving a short time after the sound source has stopped; (b) the early reflections arrive via the next longest paths from source to measurement position, involving one or more reflections from the main surrounding walls, where some additional energy will be lost due to sound absorption; (c) the reverberation or exponential reverberant decay, where it is no longer possible to detect distinct reflections due to the density of arrival of many reflections via many paths, involving reflections from multiple walls.
Figure 2: This animation depicts geometric acoustic sound propagation. The model, shown in plan view is a reconstruction of St Mary's Abbey Church, York (see Section 5). An impulsive sound source is introduced into the space, and the resulting sound propagation paths are visualised as a circular spread of 'billiard balls' travelling out into the modelled volume and undergoing reflection when they interact with bounding surfaces and objects within the space.
Figure 3: Frequency-domain spectrogram of the exponential sine sweep sound source excitation signal, from 22Hz to 22kHz, used as the analytical signal played back through a loudspeaker. The signal effectively sweeps through the audio spectrum so that the acoustic response of the measured space is captured for each frequency.
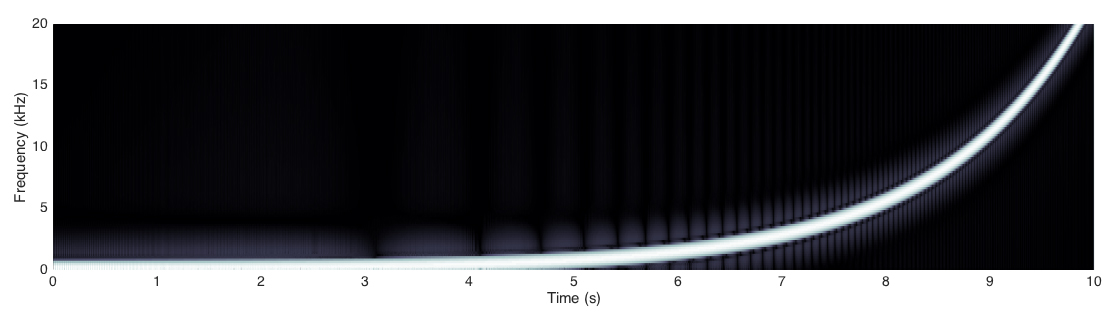
Figure 4: Frequency-domain spectrogram of the measured exponential sine sweep sound source excitation signal as captured at the receiver microphone. Note the blurring of the most prominent sweep when compared with Figure 3, demonstrating the decay of sound energy at each frequency due to the acoustic response of the space. The additional, fainter sweeps, are due to distortion introduced by the measurement transducers, and other evident signal components are due to additional noise present during the measurement process.
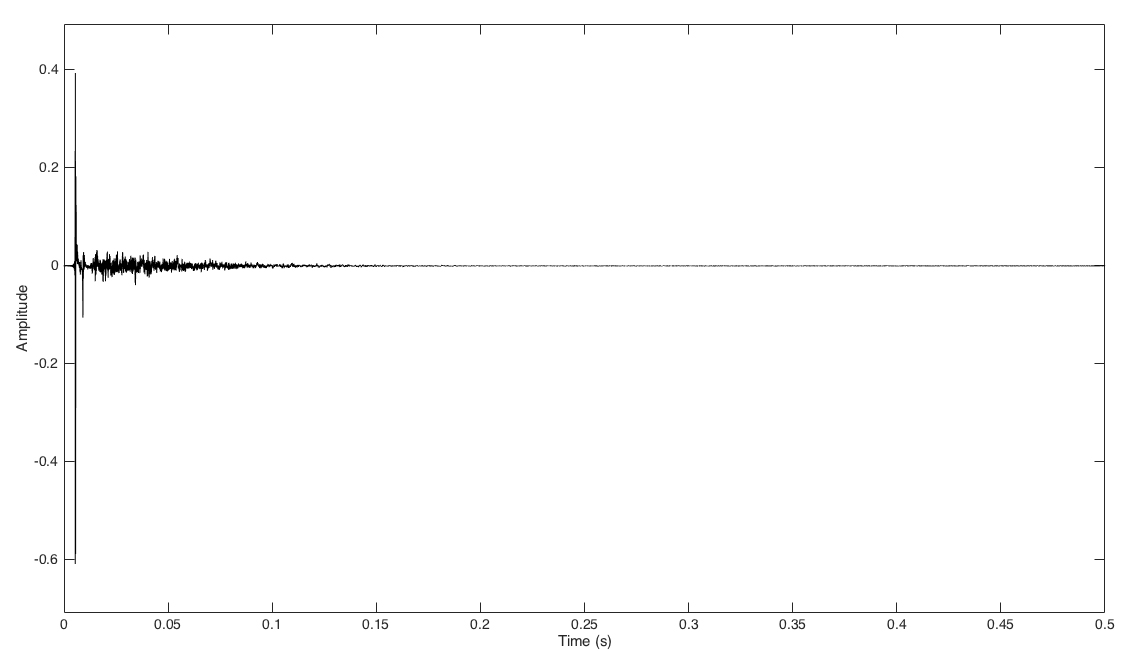
Figure 5: The final time-domain impulse response waveform arrived through post-measurement processing to inverse filter and window the measured sweep signal shown in Figure 4. The additional non-ideal signal components introduced during measurement can be very effectively minimised during this processing, resulting in a very clean and high-quality result, suitable for auralisation and further analysis.
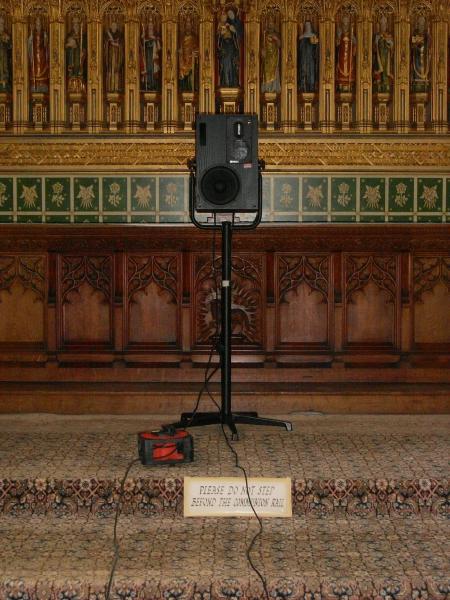
Figure 6: Loudspeakers used as the sound source for OpenAIR acoustic measurement: the Genelec S30D studio monitor, used for best results but limited to indoor spaces only, in this case St Patrick's Church, Patrington, UK.
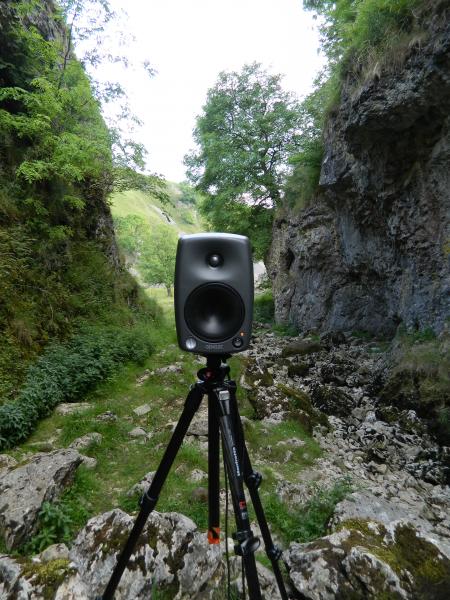
Figure 7: Loudspeakers used as the sound source for OpenAIR acoustic measurement: the Genelec 8130A is a good compromise when portability is required, as shown here when measuring Troller's Gill limestone gorge in the Yorkshire Dales, UK.
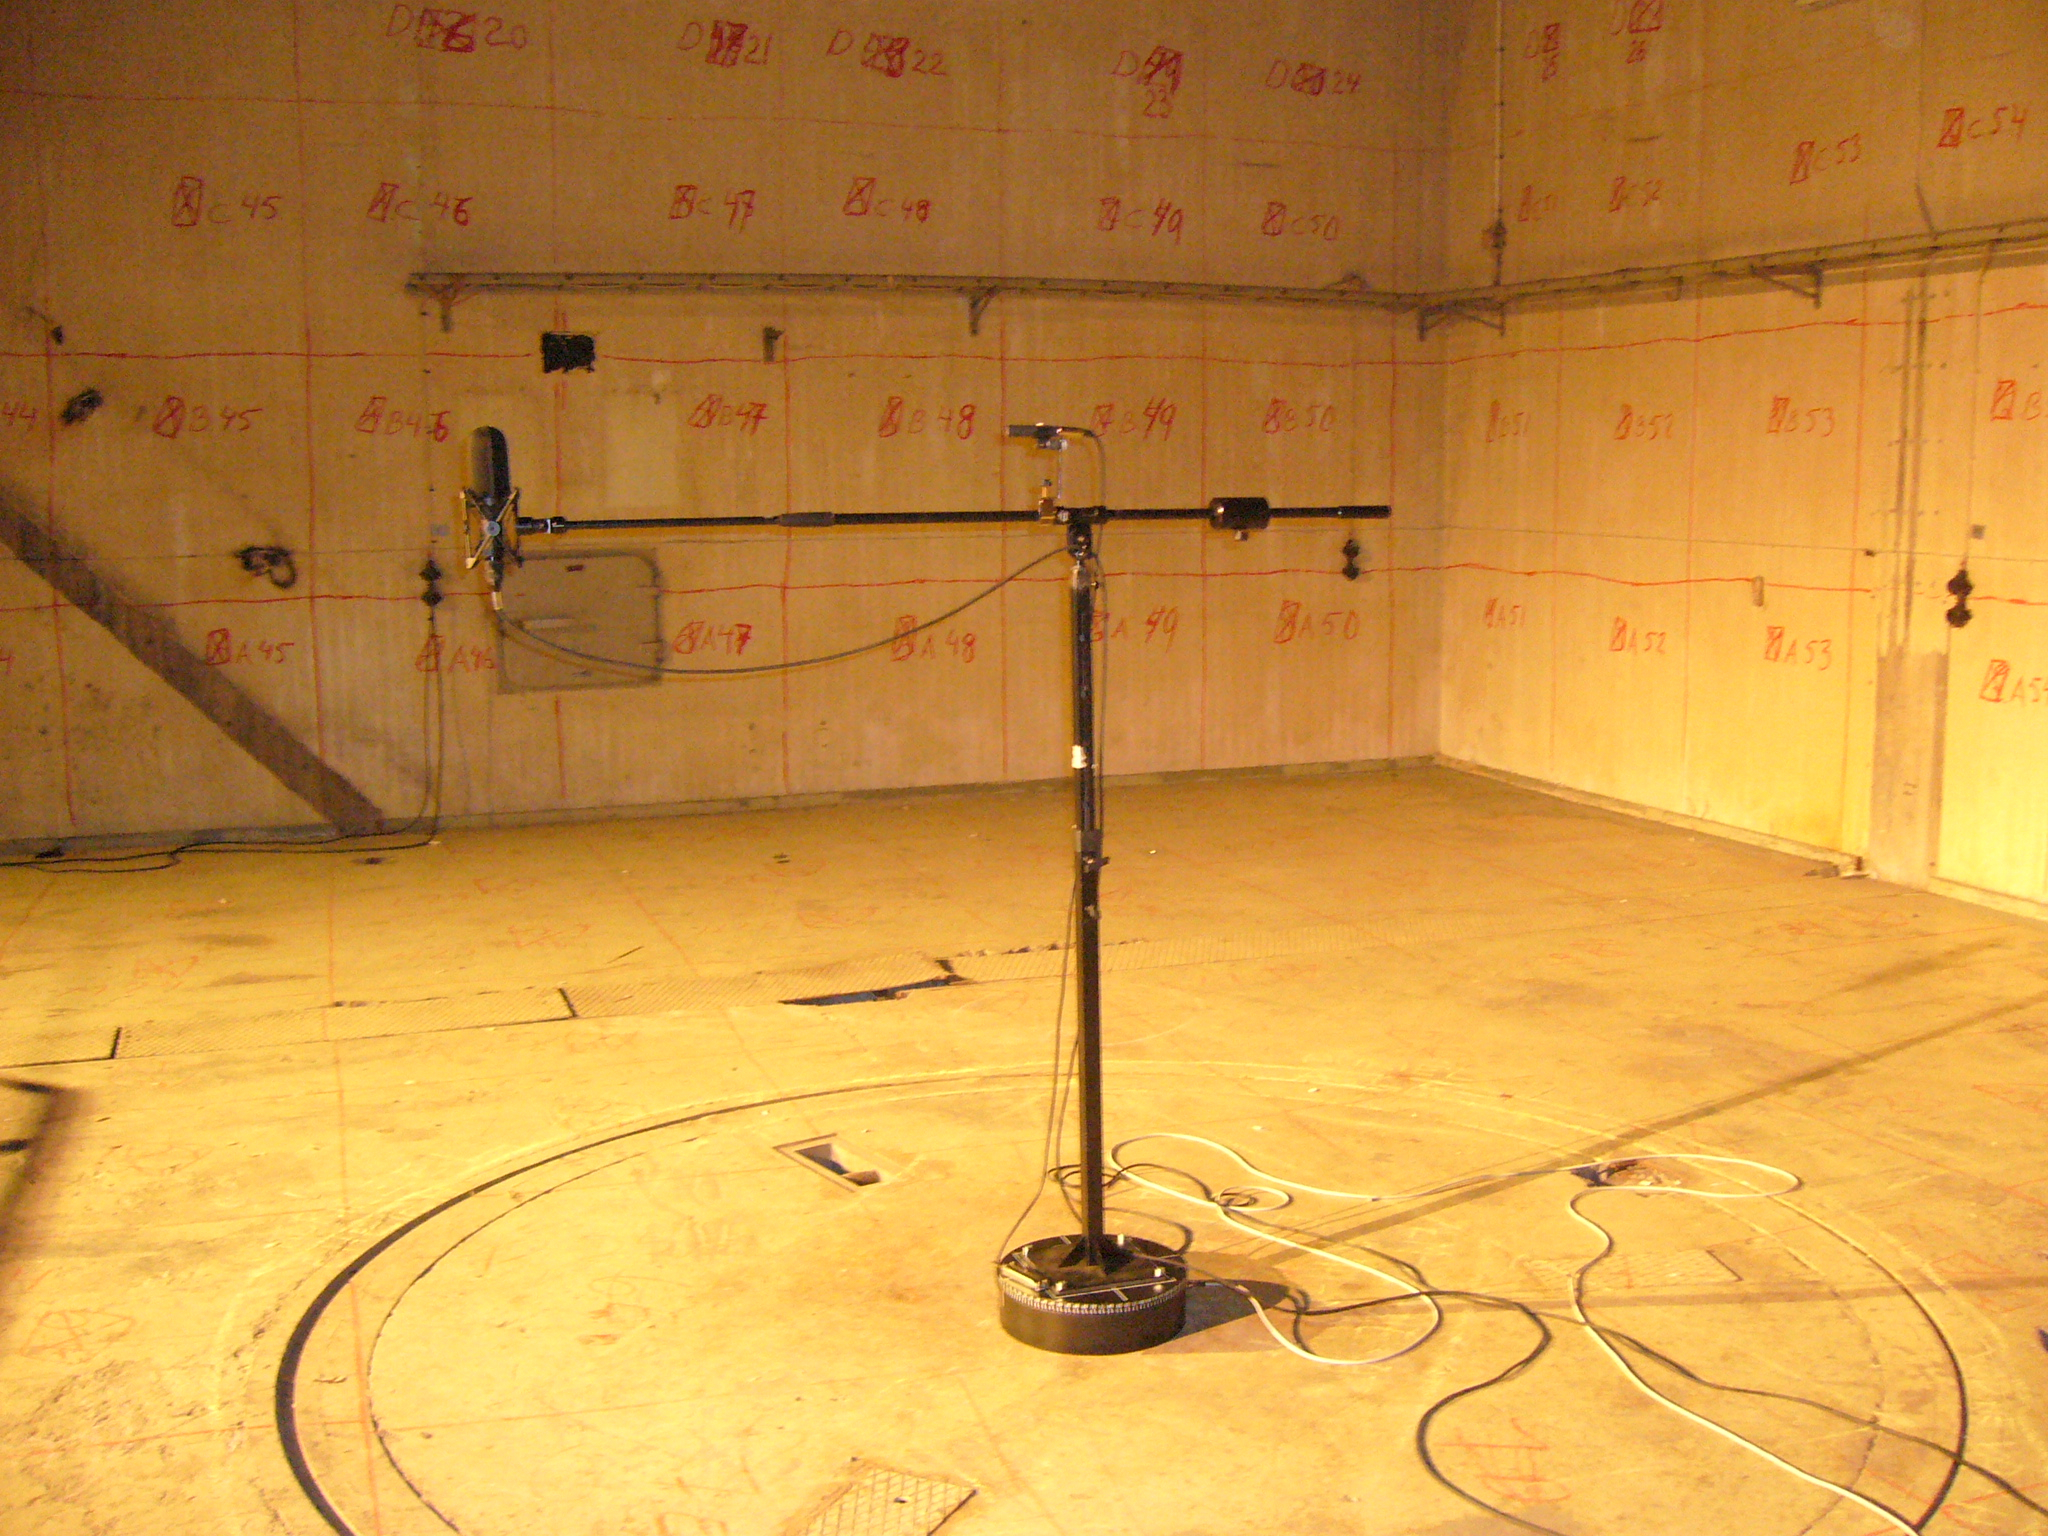
Figure 8: Microphones used at listener position for OpenAIR acoustic measurement: Soundfield SPS422B and Neumann KM140 mounted on automated turntable, with the centre axis of the turntable located at the listener position, shown in the R1 Nuclear Reactor Hall, Stockholm, Sweden.
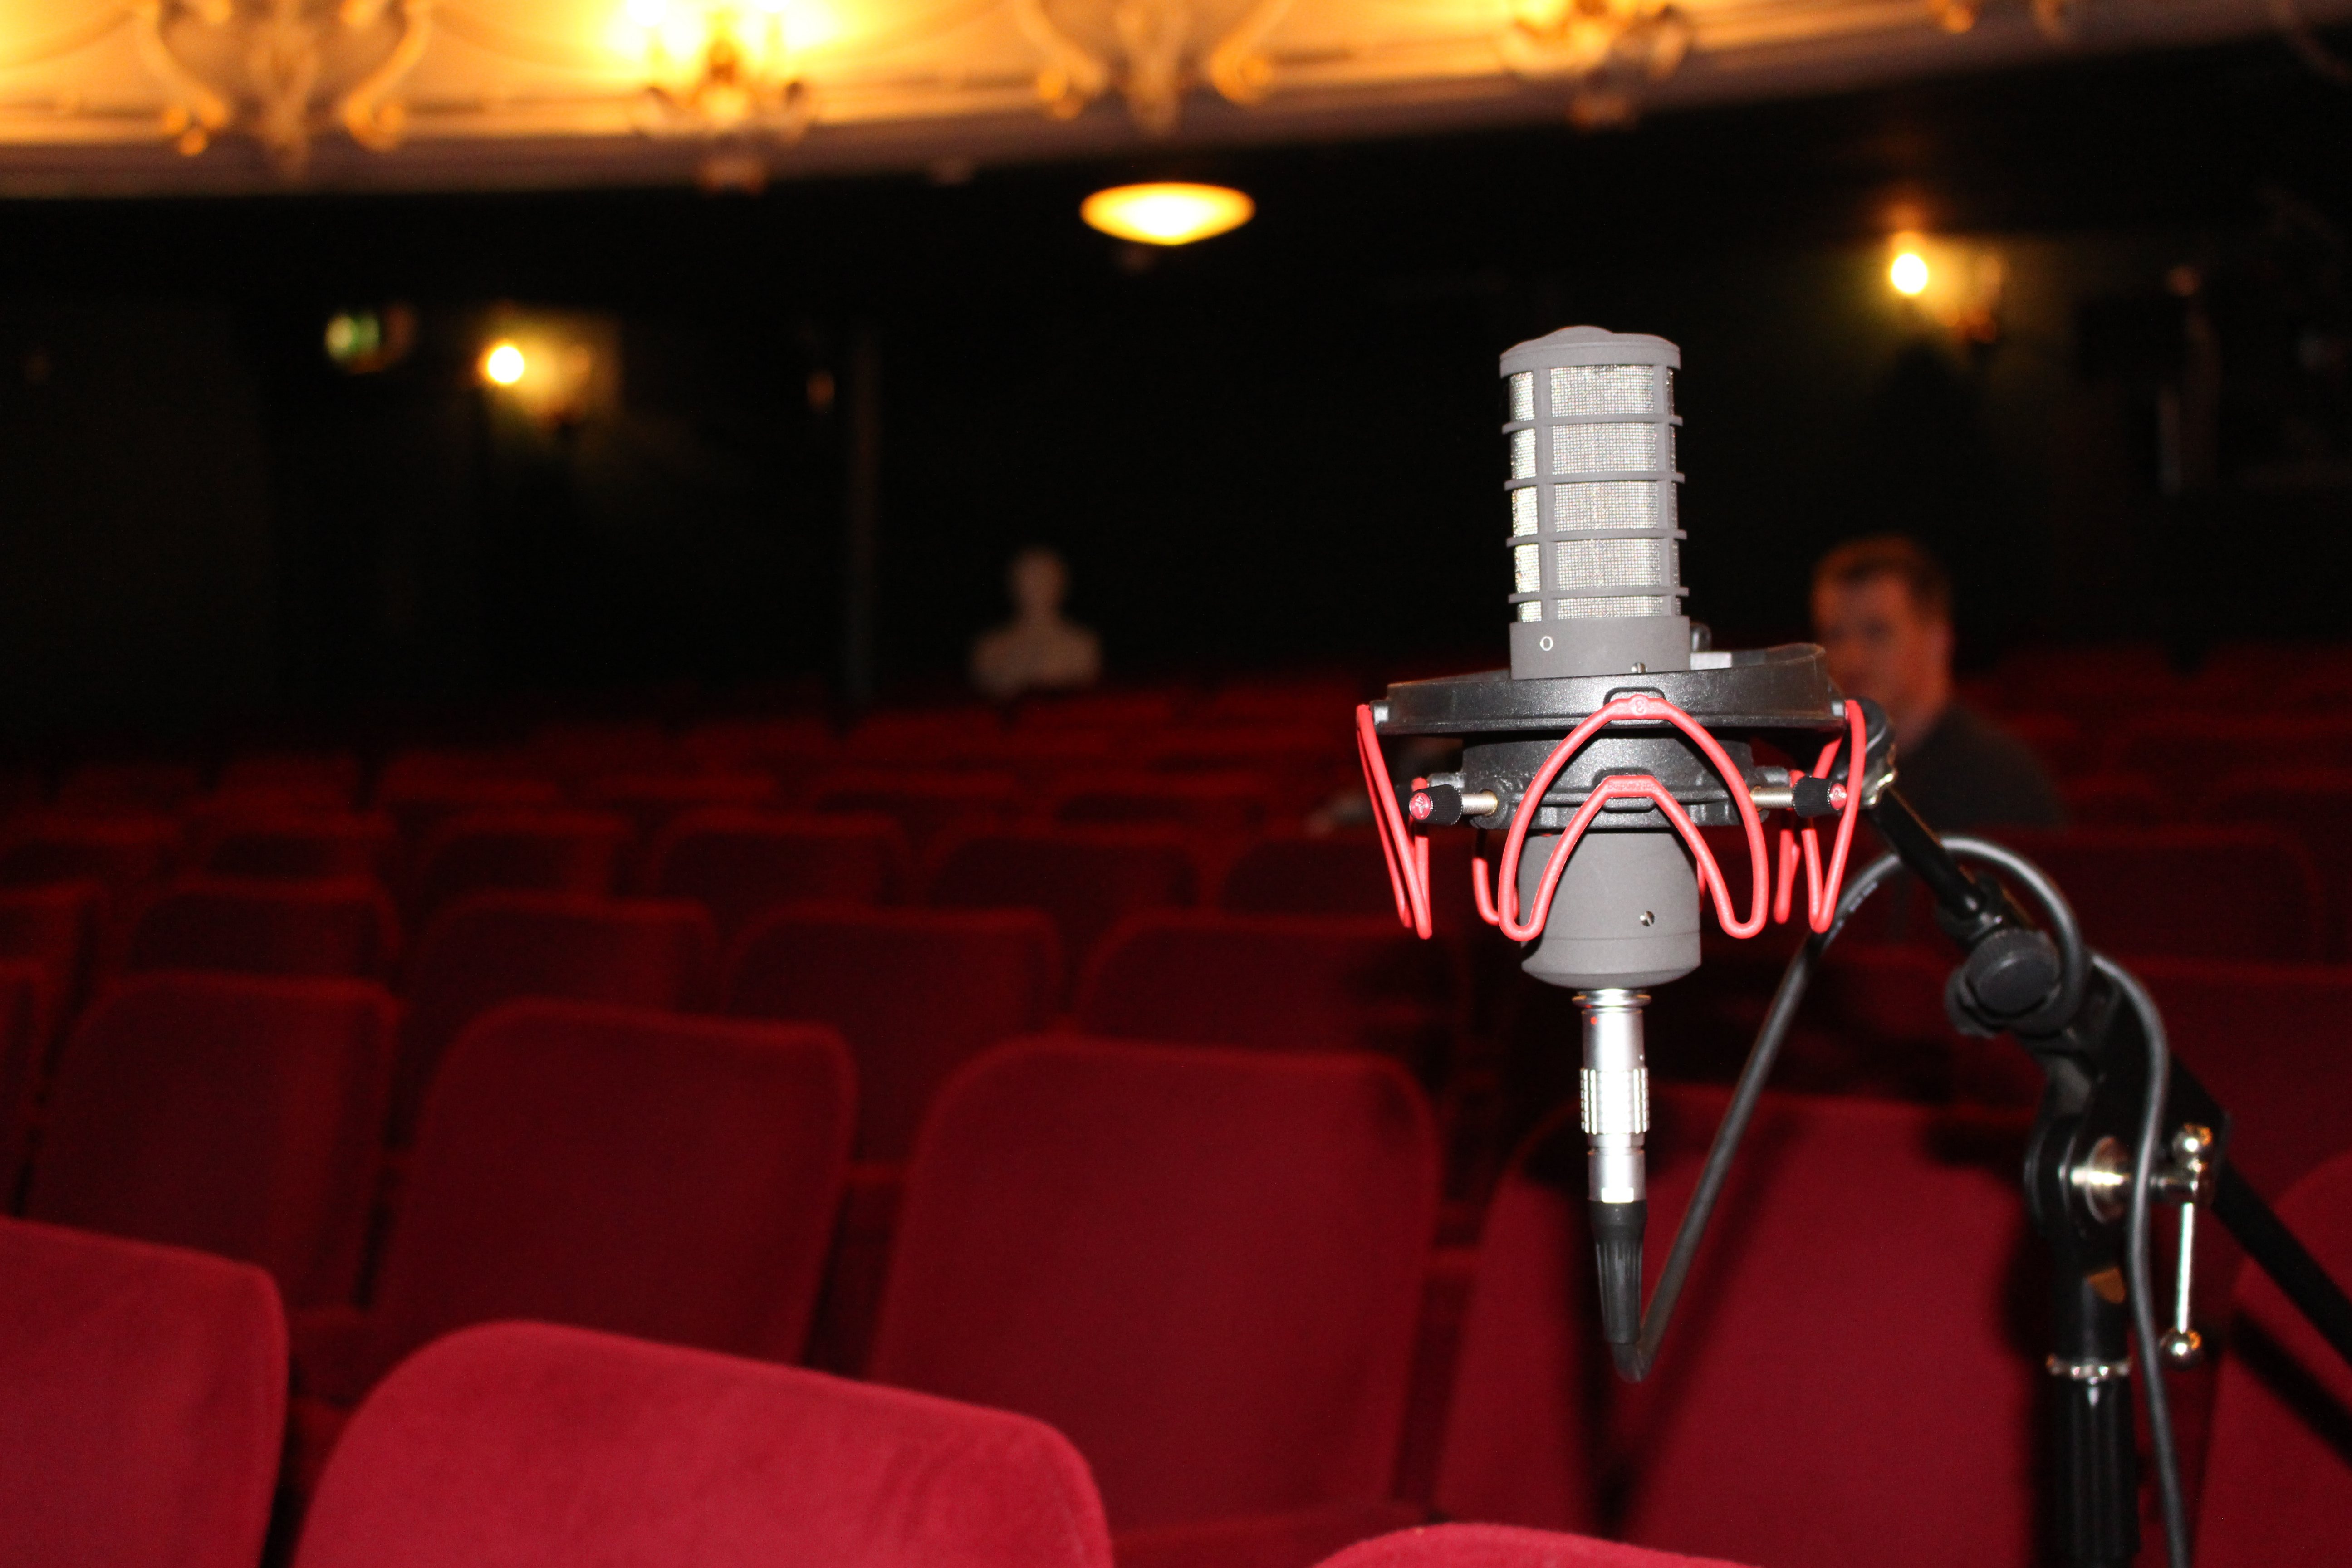
Figure 9: Microphones used at listener position for OpenAIR acoustic measurement: close-up of the Soundfield ST450 used for single point measurements when portability or speed of measurements is a factor, here shown in the circle of the York Theatre Royal auditorium.
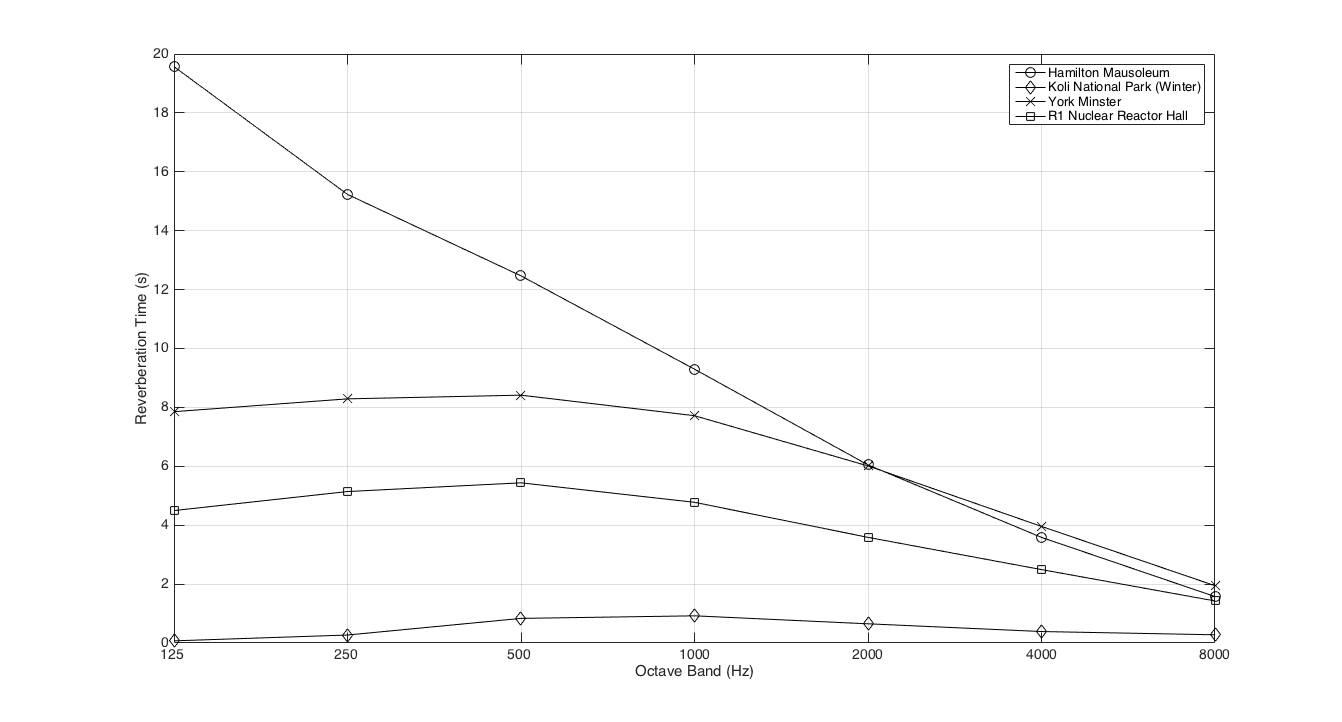
Figure 10: Reverberation time (RT60) measured in seconds across octave bands from 125Hz to 8000Hz, for four varied acoustic spaces available on OpenAIR: Hamilton Mausoleum, Koli National Park (Winter), York Minster, and the R1 Nuclear Reactor Hall.
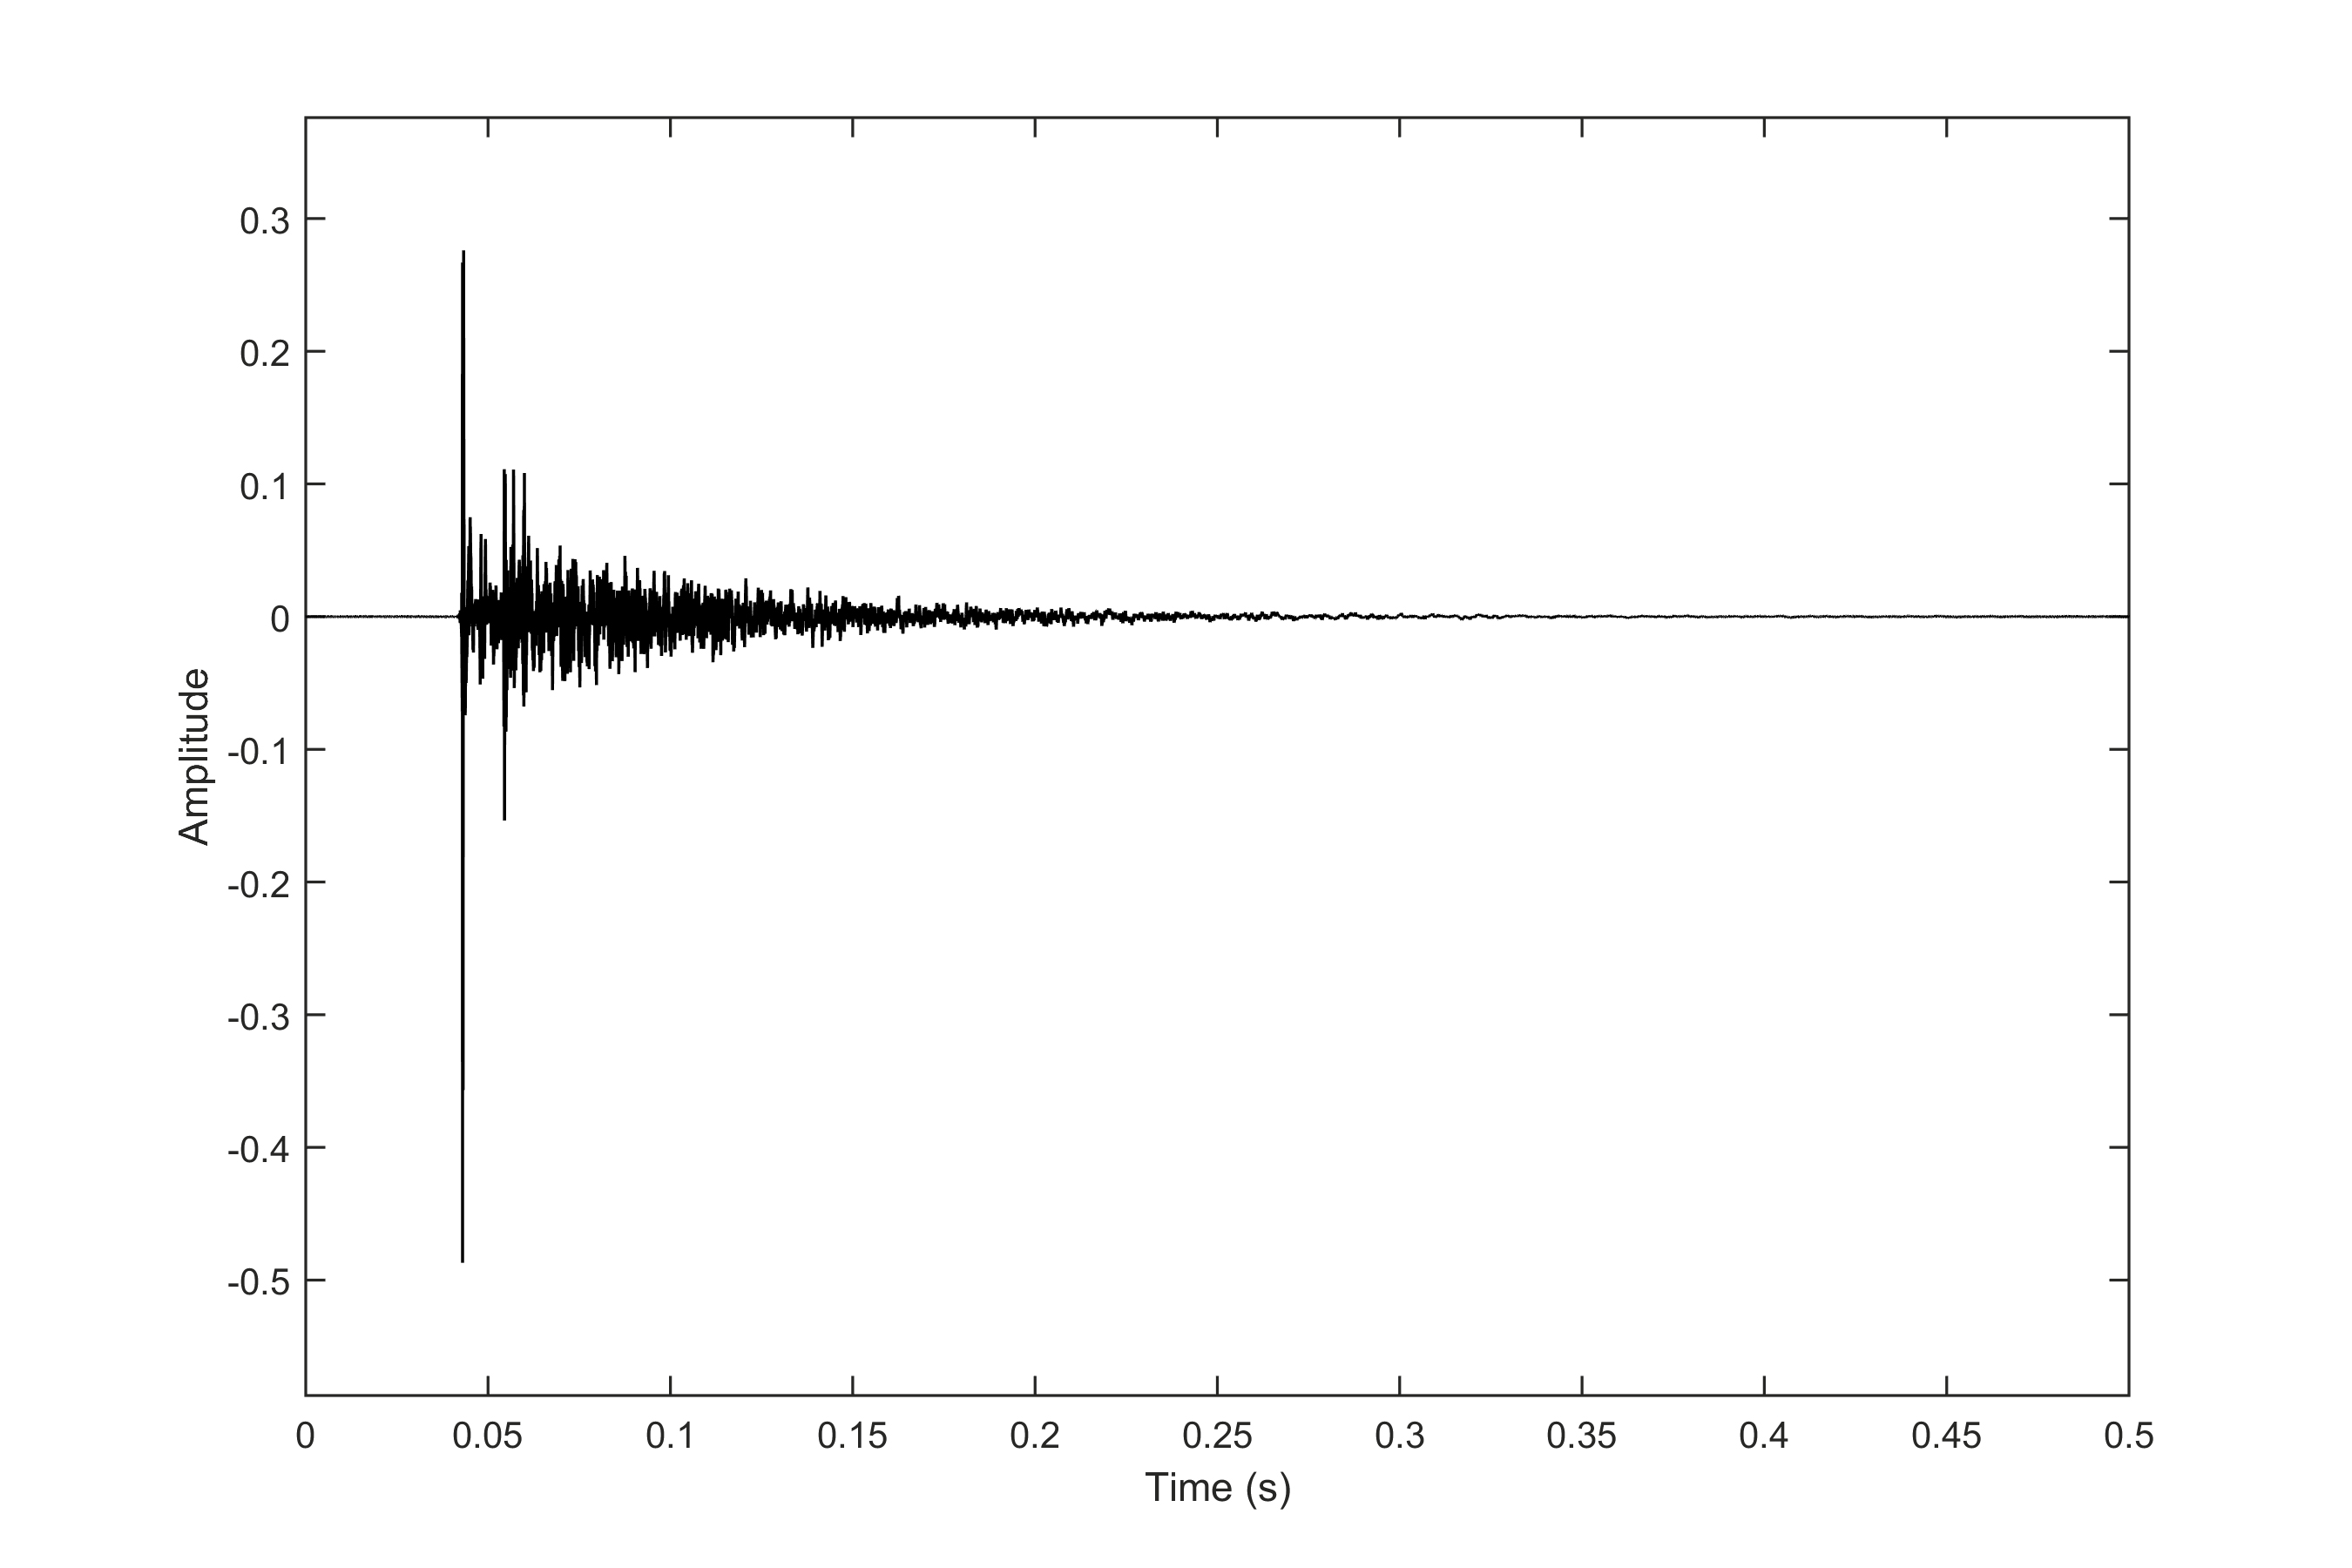
Figure 11: A series of analyses of one impulse response measured in Maes Howe passage tomb, Orkney, UK: time domain waveform plot of the actual impulse response.
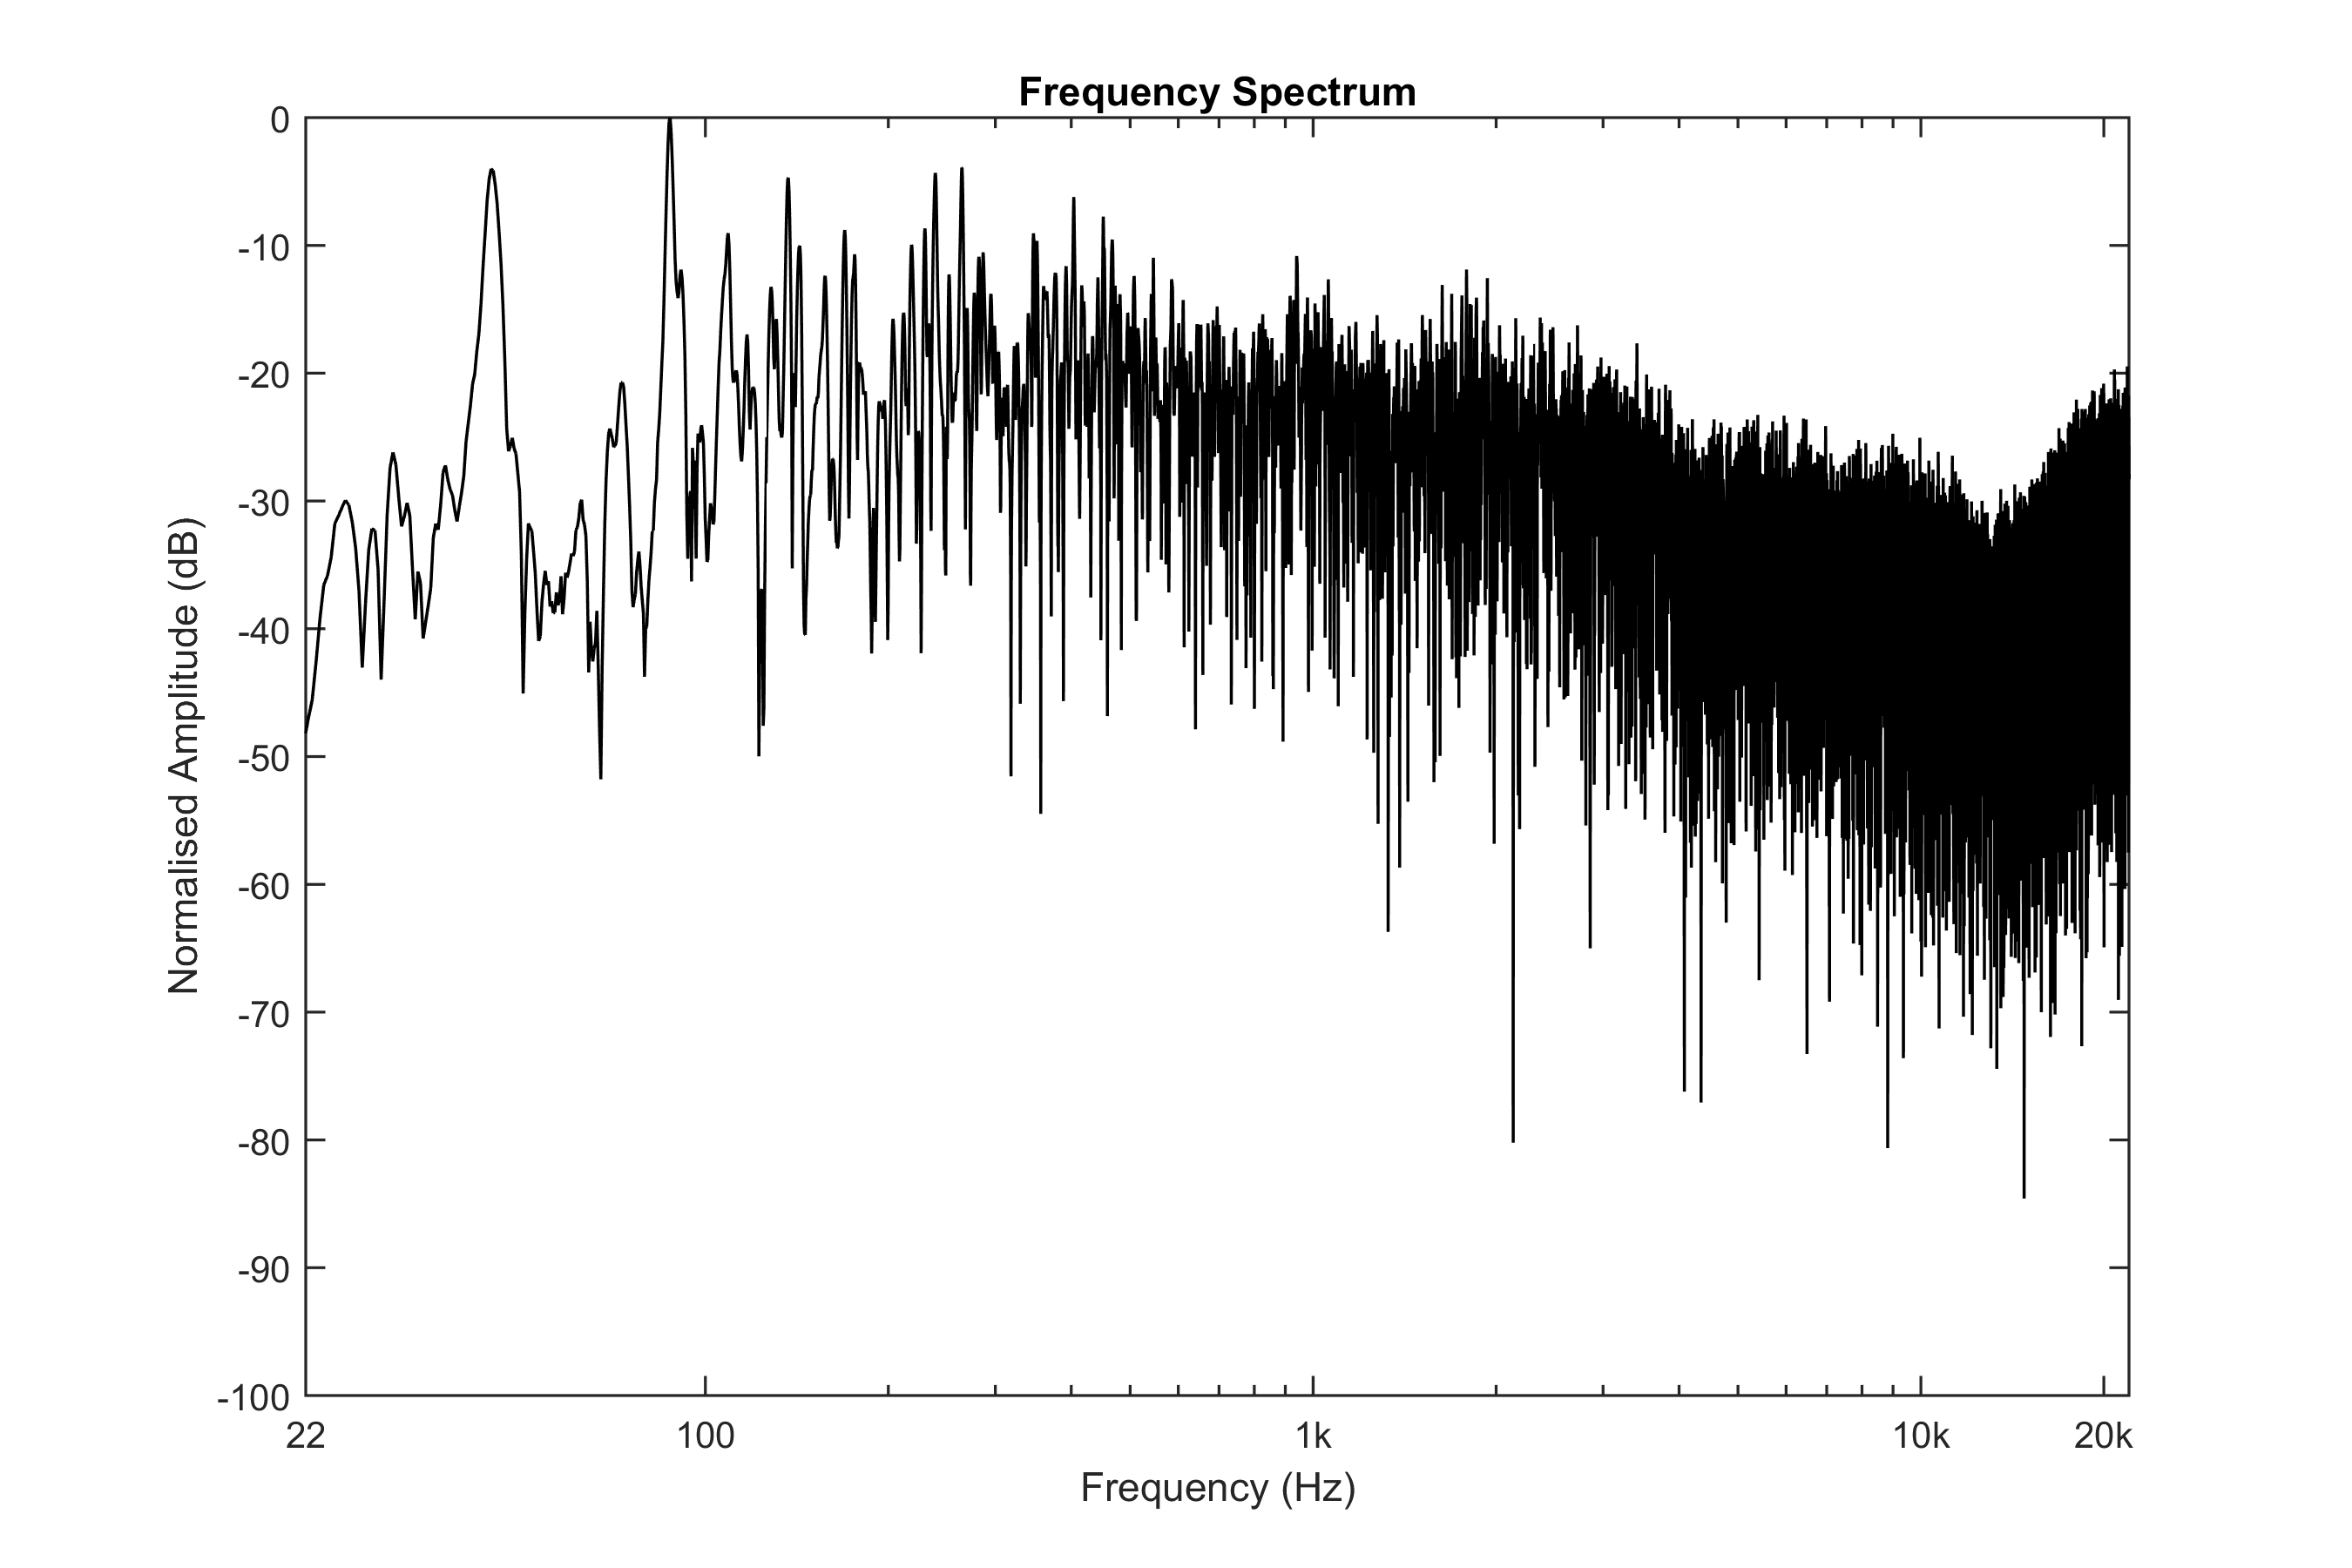
Figure 12: A series of analyses of one impulse response measured in Maes Howe passage tomb, Orkney, UK: frequency response obtained from time domain waveform plot in Figure 11 – note the large individual peaks below about 300Hz indicating a highly resonant space that would emphasise those particular frequencies of any sound heard within it.
Figure 13: A series of analyses of one impulse response measured in Maes Howe passage tomb, Orkney, UK: reverberation time (RT60) obtained from time domain waveform plot in Figure 11, varying with octave band between 250Hz and 8000Hz, noting that the overall decay of sound is very short.
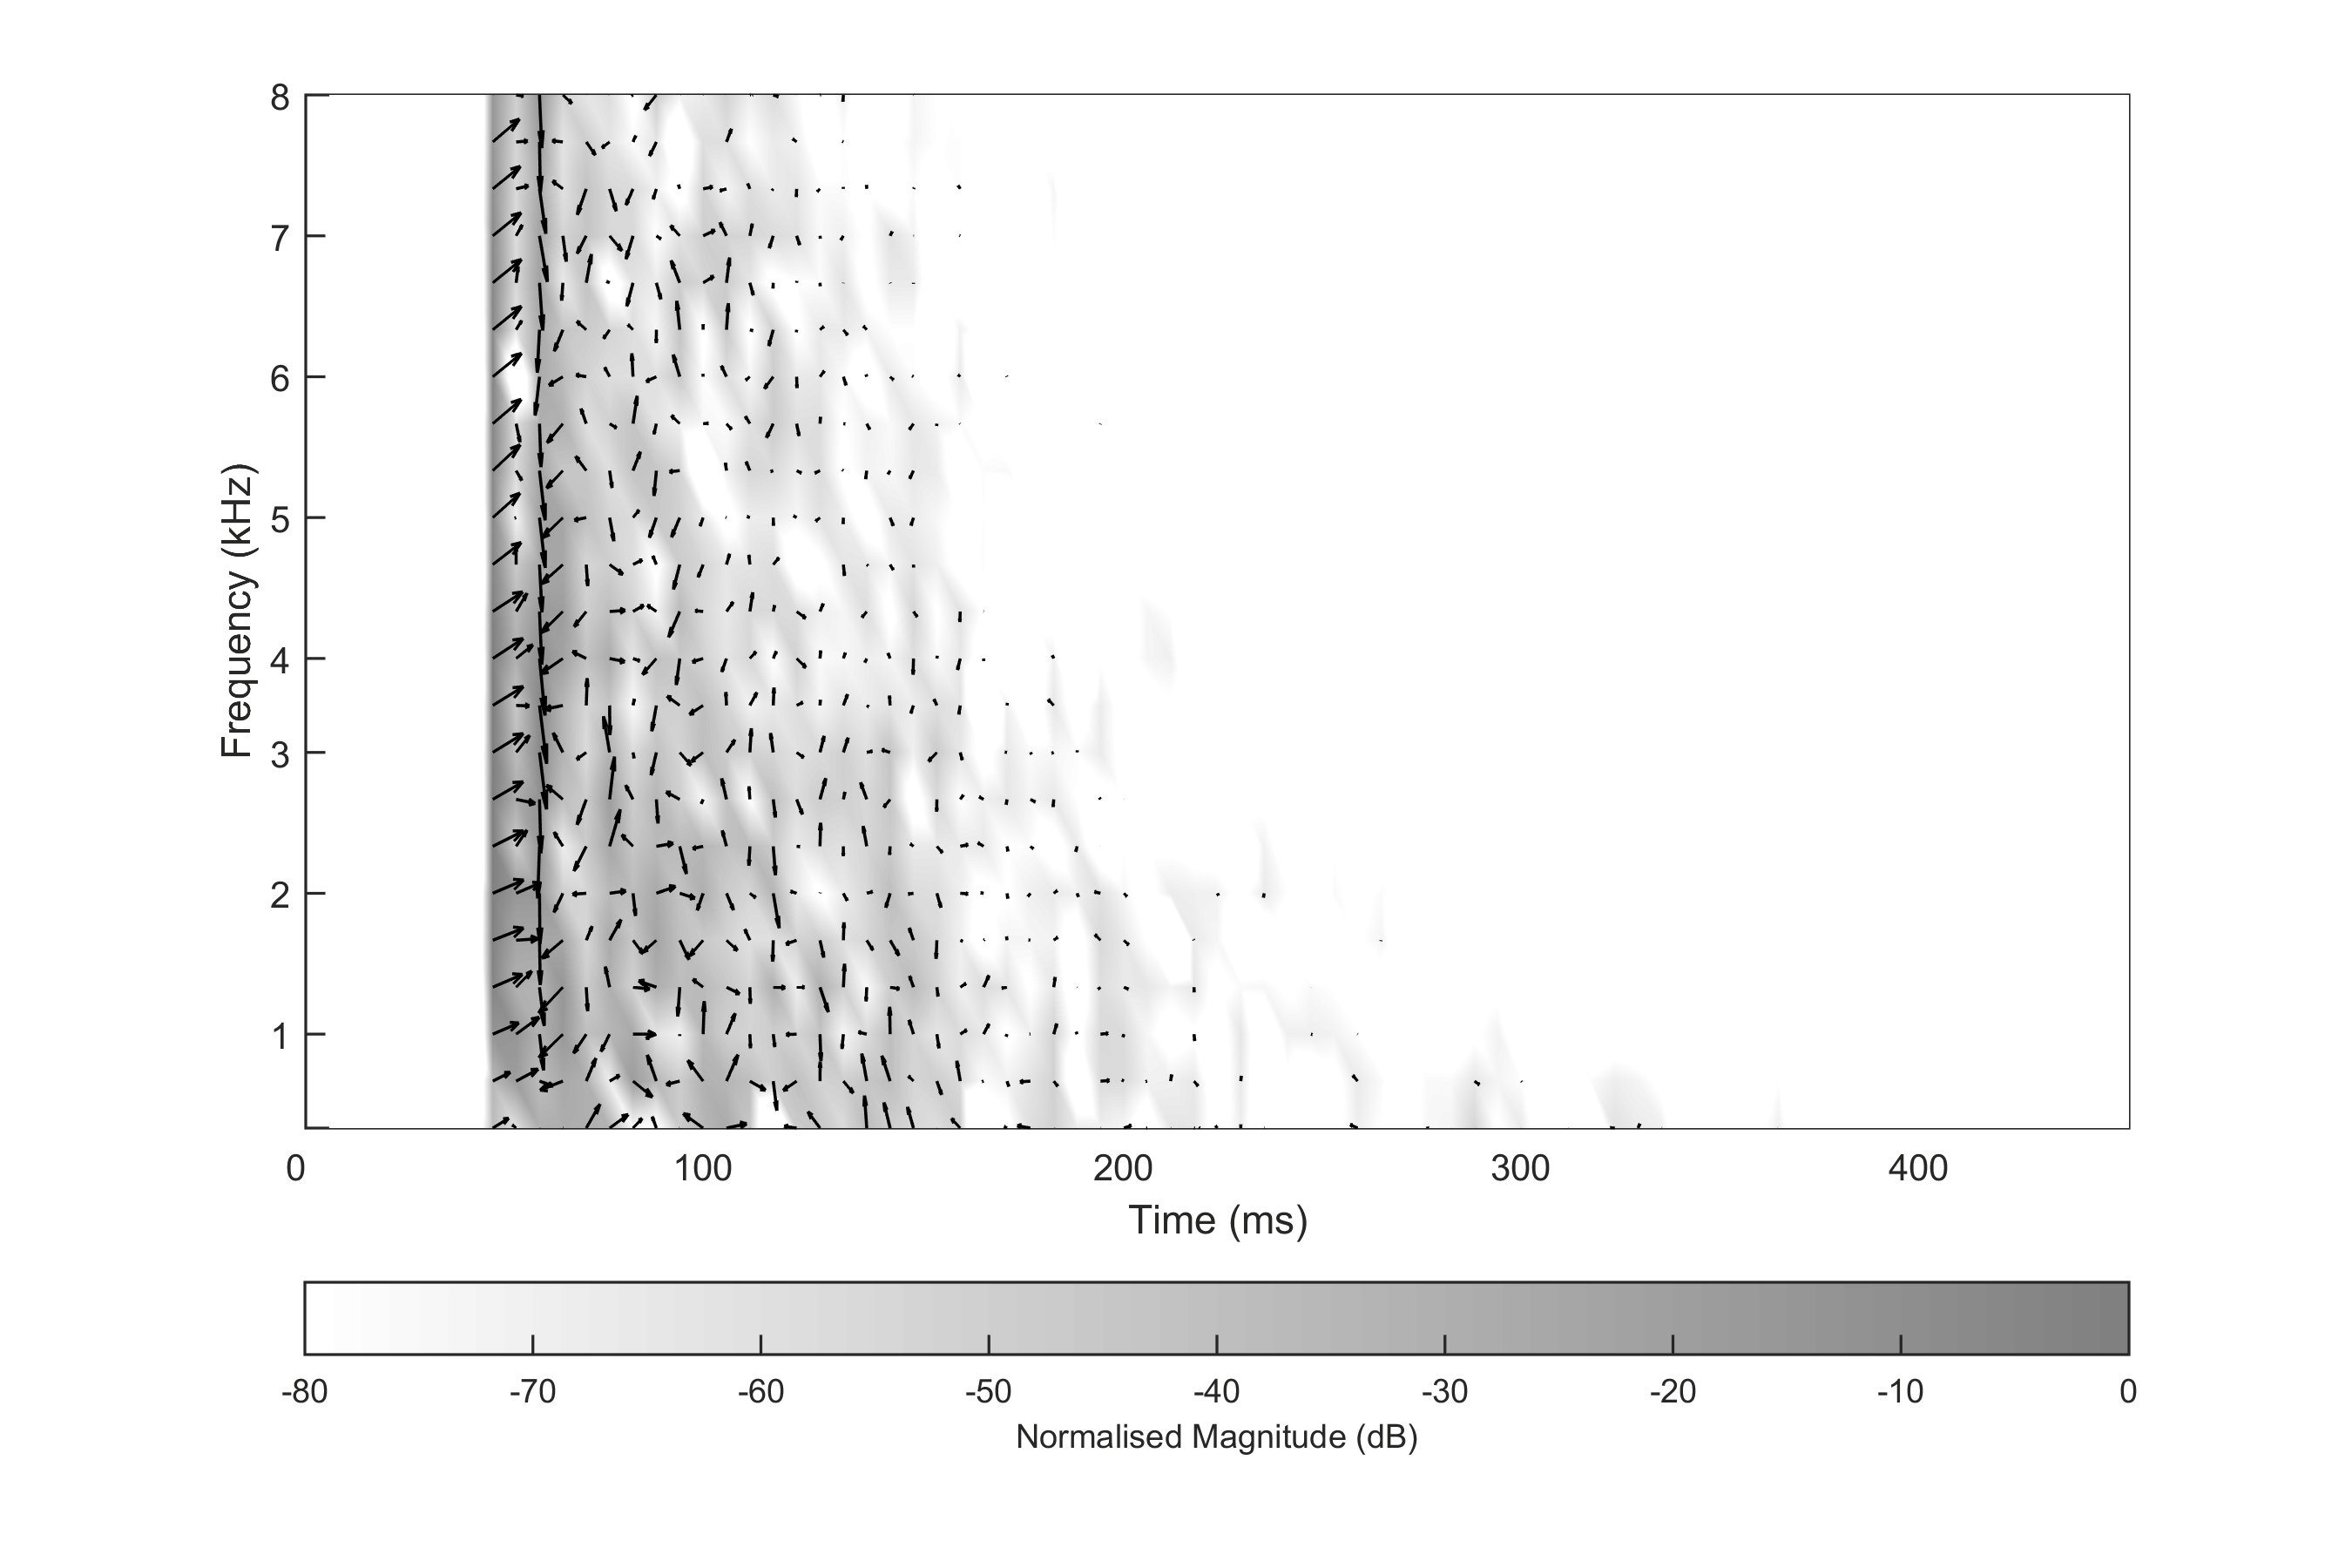
Figure 14: A series of analyses of one impulse response measured in Maes Howe passage tomb, Orkney, UK: spectrogram obtained from time domain waveform plot in Figure 11 showing how the frequency content of the impulse response changes over time, with a quiver plot reflection analysis overlaid indicating from which direction parts of the measured impulse response are arriving at the microphone – the direct sound and first reflection are particularly evident in this example.
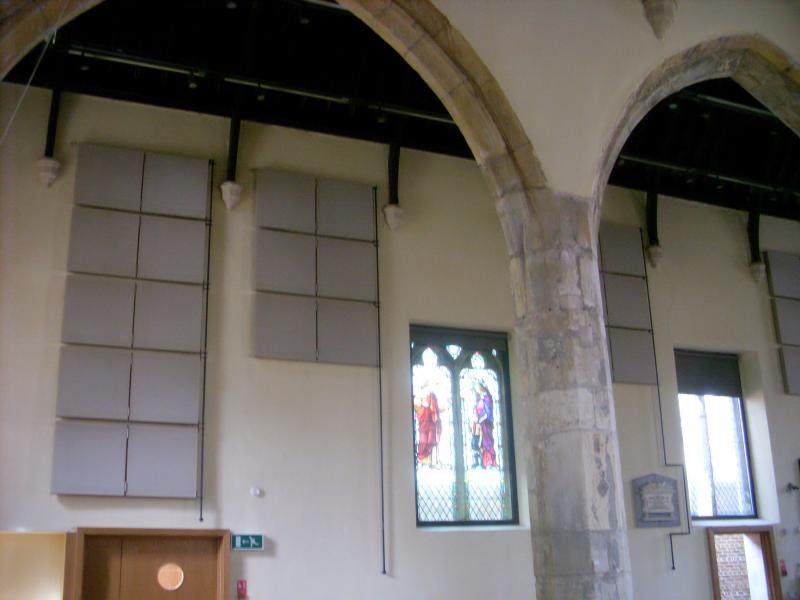
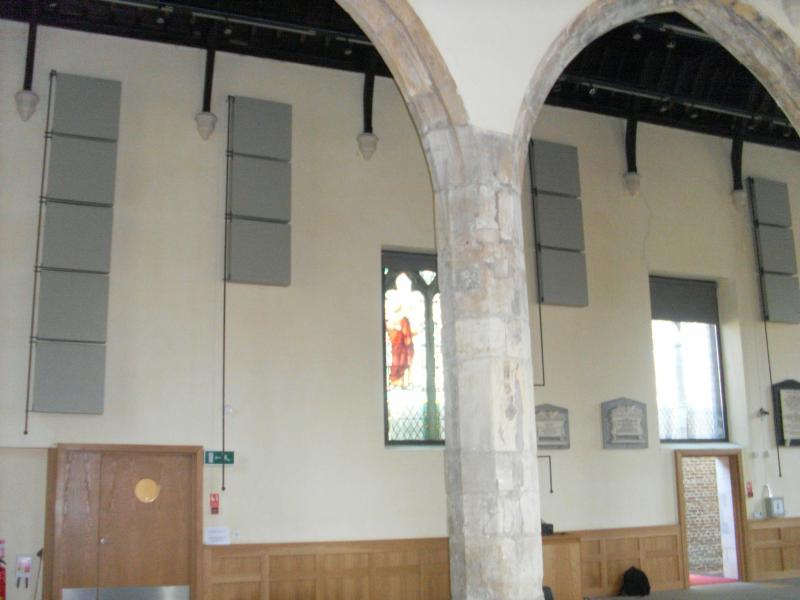
Figure 15: Reversible acoustic panels on the north wall of St Margaret's Church, York, open, so that they are most absorbing of incident sound energy.
Figure 16: Reversible acoustic panels on the north wall of St Margaret's Church, York, closed, so that they are most reflecting of incident sound energy. Note that at the top of the image, the roof lighting tracks can be seen, and it is above these that the variable closure drapes are situated.
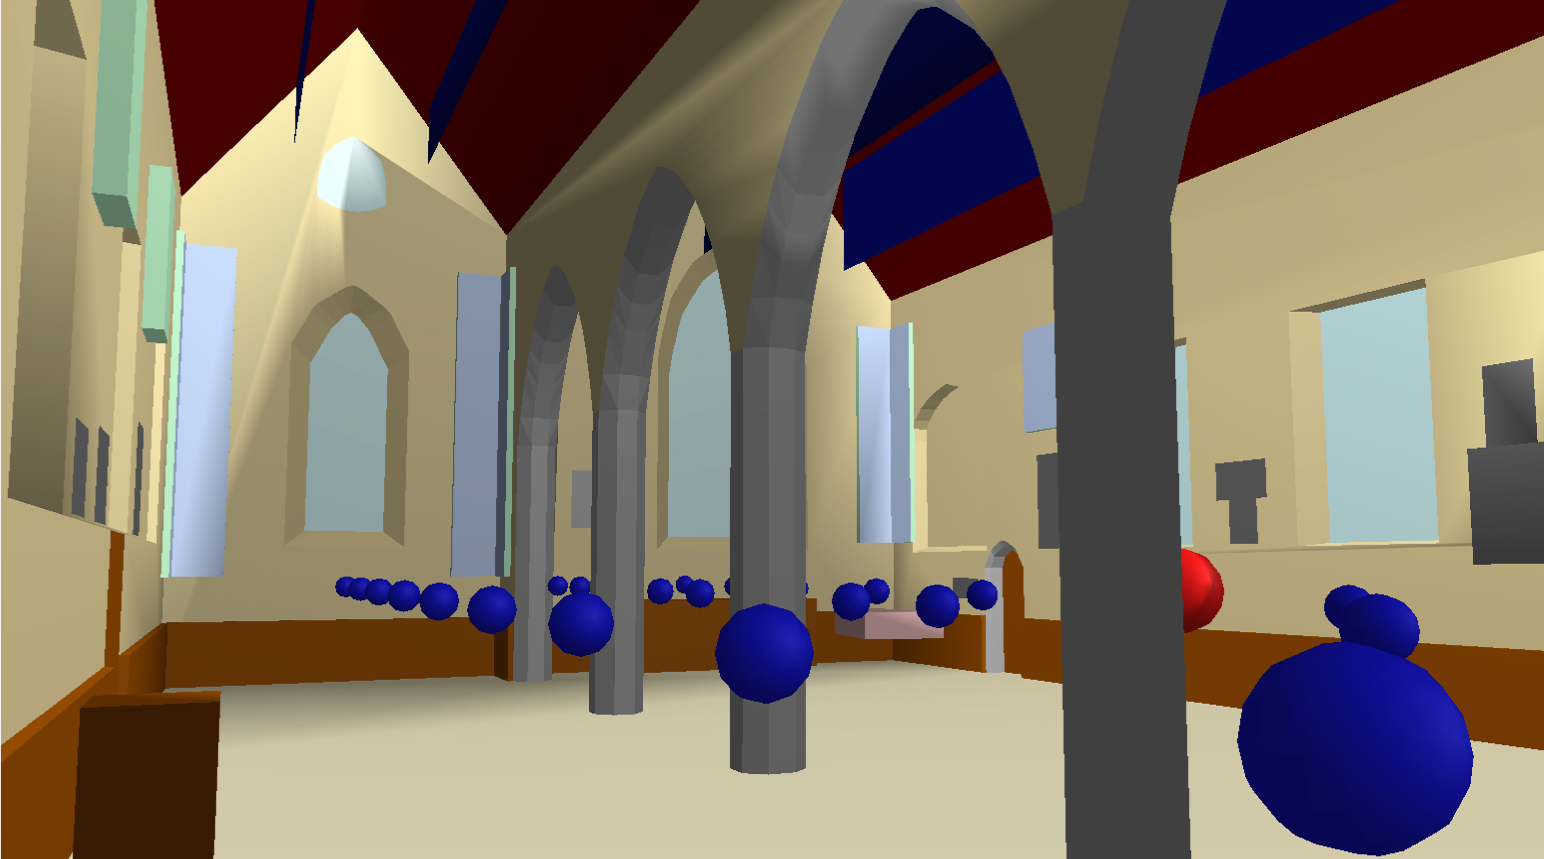
Figure 17: Computer model representations of St Margaret's Church: CATT Acoustic model, looking towards the east wall. The sound source is represented by the red sphere, with the grid of receiver positions represented by the arrangement of blue spheres.
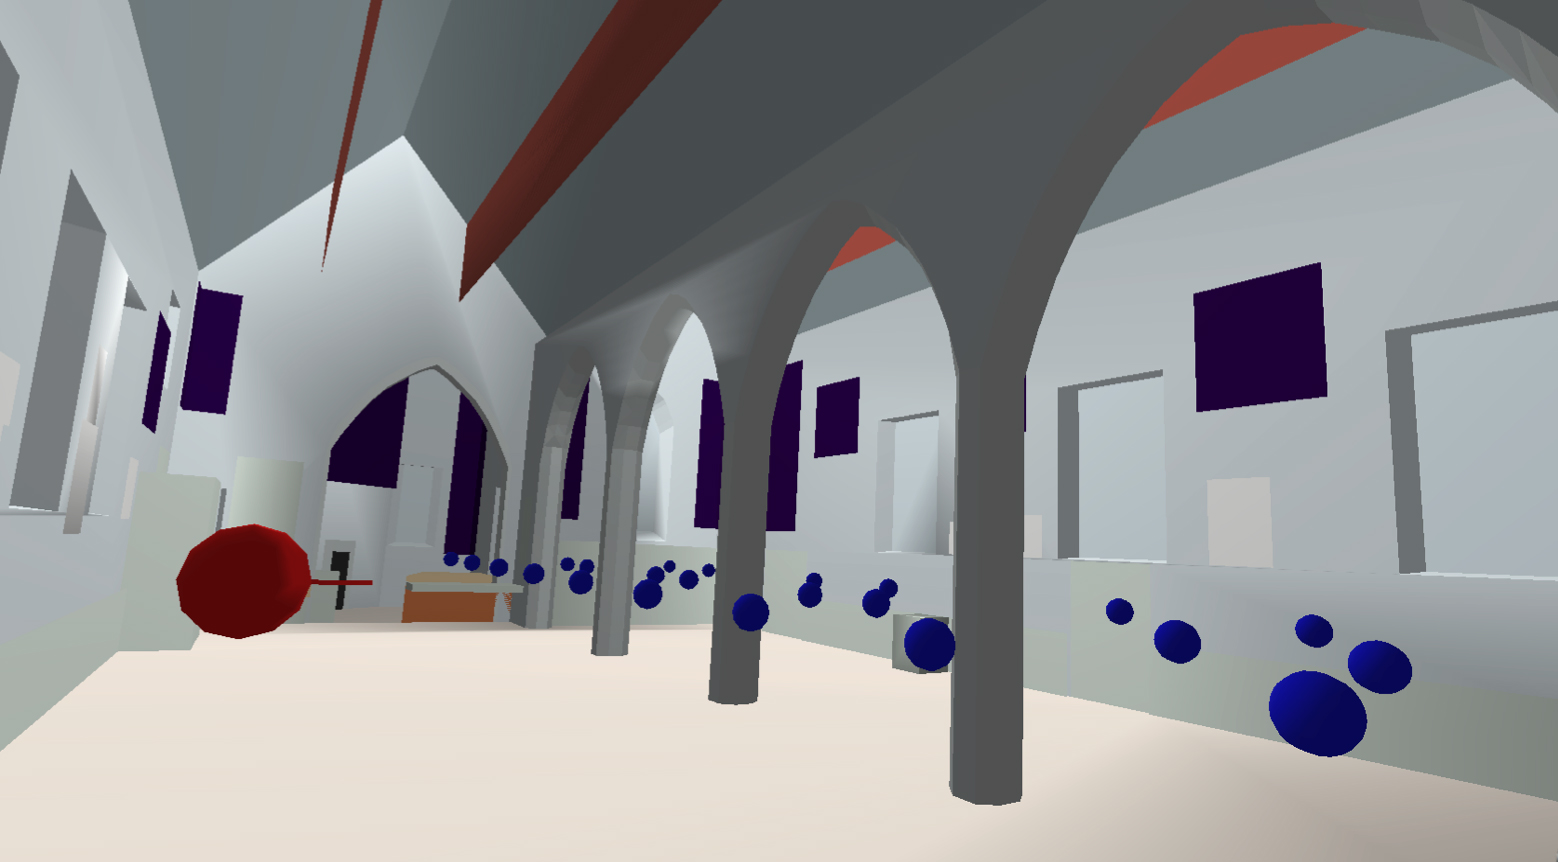
Figure 18: Computer model representations of St Margaret's Church: ODEON model, looking towards the west wall and the tower. Again, the sound source is represented by the red sphere, with the grid of receiver positions represented by the arrangement of blue spheres.
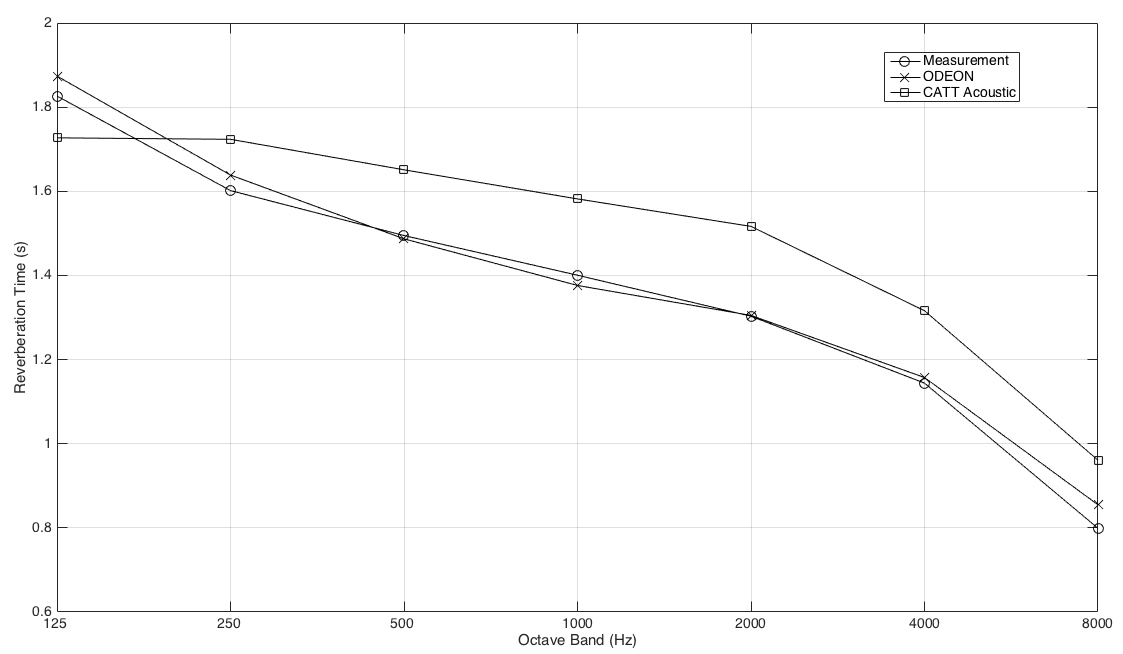
Figure 19: Post calibration reverberation time (RT60), measured in seconds across octave bands from 125Hz to 8000Hz, for St Margaret's Church, York, UK. These values are for the 17th receiver position, with the first configuration of panels/drapes, as derived from impulse responses obtained from acoustic measurements (circles), the corresponding ODEON model (crosses), and CATT Acoustic model (squares).
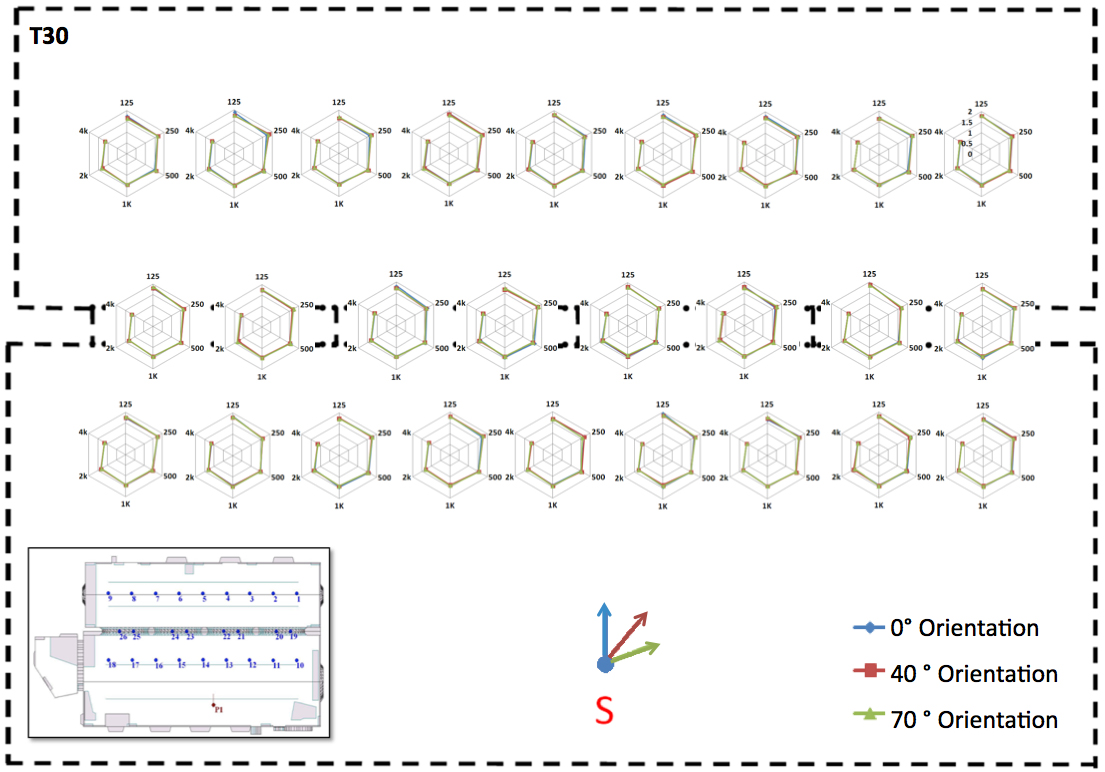
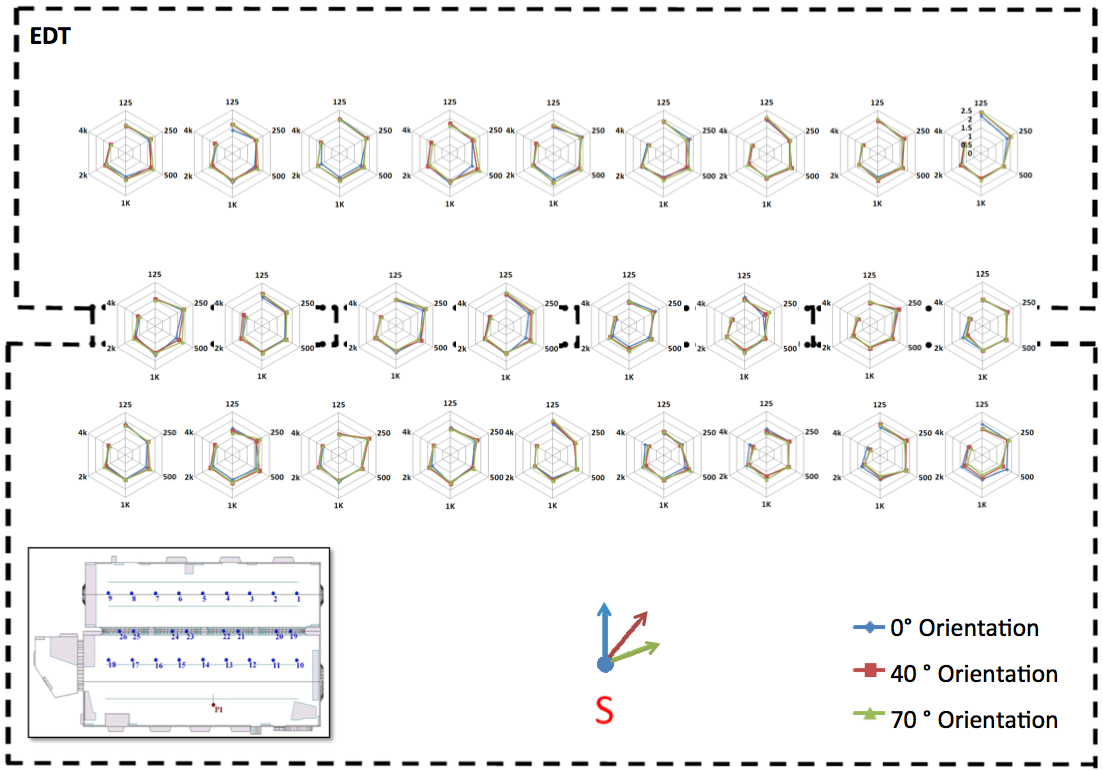
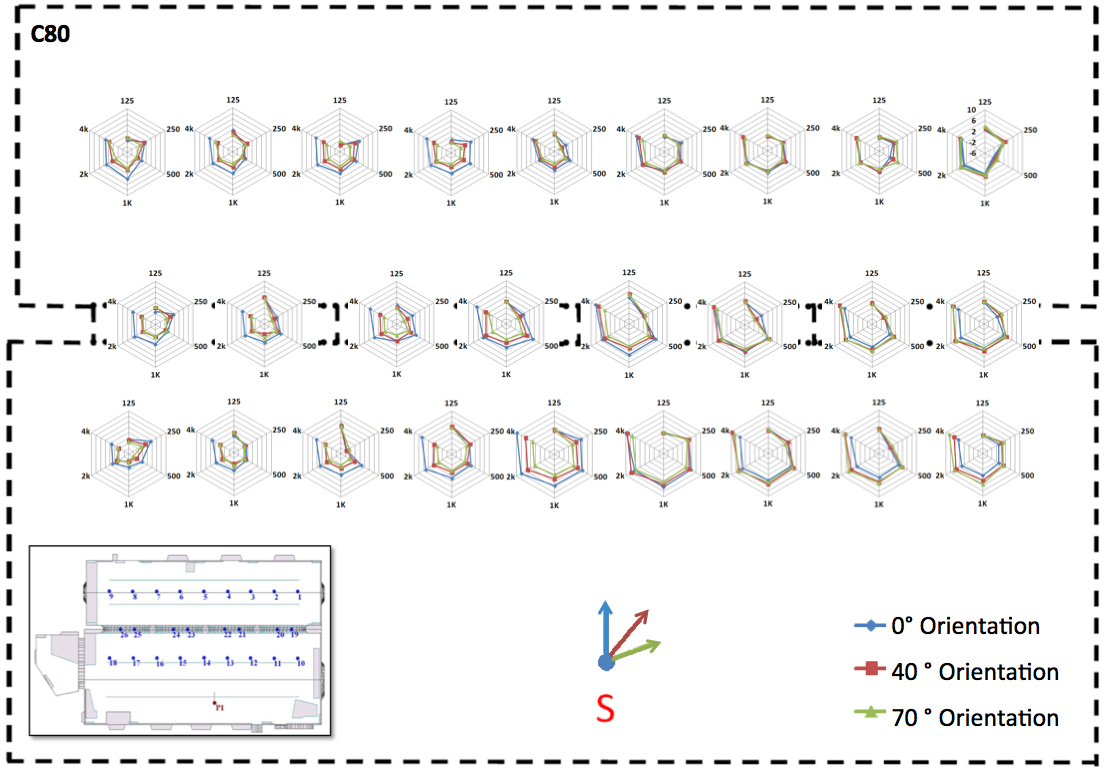
Figure 20: Radar charts represent the values of a given acoustic parameter at each individual measured position clockwise across the 6 octave bands, 125Hz, 250H, 500Hz, 1kHz, 2kHz and 4kHz.
Figure 21: Acoustic floor map of T30 values obtained across the grid of 26 receiver positions, varying with source orientation 0°, 40° and 70°
Figure 22: Acoustic floor map of EDT values obtained across the grid of 26 receiver positions, varying with source orientation 0°, 40° and 70°
Figure 23: Acoustic floor map of C80 values obtained across the grid of 26 receiver positions, varying with source orientation 0°, 40° and 70°
Figure 24: (VIDEO) Temple of Decision is a video installation that investigated the ruin of the Falkland Estate's 19th-century folly, part of which uses auralisation to recreate the acoustics of the building when still intact. The artists David Chapman and Louise K. Wilson voice their thoughts on visiting the Temple and on the stories they heard about the building and its uses. (Video © David Chapman and Louise K. Wilson 2010, used with permission 2016)
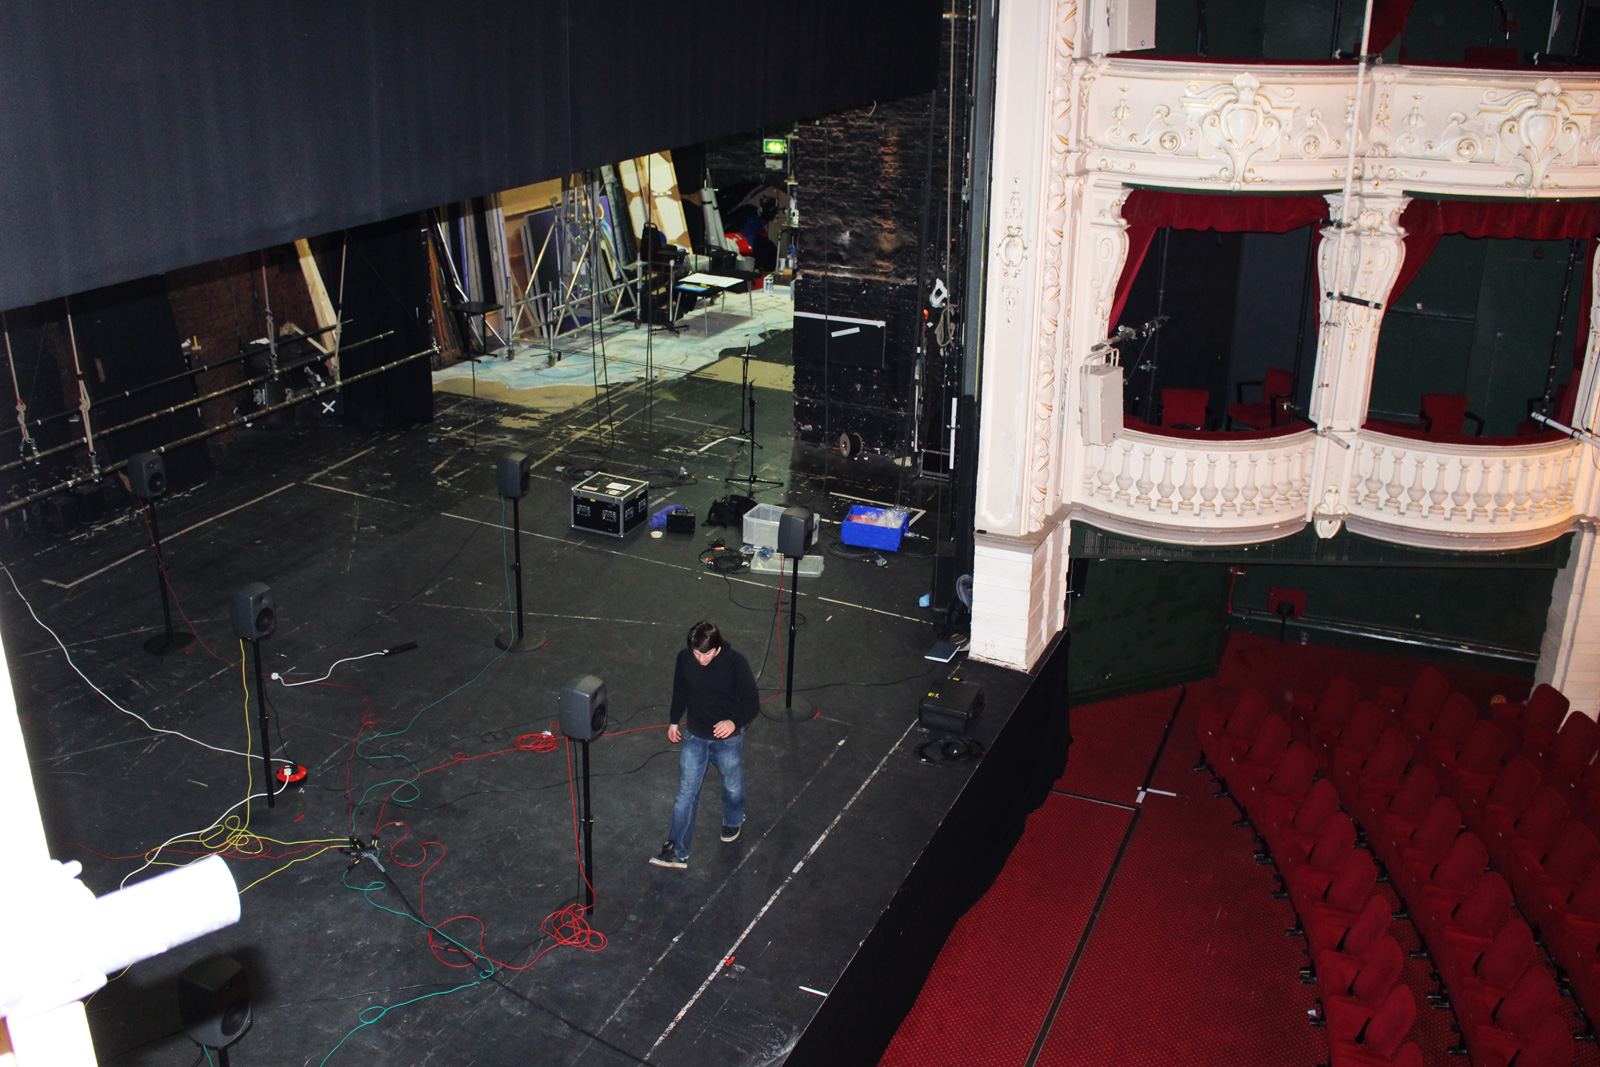
Figure 25: Acoustic measurement work in the pre-refurbishment York Theatre Royal auditorium: Genelec 8040 loudspeakers are used as virtual performers on stage, each of which will be a sound source for the impulse response measurements taken at various audience positions
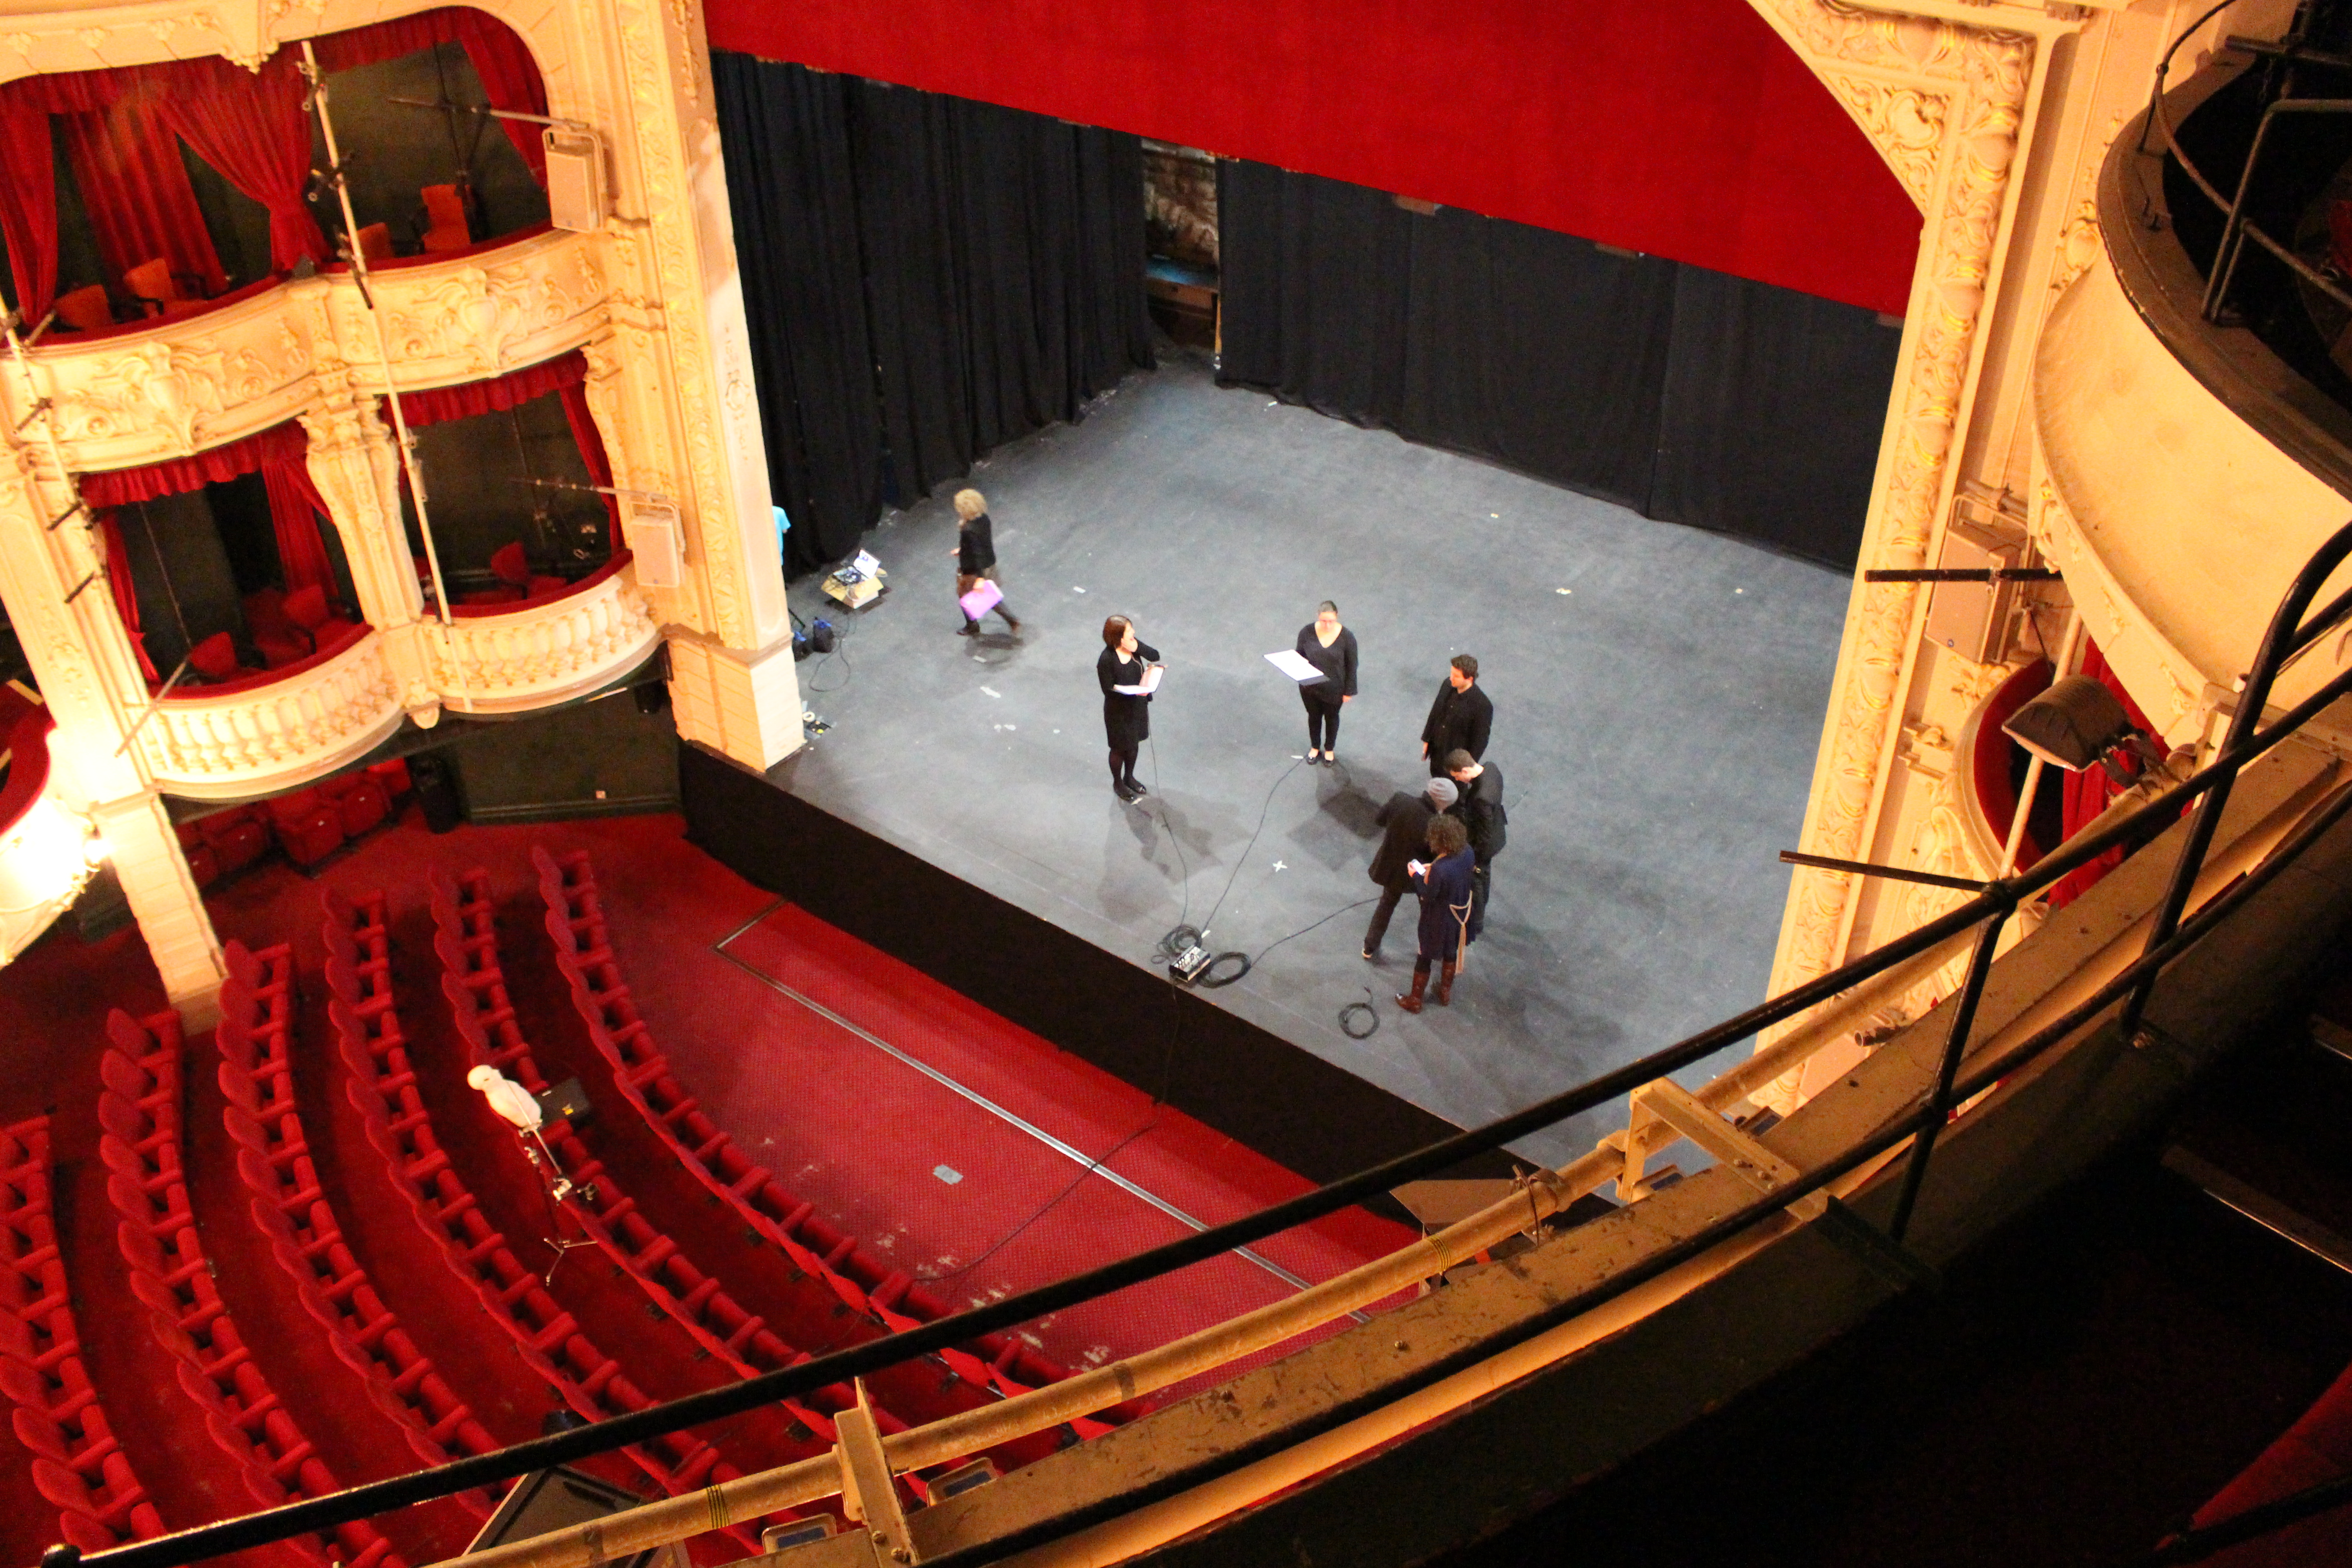
Figure 26: Acoustic measurement work in the pre-refurbishment York Theatre Royal auditorium: real performers are miked up and captured using 360-degee video cameras. The audio recordings made as part of this are used as the source material for a separate auralisation based on the measured impulse response measurements. Auralisation and 360-degree video are then combined to allow the user to select various audience locations and experience the final performance in immersive virtual reality from a number of different perspectives
Figure 27: A visitor to I Hear Too Live listens to the whispered voices of David Chapman's 'Octo: Sotto Voce' installation in the Chapter House of York Minster (Figure 27 © Kippa Matthews 2009, used with permission 2016).
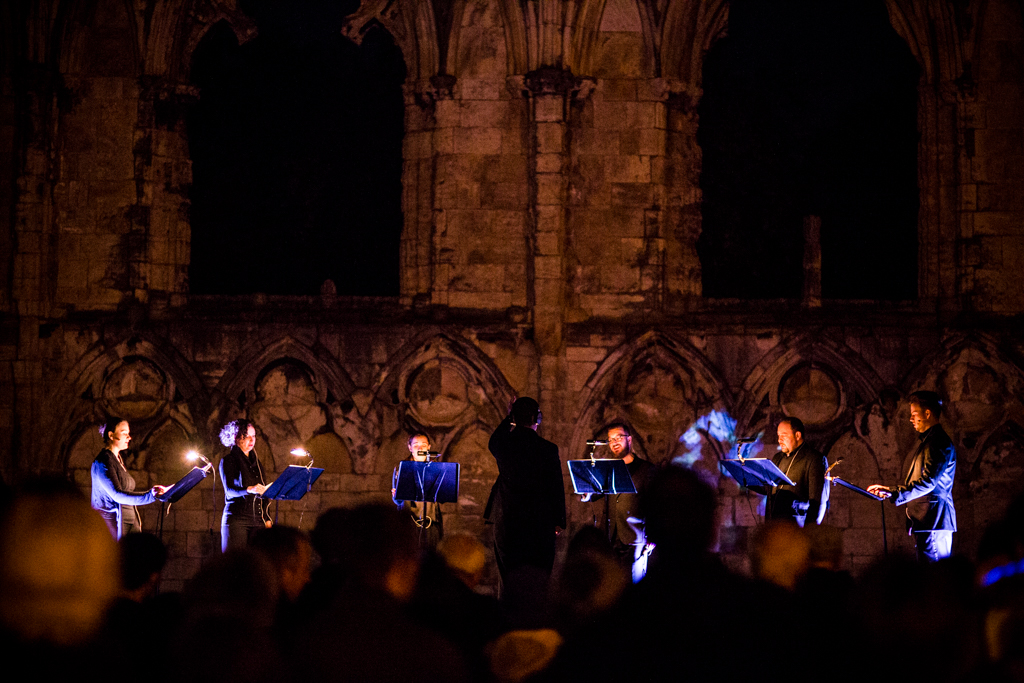
Figure 28: The Ebor Singers perform Ambrose Field's 'Architexture II' within the ruins of St Mary's Abbey Church in Museum Gardens, York. Each singer wore a headset microphone and using interactive auralisation was able to sing their line, tuned carefully to the acoustic properties of the 3D model, through the reconstructed acoustics of the ruined space (Image © Ian Martindale Photography 2015, used with permission 2016).
Sound Example 1: Female soprano, recorded in University of York, anechoic chamber.
Sound Example 2: Impulse response obtained from acoustic measurements of St Margaret's Church, York, UK (17th receiver position, first configuration of panels/drapes).
Sound Example 3: Post calibration impulse response obtained from the ODEON acoustic model of St Margaret's Church, York, UK (17th receiver position, first configuration of panels/drapes).
Sound Example 4: Post calibration impulse response obtained from the CATT Acoustic model of St Margaret's Church, York, UK (17th receiver position, first configuration of panels/drapes).
Sound Example 5: Auralisation obtained from the convolution of Sound Example 1 (Anechoic soprano) and Sound Example 2 (acoustic measurements of St Margaret's Church, York, UK, 17th receiver position, first configuration of panels/drapes).
Sound Example 6: Auralisation obtained from the convolution of Sound Example 1 (Anechoic soprano) and Sound Example 3 (ODEON acoustic model of St Margaret's Church, York, UK, 17th receiver position, first configuration of panels/drapes).
Sound Example 7: Auralisation obtained from the convolution of Sound Example 1 (Anechoic soprano) and Sound Example 4 (CATT Acoustic model of St Margaret's Church, York, UK, 17th receiver position, first configuration of panels/drapes).
Internet Archaeology is an open access journal based in the Department of Archaeology, University of York. Except where otherwise noted, content from this work may be used under the terms of the Creative Commons Attribution 3.0 (CC BY) Unported licence, which permits unrestricted use, distribution, and reproduction in any medium, provided that attribution to the author(s), the title of the work, the Internet Archaeology journal and the relevant URL/DOI are given.
Terms and Conditions | Legal Statements | Privacy Policy | Cookies Policy | Citing Internet Archaeology
Internet Archaeology content is preserved for the long term with the Archaeology Data Service (ROR). Help sustain and support open access publication by donating to our Open Access Archaeology Fund.