Cite this as: Lauwerier, R.C.G.M. et al. 2018 A Toolbox for Archaeological Heritage Management. Maps, Methods and More for Effective and Efficient Selection of Valuable Archaeology, Internet Archaeology 49. https://doi.org/10.11141/ia.49.8
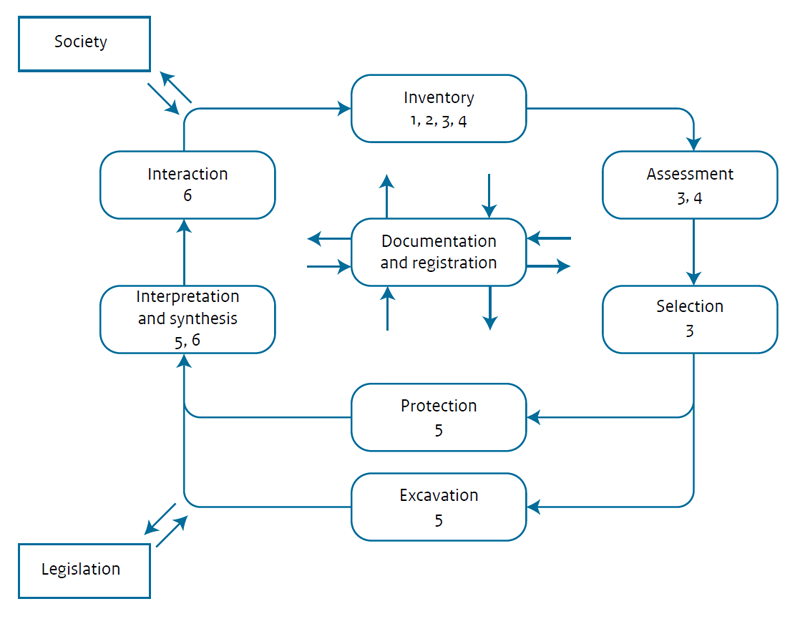
Archaeological heritage management benefits from well-informed and transparent decision-making. With the aim of providing 'knowledge for informed choices', a series of tools have been developed for archaeological heritage management in the Netherlands (Lauwerier et al. 2017). They include digital maps, datasets, methods, guidelines, best practice and web-based applications and relate to archaeological predictions, disturbances by agriculture and other activities, archaeological heritage maps, prospection methods, research questions, and scientific syntheses to close the archaeological heritage management cycle (Figure 1). The tools were developed as part of the Cultural Heritage Agency's 'Archaeology Knowledge Kit' programme, in response to an evaluation of archaeology legislation that entered into force in the Netherlands in 2007, implementing the Valletta Convention (Lauwerier 2017). The evaluation concluded that though many things are going well in archaeological heritage management, there are several points that are open to improvement. The State Secretary for Education, Culture and Science therefore commissioned a series of improvement activities.
Some of these activities have been performed as part of the 'Archaeology Knowledge Kit' programme. This development programme aimed to provide knowledge to facilitate the effective and efficient selection of valuable archaeological remains in the process of archaeological heritage management. Much of this knowledge is particularly important for local authorities, as it enables them to take archaeological interests more fully into account in spatial planning and development. It fits into the 'Dare to Choose' theme of the EAC's Amersfoort Agenda, in particular the items about being conscious, explicit and transparent about choices, and about the development of a sound infrastructure to support the making of informed choices (EAC 2015).
Six subjects relating to the various parts of the archaeological heritage management cycle were the focus of several projects (Figure 1):
Although analogue products have also been produced, the goal was to make the products of these projects available online as far as possible, via a single website of the National Heritage Agency functioning as a central portal.
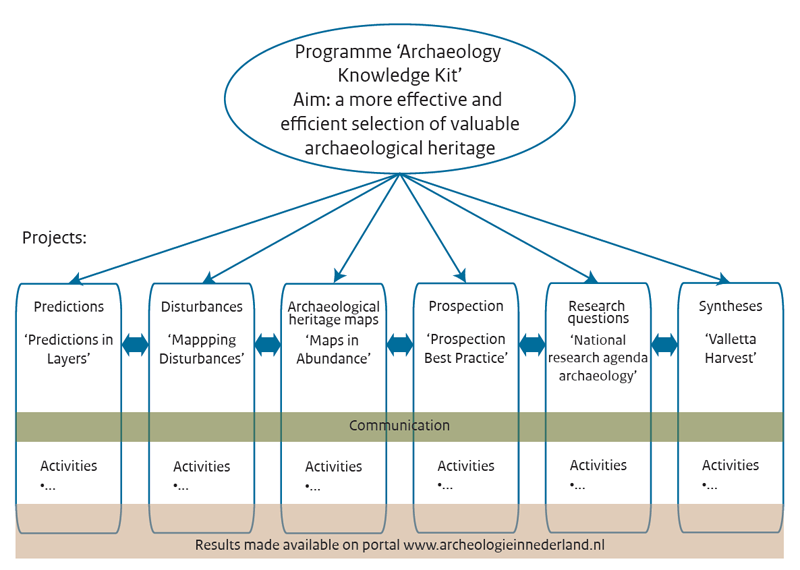
To achieve and preserve coherence between the different actions performed as part of the projects, a programmatic approach was chosen (Figure 2). This approach gained a number of advantages: (1) it raised the quality of the products thanks to the rapid, organised sharing of knowledge and experiences, on matters both of substance and of organisation; (2) it promoted collaboration and enhanced the efficiency of project implementation; (3) it made working on the programme a pleasant experience, thanks to the formal and informal sharing of ideas and experiences. Projects were set up on the basis of the project-driven creation principle. The programme objective — a more effective and efficient selection of valuable archaeological remains — was one of the principles guiding the design of projects. The Agency had overall responsibility for the programme, but implementation occurred in collaboration with local authorities, archaeological agencies, universities, other research institutions, a national farmers' organisation amongst others.
This article gives an impression of the products developed to provide 'knowledge for informed choices'. A full report on the backgrounds, aims, methods, results and products delivered is given in the publication 'Knowledge for Informed Choices. Tools for more effective and efficient selection of valuable archaeology in the Netherlands' (Lauwerier et al. 2017).
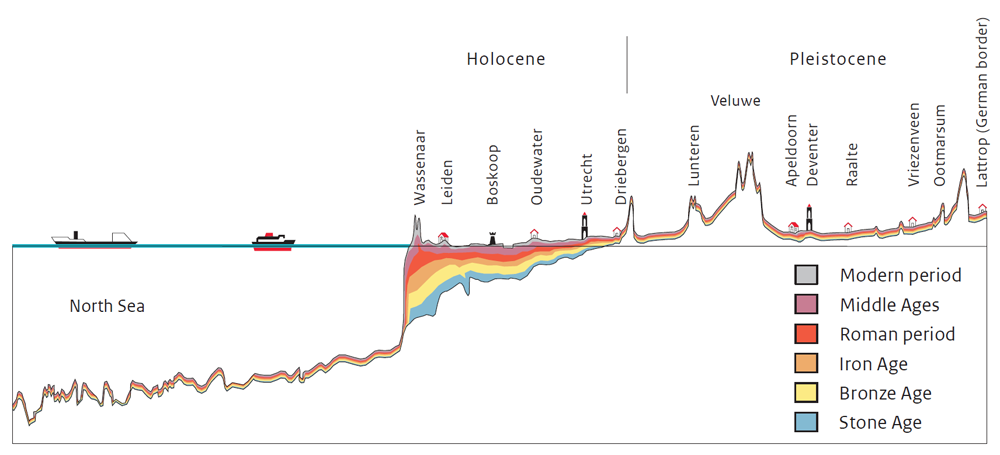
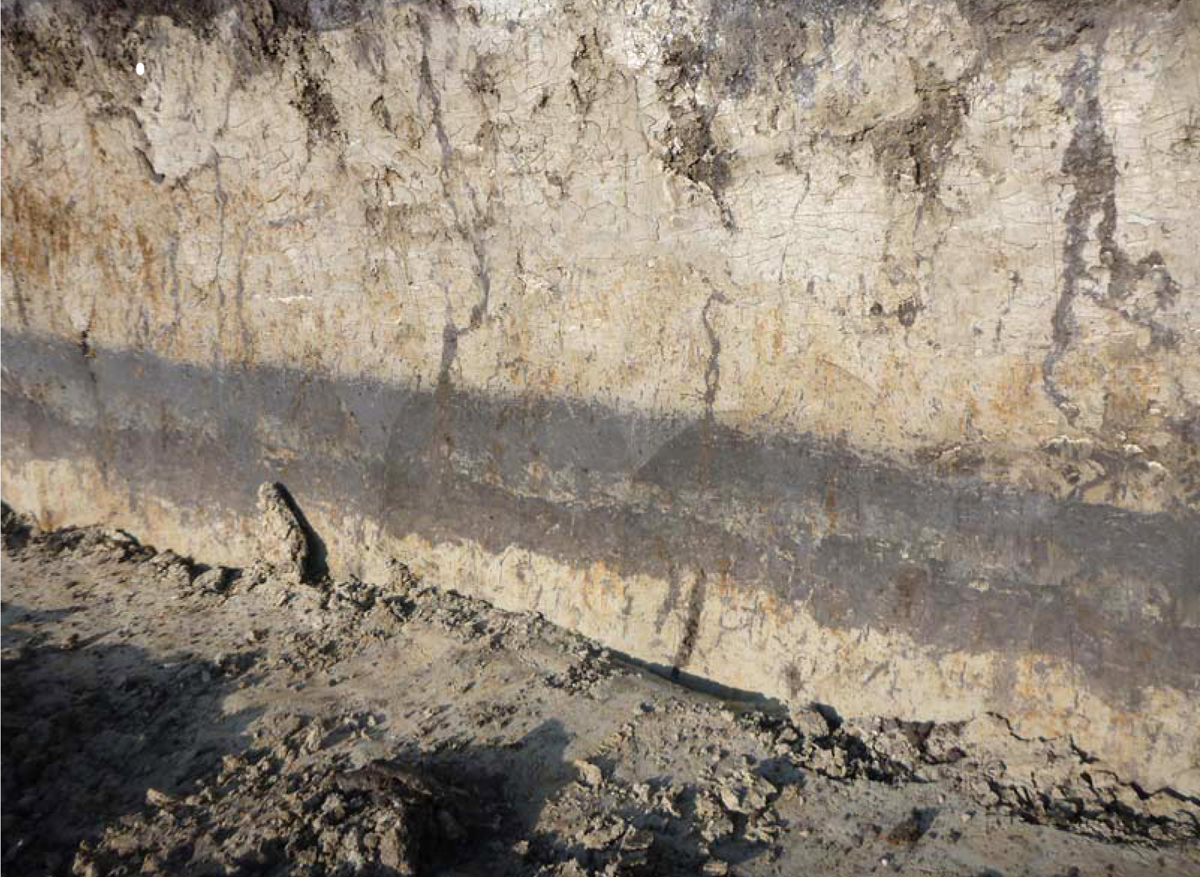
The specification of archaeological predictions is an important step in archaeological heritage management in the context of spatial developments. In the Netherlands, both national and local predictive archaeological maps are used for this purpose. These maps generally present probability categories — high, medium and low, for instance — for the presence of archaeological remains. However, they often fail to distinguish the archaeological period or the depth at which the remains might lie, despite the fact that there are considerable differences in the depth at which remains from different periods are likely to be found. In the Holocene part of the Netherlands, for example, archaeological remains from early periods can lie as deep as 15-20m below the surface (Figure 3).
To provide an insight into the depth of archaeological remains, categorised by period and landscape zone, a web-based application 'Landgebruik in Lagen' (Land Use in Layers) has been developed (Smit and Feiken 2017). It presents information about different types of land-use in different periods on the basis of four themes: settlement, burial customs, ritual practices, and economy and infrastructure. Past activities are all related to some extent to the landscape of that specific time. The landscape features from these different periods that remain on or below the surface of the Netherlands have been modelled and archaeological information has been incorporated into the models. The models also indicate the depth below the present surface at which these buried landscape features lie.
To offer information covering the entire country in a single application, a number of parameters and basic principles were set out at the start, to bring together, integrate and generalise the enormous variety of archaeological and landscape information available. Firstly, the occupation history of the Holocene was simplified into four periods: hunter/gatherers and early farmers (until 3400 BC), early farming societies (3400-1500 BC), late farming societies (1500 BC to AD 900) and state societies (AD 900 to 1950) (Groenewoudt and Smit 2017). This simplification was based on similarities and differences in subsistence methods in the past, and the nature of the archaeological remains from the different periods. The different types of activities performed in the past have also been summarised into four land-use themes: settlement, burial, ritual practices, and economy and infrastructure (Rensink and Van Doesburg 2017). These themes allow a generalised but more or less comprehensive overview of activities in the past to be presented. Information on the development of the landscape in the past, in the form of geogenesis, was used to present an overall impression of land-use.
Landscape units on the geomorphological map were used to relate land-use models to the landscape. For this purpose an 'Archeologische landschappenkaart' (Archaeological Landscapes Map of the Netherlands) was made (Rensink et al. 2017a). Buried landscape units were mapped and used in this project to locate different kinds of land-use in earlier periods (Cohen et al. 2017). This digital map with information on the Netherlands' coastal and delta plain landscapes over the last 14,000 years was produced in a geological GIS-data recombination project. The polygon map is accompanied by a set of palaeoDEMs (Digital Elevation Models) indicating the attention depth for buried land surfaces and aquatic deposits for four time slices. Both the Archaeological Landscapes Map and the subsurface maps can also be used separately from the Land Use in Layers application.
When the user opens the Land Use in Layers application they are invited to zoom in on the desired research area and landscape zone. The user then chooses a period and theme by ticking the options. Once this series of choices has been made, the application automatically presents the land-use model and references further information sources pertaining to the area, landscape zone, period and theme. A click on a landscape zone reveals the depth of the landscape zone in question. This information is presented in a pop-up.
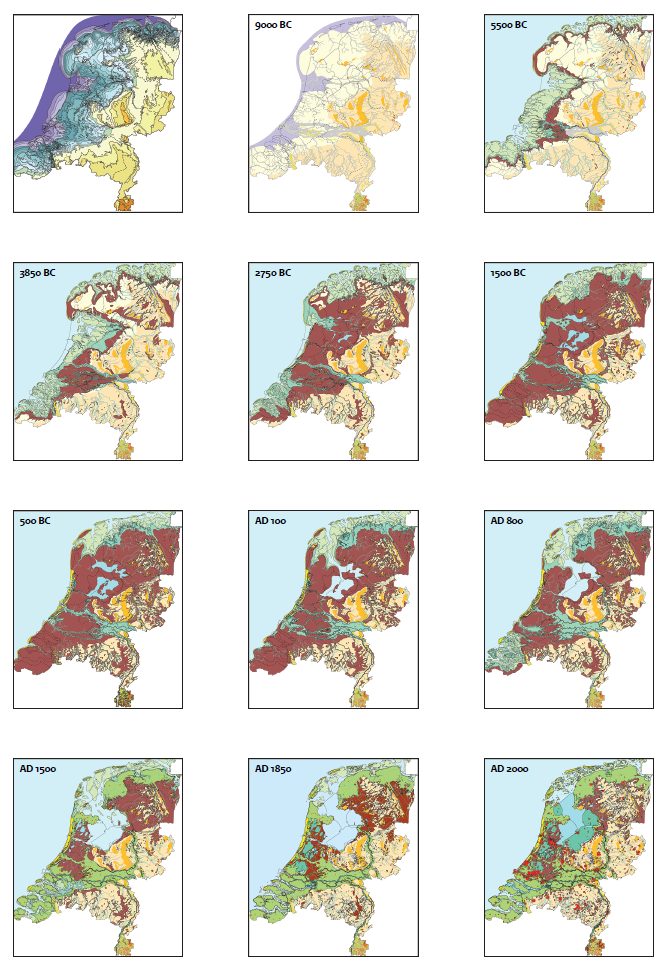
As part of the Predictions in Layers project, research institute Deltares produced 12 (revised) palaeogeographical maps of the Netherlands at different points in the past (from 9000 BC), with an explanation of the methods and sources used (Figure 4; Vos and De Vries 2017). These partly buried landscapes could be reconstructed with the help of geological, historical and archaeological data. The maps are available both as GIS and as pdf.
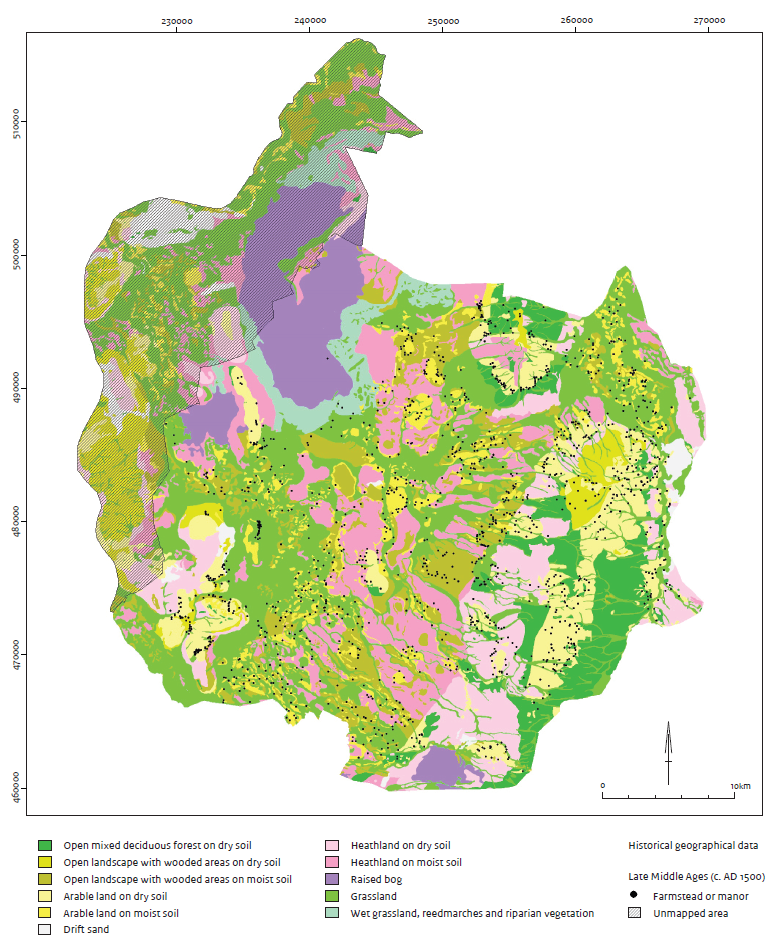
A palaeovegetation study offered a regional and diachronic perspective on the development of the landscape, vegetation and habitation of the Twente region of the Netherlands since the Late Glacial (Van Beek et al. 2017). A series of 6 evidence-based regional vegetation maps were constructed by analysing relationships between pollen data, soil data and topography (Figure 5). The maps serve as first-stage generalised models that predict regional trends in vegetation development and land-use, and will allow for subsequent testing and place site-specific archaeological data in a wider context. The method developed is applicable to other regions. A comparison with contemporary habitation patterns, based on archaeological and historical data, reveals spatio-temporal trends in human influence on vegetation and in physical factors influencing site location. Five maps have also been 'translated' into artist's impressions.
In a pilot project, an attempt has been made to produce a predictive archaeological model for the urban periphery (or 'urban countryside') based on the historical town maps produced by Jacob van Deventer in the second half of the 16th century (Bouwmeester 2017). The maps of the towns of Alkmaar, Deventer and Nijmegen have been analysed, and all the different built sites featured on the maps around the towns categorised. The nature of the sites and their distance from the town walls has also been determined. On this basis, the urban countryside can be divided into three zones. The further the distance from the town, the lower the diversity and number of archaeological sites will be (Table 1). Access to roads and waterways was also an important factor in choice of location.
| Zone | Site type | Number | Total number per zone |
|---|---|---|---|
| Zone 1 (0-600 m) | habitation site | 6 | 132 |
| gallow | 2 | ||
| horreum | 5 | ||
| house | 61 | ||
| church | 3 | ||
| monastery | 1 | ||
| cross | 5 | ||
| leper house | 1 | ||
| pillory | 6 | ||
| drying grounds | 1 | ||
| watermill | 5 | ||
| windmill | 35 | ||
| Zone 2 (600-1300 m) | habitation site | 2 | 51 |
| gallows | 2 | ||
| house | 42 | ||
| castle | 1 | ||
| church | 1 | ||
| monastery | 1 | ||
| cross | 1 | ||
| windmill | 1 | ||
| Zone 3 (>1300 m) | house | 4 | 6 |
| monastery | 1 | ||
| leper house | 1 |
Although 'the developer pays', the soil may, in some cases, already have been seriously disturbed as a result of large-scale soil excavation or agricultural activity so that the integrity and information value of any archaeological remains is very low (Figure 6). If this is the case, it makes no sense to invest in (further) archaeological investigation. In cases like this, landowners can be exempted from the obligation to perform an archaeological investigation. Farmers, in particular, are pressing for better information on soil disturbance. Archaeology beneath buildings may also be disturbed, however. Another objective of the Mapping Disturbances project is to explore the relationship between soil disturbance and the information value of archaeological remains.
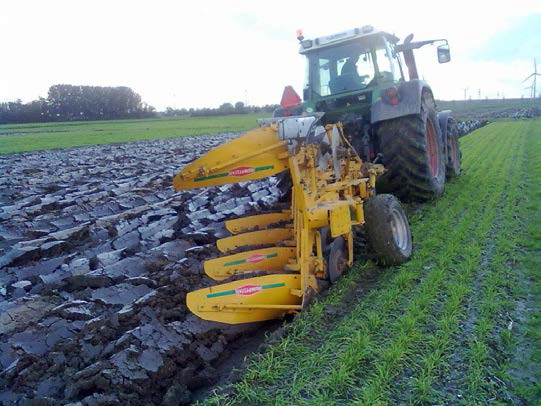
Annual tillage for most crops grown in arable farming, outdoor vegetable production and fodder production affects only the top 30cm of the soil (Van Reuler 2017). Ploughing is usually deeper (30-45cm) for flower bulb production. The soil is always worked down to a considerable depth for some vegetables grown on limited areas of land, such as asparagus. The soil can also been disturbed by non-crop-related deeper tillage, which is usually performed during crop rotation. Deep tillage also occurs occasionally on land used to grow flower bulbs, and at tree nurseries and fruit orchards, where it is the lifting of trees that disturbs the soil. When some crops are harvested, soil is removed from the land with the produce. This is particularly true of potatoes, sugar beet, carrots, flower bulbs (lilies) and a number of nursery trees. Farmers also take measures to prevent soil disturbance. More and more is being invested in measures to prevent compaction, so that compacted layers no longer need to be broken up from time to time. An agricultural entrepreneur will also generally strive to achieve a sustainable cultivation layer, so will take measures to prevent fertile soil from being lost. Nevertheless, the trend towards renting plots of land for only a few years for different crops, necessitating intensive tillage and/or causing the removal of large quantities of soil, is a worrying development.
To obtain more insight into soil interventions, an inventory of national and regional datasets containing information on places that may be disturbed was compiled (De Vries and Maas 2017). This resulted in the 'Verstoringsbronnenkaart', (Sources of Disturbance Map) a digital geographical map with national and regional datasets. The overview available in GIS shows the area to which each dataset refers and contains meta-information concerning the type of information in the dataset, how recent and detailed the information is, and whether it is possible to derive information about soil disturbance from it.
No suitable method currently exists for estimating the probability that the soil in a particular plot has been disturbed. To address this shortcoming, three parties in different sectors — a specialist archaeological agency, an agricultural university and a farmers' association — were asked to develop a model (map) for estimating the probability of disturbance of the soil and apply it in a test area (Lascaris and Huisman 2017). The results of the three studies were then discussed with a group of experts with knowledge and experience of soil disturbance and archaeology. It was concluded that it is not yet possible to derive a new standard to assess soil disturbance (integrity). Nevertheless, the study has produced a whole range of insights that may be useful in the further development of methods for identifying the probability of soil disturbance.
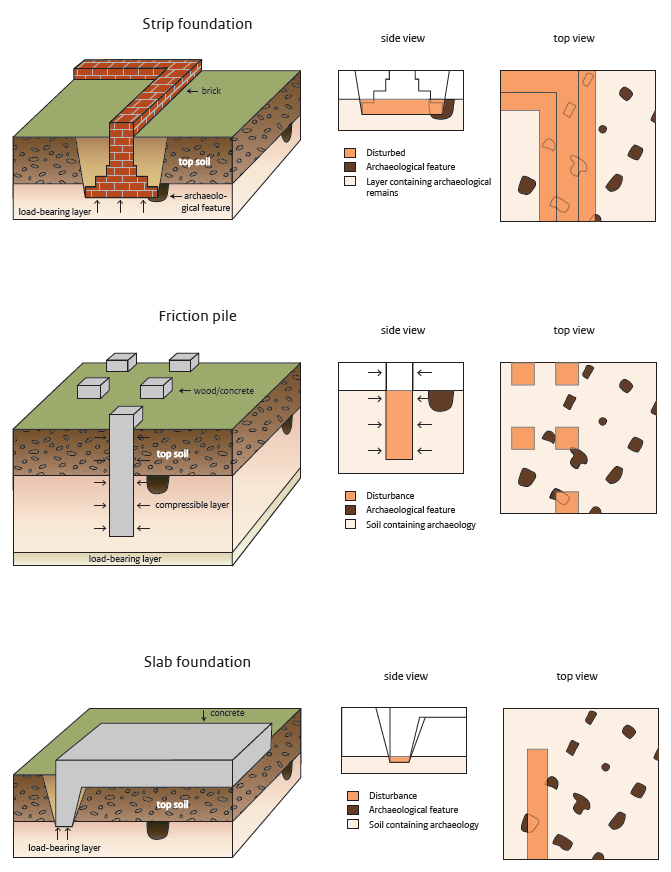
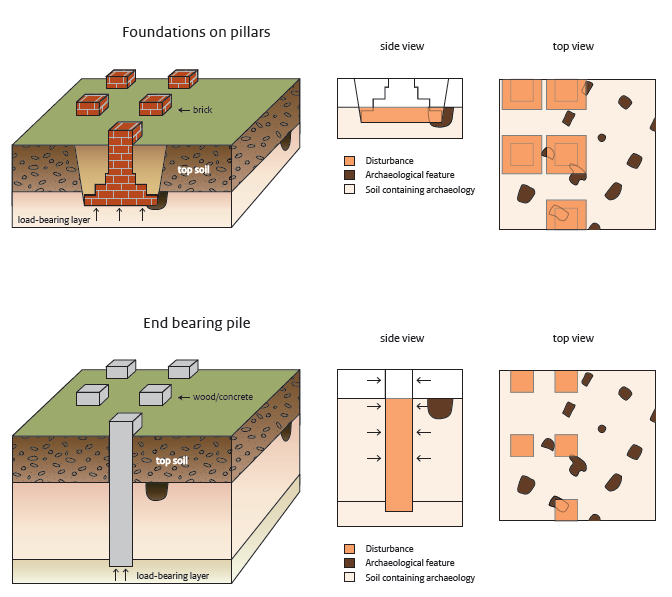
A significant proportion of the Netherlands is built-up. Well-preserved archaeological remains may still be present in these areas. Both the nature of this subsurface archaeological resource and the nature of the disturbance resulting from construction work differ from those common in rural areas. A study has been conducted of disturbance in built-up areas, focusing on the new neighbourhoods built in urban expansion projects since 1875 (Bouwmeester, Abrahamse and Blom 2017). The study distinguished between predicting disturbance at neighbourhood level — related to the density of buildings, for example — and the disturbances themselves, caused for instance by the digging and laying of foundations (Figure 7). Knowledge of the extent and depth of soil disturbance can lead to a more responsible and efficient approach to archaeological remains, thus reducing costs for developers and builders. The initial conclusion is that intact archaeological remains can be found under neighbourhoods, and that a thorough knowledge of disturbance caused by the layout and construction of a new neighbourhood can help predict the actual disturbance to those remains.
For years, archaeologists have been debating the right way to detect archaeological find spots in the varied landscape of the Netherlands (see Rensink et al. 2017b). And rightly so, for prospection is the foundation of archaeological heritage management. Despite the fact that a great deal of experience has been gained with archaeological prospection in the Netherlands over the past few decades, choosing the most suitable method is by no means easy or obvious. Every prospection method has its own applications, potential and limitations.
Several prospection methods are used in the Netherlands: non-destructive methods as visual inspection, fieldwalking and geophysical survey, and destructive methods like borehole survey, test pit survey combined with sieving, trial trench survey and metal-detecting. To help choose an appropriate method within the Prospection Best Practice project, a digital information system known as 'Prospectie op Maat' (Prospection Made-to-Measure) has been made (Rensink et al. 2017b). The application recommends the most appropriate method or combination of methods for locating and assessing archaeological sites, given the landscape and the predicted archaeological remains.
To use the Prospection Made-to-Measure application, the user starts with the specified prediction resulting from the desk-based assessment of the area in question. Seven (expected) characteristics of the find spots are relevant:
The Prospection Made-to-Measure system uses the selected options to recommend the best way to locate find spots (for example a borehole survey) and verify the specified archaeological prediction (for example a trial trench survey). The detailed recommendation option provides the user of the system with further information, including a brief explanation of the proposed method or combination of methods (research module) and points to consider ('nuances'). The detailed recommendation also includes references to the Dutch Archaeology Quality Standard, incorporated in the Assessment Guideline Archaeology (SIKB 2016) and practical examples in the form of standard reports of archaeological field evaluations.
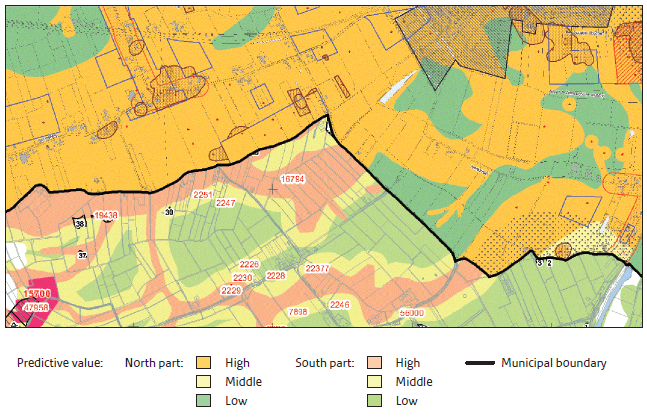
In the Netherlands, local authorities (390 municipalities) are responsible for archaeological heritage management within their boundaries. Since 2007, virtually all local authorities have made, commissioned to make or used archaeological resource maps, predictive archaeological maps and archaeological policy maps to help them meet this responsibility. The maps are produced by archaeologists working for the municipalities or regions as well as commercial archaeological agencies. However, the decentralised responsibility also has led to major differences between these maps (Figure 9). As long as they are used only within the municipality itself, this should not be a problem. But as soon as special developments arise that affect more than one municipality — such as large infrastructural projects for which maps of several municipalities have to be compared and combined — problems occur. The differences between maps also cause doubt about the reliability of archaeological heritage management. Therefore the Maps in Abundance project was conducted to identify the scale of, and analyse the problems associated with local authority archaeological maps, and make recommendations as to how the maps can be better coordinated and adjust to one another in the future (Van Doesburg et al. 2017a).
The maps in use were systematically gathered: a total of 1666 maps and 611 accompanying reports. To provide better access to this information, the maps were made accessible online via links on a map of the Netherlands. Subsequently national overviews of each type of map were produced.
The analysis of the maps from four pilot areas spread across the country brought to light the differences and its causes (Van Doesburg et al. 2017b). For example, the predictive archaeological maps are based on predictive modelling combined with expert judgment. However, it is often unclear what predictions are actually based on. It was found that, when maps are fitted together, they do not match well in terms of either visual presentation, form or content (Figure 9). The discrepancies are associated with the almost complete lack of overall detailed guidelines for map production, differences in the predictive models used, the sources consulted, the design and conditions imposed by the authorities commissioning the maps, as well as the financial resources available. Central government is therefore keen to encourage local authorities to ensure that future maps are more compatible. We therefore welcome a recent initiative of a group of commercial agencies to create a joint guideline for the production of local archaeology maps.
Most Dutch archaeologists would agree that archaeological investigations require focus. Focus implies making explicit choices, also concerning the objectives of these investigations. More than ten years after publication of the first edition, a new version of the 'Nationale Onderzoeksagenda Archeologie 2.0' (National Archaeological Research Agenda 2.0) was launched in April 2016 (Groenewoudt et al. 2017). This agenda, like its predecessor, is a joint product of the entire archaeological community in the Netherlands, and is designed to feed and guide development-led archaeology, providing topical and relevant research questions. This is essential in order to maximise the benefits — both to science and to society — of archaeological research.
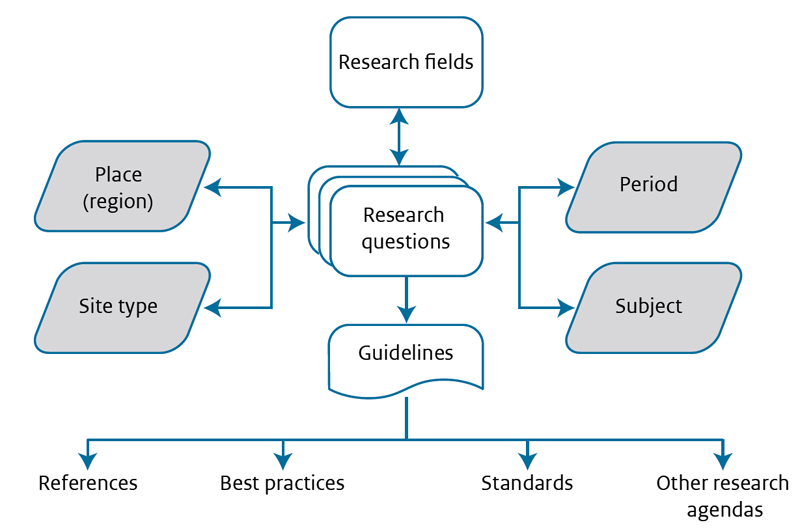
The National Archaeological Research Agenda 2.0 provides a current overview of only the most important national (supraregional) archaeological questions, focusing specifically on field archaeology. It has the form of an online search engine with a modular structure (Figure 10). The system has two layers: a research fields (like 'social differentiation' or 'neolithisation process') layer and a research questions layer. The research questions are the modules. They are in fact blocks of text containing research questions (100-150); context information: research fields (20-25); and guidelines for translating questions into fieldwork (100-150). Each research question includes a number of references, sources that relate to the underlying theory or can serve as inspiring practical examples and methods. The research questions can be accessed via four search filters: place (archaeological region), period, subject and site type. The more search options are used, the more specific the results of the search.
The research questions and use of the agenda are critically examined every year; the database of questions etc. that forms the basis of the National Archaeological Research Agenda system is easy to alter. Users may report shortcomings and suggest improvements.
After the Archaeological Heritage Management Act came into force in 2007 and with the introduction of development-led archaeology, the number of archaeological investigations increased sharply. They were increasingly performed by commercial agencies, whose numbers were growing. By contrast, academic archaeology was dwindling (Groenewoudt 2015). This led to a huge backlog of synthesising studies on the steadily growing stacks of archaeological reports. The evaluation of Dutch archaeology legislation in 2011 revealed that there had been insufficient interpretation and scientific synthesis of development-led archaeological research, and that such research was therefore not producing enough new insights into the past (Van der Reijden, Keers and Van Rossum 2011).
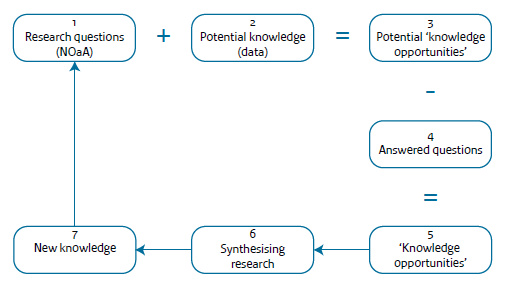
As a reaction to this problem, the Valletta Harvest project aimed to synthesise the results of development-led archaeological research to produce new knowledge about the history of the Netherlands (Eerden et al. 2017). Apart from providing new knowledge of the past, such syntheses also provide input for new questions in the archaeological research agenda. In addition these new insights will allow more accurate archaeological predictions to be made, on which archaeology policy can be based.
The areas, themes and archaeological periods that were the subject of the most reports were examined. Questions from the national archaeological research agenda were then selected that could potentially be answered on the basis of those reports. These are referred to as 'knowledge opportunities'. In the first phase, a top-down approach was adopted to define knowledge opportunities. Major, undisputed opportunities for synthesising research were identified. Any that had already been taken up by universities or in other contexts were removed from this longlist. The most promising were then selected on the basis of expert judgment. In phase two, knowledge opportunities were identified in accordance with a bottom-up approach. The most promising opportunities for gaining knowledge on the basis of basic archaeological reports were identified by a systematic analysis in five steps (Figure 11):
The studies were performed by agencies, local authorities and universities. At this stage, four geographical, three chronological and four thematic synthesising studies have been initiated and published. Finally, we took provisional stock on the basis of the results and discussions with fellow archaeologists, assessing what we have learnt so far about the scientific synthesis of development-led research reports, and defining recommendations to improve excavation practice and reporting.
Various products planned in 2012 to facilitate effective and efficient selection of valuable archaeological remains have now been delivered and made available to the archaeological community. During the research and development process, some aims were achieved more or less as envisaged, such as the national research agenda, the 'Prospection Made-to-Measure' application and the syntheses based on excavation reports. Other products eventually took a different form from that envisaged at the outset, though they fulfil the same aims (the disturbances and predictions applications, and the accessibility of local authority archaeological maps). The programme has also yielded some 'by-products' that were not initially planned, such as the archaeological landscapes maps and the simplified general classification of archaeological periods. These were necessary in order to deliver other products, but have also proved very useful in themselves. Other spin-offs include studies or developments by third parties related to the subjects of the projects which were realised thanks to financial contributions from the programme. Examples include the revised palaeogeographical maps and the vegetation reconstructions based on pollen data. By producing syntheses and serving the public, neither of which is stipulated in the legislation, we have helped close the gap in the archaeological heritage management cycle. In terms of output, therefore, the programme may be regarded as a success.
However, what is more important is whether the products are used, whether they are regarded as useful, and above all, whether they facilitate the most effective and efficient selection of valuable archaeological remains in the process of archaeological heritage management. Initial reactions have been positive, and we actively stimulate use, but an evaluation one year on should provide more information, so that products can be further improved and adapted to the way they are used and to the users. The results to date and the experience gained during the implementation of the projects have now led to a follow-up which will further develop and raise the profile of various products, and put into action new plans in line with the programme's objectives.
The organisational form — a coherent programme within which there is collaboration between projects that clearly have some overlap — appears to have been successful. This has been enhanced by the fact that the projects were staffed by people from different parts of the organisation: researchers, advisers and communications officers. This produces better exchange and input of knowledge and information, enabling more effective working and undoubtedly raising quality. It is also a pleasant way to work.
The delivery of the results does not mean we are done. In March 2014, for example, a symposium of the European Archaeological Council (EAC) took place in Amersfoort. The central aim of the symposium was to set out a strategic agenda to meet the current challenges facing archaeological heritage management in Europe (Schut, Scharf and De Wit 2015). This agenda, which builds on the Valletta Convention and the Faro Convention (Council of Europe 2005), is based on three themes: Embedding Archaeology in Society, Dare to Choose, and Managing the Sources of European History. One of the challenges in the follow-up to the Archaeology Knowledge Kit programme will be to contribute to the further development of these themes.
Internet Archaeology is an open access journal based in the Department of Archaeology, University of York. Except where otherwise noted, content from this work may be used under the terms of the Creative Commons Attribution 3.0 (CC BY) Unported licence, which permits unrestricted use, distribution, and reproduction in any medium, provided that attribution to the author(s), the title of the work, the Internet Archaeology journal and the relevant URL/DOI are given.
Terms and Conditions | Legal Statements | Privacy Policy | Cookies Policy | Citing Internet Archaeology
Internet Archaeology content is preserved for the long term with the Archaeology Data Service (ROR). Help sustain and support open access publication by donating to our Open Access Archaeology Fund.