Although the re-analyses in Sections 4.1 and 4.2 have shown that differences in alumina concentrations between the 18th and 20th Dynasties are potentially related to glass recycling, this does not explain why the alumina levels are generally higher in cobalt glass (i.e. alumina >1.2%) compared to other colours, i.e. all colours were presumably re-melted and reworked and were therefore subject to similar amounts of contamination from crucibles and furnaces. This is now investigated through re-analysing compositional data from the cobalt-blue frit recovered from Amarna O45.1.
The compositions of the cobalt frit found at Amarna are difficult to compare directly with the pXRF or LA-ICPMS data in Figure 6, Figure 7, Figure 11 and Figure 12, because the frit samples were measured using a different technique (WDS). The compositional ranges from WDS were: CoO: 0.14-0.28% (average = 0.2%); MnO: 0.1-0.4% (average = 0.2%); Al2O3: 2.3-4.7% (average = 3.1%) (note: NiO and ZnO were not measured). Nonetheless, the highest cobalt level found in the 18th Dynasty cobalt glasses described was 0.18% (average 0.1%CoO), which is lower than the frit found at Amarna site 045.1 and is consistent with the addition of a concentrated colourant in the form of a glass frit to a base glass. In effect, the cobalt concentrations in the frit measured by WDS frit support the premise that it can be considered as a vitreous concentrated cobalt additive.
Table 2 shows the full composition of the frit (n = 11) that was recorded by Tite et al. (1998), as well as averages presented in later publications (e.g. Tite and Shortland 2003). Despite differences in the average results (discussed below), the compositional data clearly shows that the frit found at Amarna has much lower soda and lime concentrations, as well as higher silica than the glass found at the same site. Moreover, the coefficient of variation is high for some of the compositional components measured, in contrast to the quite standardised recipes for making glass. However, the coefficient of variation for silica is quite low (CV: 3.8%).
| n=11 | Na2O | MgO | Al2O3 | SiO2 | P2O5 | K2O | CaO | TiO2 | MnO | FeO | CoO | CuO | SnO2 | PbO |
|---|---|---|---|---|---|---|---|---|---|---|---|---|---|---|
| mean (%) | 8.57 | 1.44 | 3.14 | 83.21 | 0.04 | 0.38 | 2.10 | 0.12 | 0.24 | 0.46 | 0.2 | 0.02 | 0.02 | 0.02 |
| st.dev. | 2.13 | 0.52 | 0.76 | 3.15 | 0.05 | 0.21 | 1.66 | 0.10 | 0.09 | 0.22 | 0.05 | 0.01 | 0.06 | 0.04 |
| CV (%) | 24.8 | 36.5 | 24.1 | 3.8 | 138.7 | 56.0 | 79.1 | 83.1 | 39.1 | 46.5 | 24.4 | 67.4 | 331.7 | 222.5 |
| mean (%) | Na2O | MgO | Al2O3 | SiO2 | K2O | CaO | TiO2 | MnO | FeO | CoO | CuO |
|---|---|---|---|---|---|---|---|---|---|---|---|
| Frit | 8.7 | 1.4 | 3.3 | 84.4 | 0.4 | 0.7 | 0.14 | 0.28 | 0.5 | 0.21 | 0.00 |
| Glass (n=24) | 19.6 | 4.3 | 2.5 | 63.8 | 1.0 | 7.6 | 0.08 | 0.20 | 0.6 | 0.13 | 0.18 |
As a glass, frit has a very unusual composition. It neither contains significant amounts of magnesia nor potash, which is generally the signature of the use of a soda-rich plant ash as a flux. Furthermore, the burning of halophytic plants (those adapted to growing in a saline environment) from the desert, or from a brackish water environment, generally produces ashes that are typically rich in both soda and lime (Brill 1970, 105-28; Verità 1985), neither of which are found in similar levels in the frit. To produce glass with low-magnesia and low-potash glass, a relatively pure inorganic or mineral soda source would be required, such as an evaporite, like natron from the Wadi Natrun in Egypt. However, such minerals are usually associated with high soda levels. It is therefore not possible to classify the frit as a variant of a known type of glass. Furthermore, with its low calcium level, it would not have been used directly as a glass as it would probably have been soluble in water (Freestone et al. 2008, 29-46).
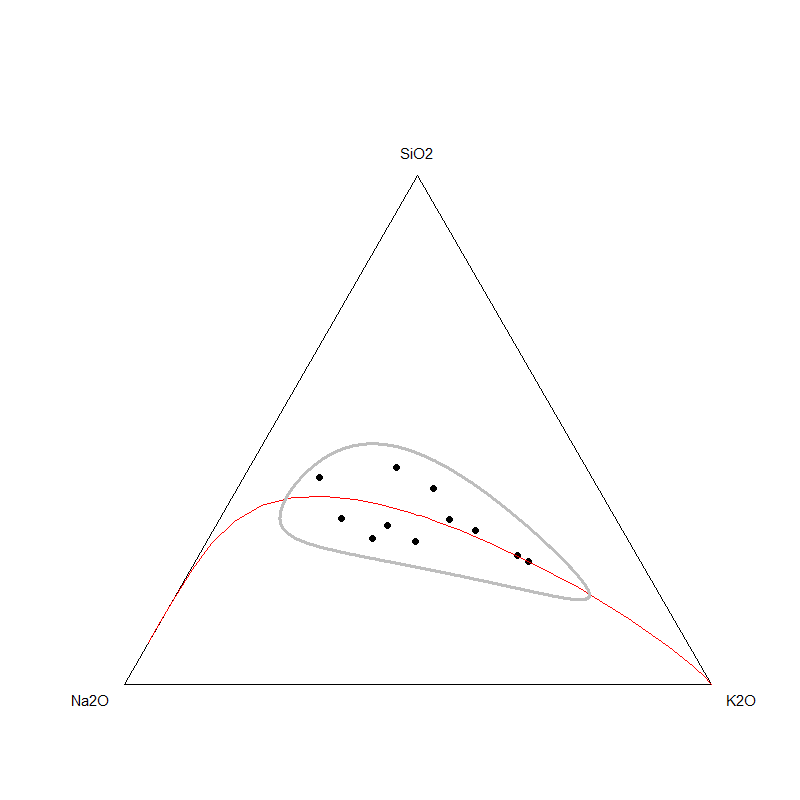
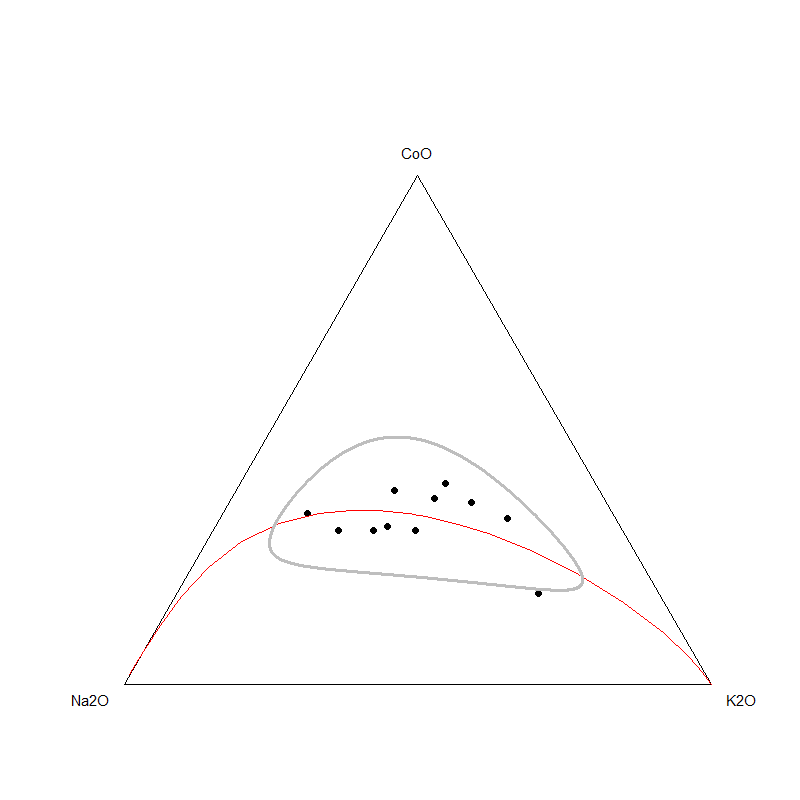
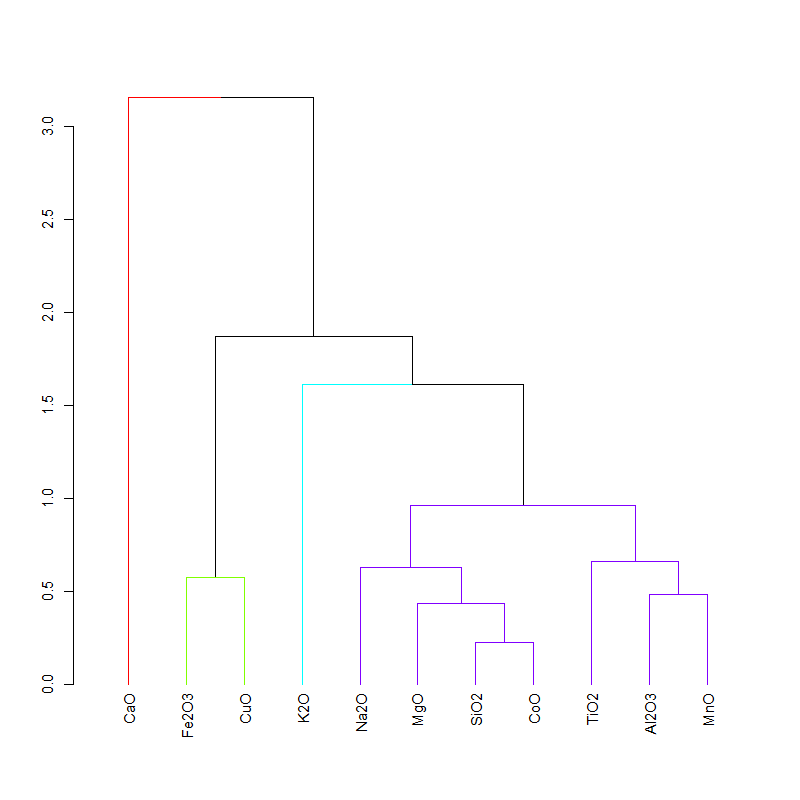
In effect, the low amounts of potash in the frit tend to suggest that plant ash was not used to make the frit. This is supported by the compositional variation matrix (Table 3) and the dendrogram derived from it (Figure 20), which show that there is lower co-dependence (higher value) between K2O and Na2O (0.530) than between most components. Plotting the SiO2-K2O-Na2O sub-composition on a ternary diagram (Figure 19) shows a narrow variance ellipse, with the data appearing to follow a one-dimensional pattern joining the vertices Na2O and K2O. Such a narrow ellipse suggests that the ratios involving SiO2 have an almost constant value, and that most compositional variance is due to variation in Na2O/K2O. A similar ternary plot with CoO, which as a colourant is probably independent of the glass formers, shows a similar pattern. This suggests that the system was not fluxed using plant ash (or that a number of different types of plant ash were used at this site for these cobalt glasses). In other words, the system was most probably fluxed with a soda-based mineral, even though the soda levels are quite low. This suggests that Tite and Shortland's (2003) modified position is effectively supported – Egyptian cobalt-blue glass contained both natron (or some type of soda mineral) and plant ash, the former from the frit and the latter from the base glass with which the frit was subsequently mixed.
| Na2O | MgO | Al2O3 | SiO2 | K2O | CaO | TiO2 | MnO | FeO | CoO | CuO | |
| Na2O | 0.000 | 0.167 | 0.193 | 0.077 | 0.530 | 0.475 | 0.339 | 0.355 | 0.265 | 0.140 | 0.276 |
| MgO | 0.167 | 0.000 | 0.273 | 0.176 | 0.401 | 0.789 | 0.277 | 0.262 | 0.201 | 0.091 | 0.393 |
| Al2O3 | 0.193 | 0.273 | 0.000 | 0.043 | 0.271 | 1.126 | 0.319 | 0.193 | 0.578 | 0.078 | 0.644 |
| SiO2 | 0.077 | 0.176 | 0.043 | 0.000 | 0.341 | 0.847 | 0.239 | 0.194 | 0.410 | 0.059 | 0.401 |
| K2O | 0.530 | 0.401 | 0.271 | 0.341 | 0.000 | 1.631 | 0.409 | 0.561 | 0.842 | 0.271 | 0.856 |
| CaO | 0.475 | 0.789 | 1.126 | 0.847 | 1.631 | 0.000 | 0.879 | 1.204 | 0.438 | 0.919 | 0.636 |
| TiO2 | 0.339 | 0.277 | 0.319 | 0.239 | 0.409 | 0.879 | 0.000 | 0.314 | 0.422 | 0.240 | 0.534 |
| MnO | 0.355 | 0.262 | 0.193 | 0.194 | 0.561 | 1.204 | 0.314 | 0.000 | 0.450 | 0.126 | 0.600 |
| FeO | 0.265 | 0.201 | 0.578 | 0.410 | 0.842 | 0.438 | 0.422 | 0.450 | 0.000 | 0.279 | 0.314 |
| CoO | 0.140 | 0.091 | 0.078 | 0.059 | 0.271 | 0.919 | 0.240 | 0.126 | 0.279 | 0.000 | 0.420 |
| CuO | 0.276 | 0.393 | 0.644 | 0.401 | 0.856 | 0.636 | 0.534 | 0.600 | 0.314 | 0.420 | 0.000 |
The dendrogram for the frit (Figure 20) is quite different from those of the glasses in Figure 8 and Figure 9, with most components falling in one significant cluster. Moreover, CoO is much better associated with the glass formers (SiO2, Al2O3, MgO) than in the glasses. In fact, there is higher co-dependence between CoO and these oxides than with MnO (in contrast to its behaviour in glass). It should be noted that there is little co-dependence between lime and the other components in the frit system, as evidenced by CaO failing to cluster with any other component. The probable reason is contamination from the lime lining of the cylindrical vessels recovered at Amarna O45.1 associated with the frit. The slight differences in average concentrations (apart from lime) presented by Tite and Shortland (2003) compared to the earlier paper (Tite et al. 1998) are a consequence of data being excluded, i.e. the authors have removed analyses where they believed the glass to be contaminated by this coating. No data were removed in the current re-analysis. In essence, contamination has occurred making the variation in CaO an unreliable indicator in these samples. Nevertheless, its absolute level in the system is still remarkably low (average 0.7%CaO), which suggests that the silica source was not the same as that used to manufacture the base glass.
The use of a soda-based flux for the frit (as evidenced by the variation between K2O and Na2O in Figure 19) may go some way to explaining why Egyptian cobalt glass has lower amounts of K2O compared to glasses of other colours. K2O concentrations for Egyptian cobalt glass generally lie below 2%K2O (Lilyquist and Brill 1993). Non-cobalt coloured glasses generally have K2O levels that fall between 2-3%K2O, which suggests that adding frit colourant to a base glass made using plant ash as a flux would reduce the K2O levels in the cobalt-blue glass produced. A simple rule of mixture calculation for mixing frit (K2O~0.4%) with a plant-ash fluxed base glass (K2O~2.5%) in a 1:1 proportion shows that the glass produced would have around 1.5%K2O, as found in most Egyptian cobalt-blue glass (note a 1:1 proportion would produce a blue-coloured glass with about 0.1%CoO, which is about the average of cobalt-blue glass from 18th Dynasty Egypt).
Figure 21 shows K2O vs CoO for 18th Dynasty glass from Amarna and Malkata and frit from Amarna, measured using WDS and electron microprobe. The scatter in the data is somewhat expected as the consequence of the inevitable K2O contamination from burning wood during recycling (Paynter 2009). However, it can be seen, perhaps optimistically, that higher levels of cobalt appear to correspond to lower levels of potash, potentially converging on the levels of K2O found in the frit. Such an interaction would suggest that frit made with a soda-based mineral (with low K2O) was mixed with a base glass, thereby lowering the K2O level with respect to the base glass to make the initial glass. Subsequent dilution with a base glass would decrease the CoO concentration and increase the K2O levels. This is further supported by the two dendrograms for the 18th and 19th-20th Dynasty glasses in Figure 8 and Figure 9: with more dilution, K2O becomes more associated with Na2O and clusters with MgO, as would be expected if a plant-ash flux was used to make the base glass. Although the potential linear relation of the frit on the K2O vs CoO plot (Figure 21) may be spurious (i.e. their co-dependence in the variation matrix is not high (0.271), predominantly a consequence of one possible outlier) it may indicate that these components have a common origin, which suggests that they derive from the same source.

The higher levels and greater variation of K2O for the Nippur cobalt-blue axes (average = 3.6%K2O; range: 1.68-5.55%K2O with one outlier at 8.59) suggests a different type of plant ash for the base glass, more contamination from processing, or possibly more recycling. However, these differences do not necessarily suggest a different colourant source. In other words, the cobalt-coloured soda-based frit may have been something that the glass-makers of both Mesopotamia and Egypt needed to acquire in order to colour blue the glasses derived from their own local base glass precursors.
The variation matrix for the Amarna frit also shows that there is good co-dependence between CoO and MgO (0.091), Al2O3 (0.078) and SiO2 (0.059). This could suggest that cobalt was added to a silica source containing high alumina and low magnesia in known proportions. However, the large variation in the cobalt levels in the frit suggests that this is unlikely, i.e. CoO: 0.14-0.28% (average = 0.2%). Furthermore, the low amounts of lime tend to discount the Nile River as the silica source for the frit, while the high alumina levels tend to discount its introduction through a silica source of quartz pebbles. Another possibility is that there was a common source for each of these pairs, a source with Co, Si, Al and Mg in the proportions required to produce a high silica, high alumina, low magnesia cobaltiferous frit. This could suggest that the silica source was a siliceous rock containing cobalt compounds and high alumina. Furthermore, although the co-dependence between CoO and MnO is not as high as that for SiO2, Al2O3 and MgO, MnO still forms a significant group with these components, which, as with the glasses, suggests they entered the system together. This provides further support for an alternative to the alum deposits for the source of cobalt, in that it suggests that the cobalt was embedded in a siliceous rock - a rock that contained sufficient levels of alumina to elevate its concentration in the glass system. In other words, cobalt-blue glass had elevated alumina compared to other colours because it derived from a system where alumina was a natural component of a siliceous rock, such as an igneous rock, as mentioned previously (Figure 11 and Figure 12).
This association between cobalt and the components found in igneous rocks is also supported by examining the absolute values of the concentrations in the frit and igneous rocks (i.e. Table 1 and Table 2). The ratio of the average concentration of Al2O3 in the frit to its average composition in igneous rock is 3.3/15.52 (i.e. 0.21). Similar ratios are found with K2O, TiO2 and CaO, i.e. 0.14, 0.16 and 0.12, respectively. The similarity in these ratios suggests that these components, found in the cobalt-blue frit from Amarna, not only entered the system together but were introduced directly by contamination from igneous material. In other words, the igneous rock was diluted by a factor of between 5 and 8 during the frit forming process. Conversely, the ratios for Na2O and SiO2 are 2.65 and 1.41, respectively, suggesting that these glass formers were added to the cobaltiferous igneous rock, adding to any silica and soda already present, thereby diluting the concentrations of Al2O3, K2O, TiO2 and CaO to the levels found in the frit. The presence of unreacted silica in the frit (average = 29% unreacted quartz, from visual inspection - Tite and Shortland 2003) supports the premise that silica was added. Assuming that the host rock was igneous, and that its dilution calculated from the Al2O3, K2O, TiO2 and CaO can be used as a scaling factor for elements associated with the mineralisation within the rock, we derive that the concentrations of cobalt, manganese, nickel and zinc were 5-8 times higher in the rock than in the frit. This would suggest that the host rock contained 1-1.6% CoO and 4-6.4% MnO. Although ZnO and NiO were not measured in the frit from Amarna, assuming that a base glass was mixed with frit in a 1:1 ratio suggests that the concentrations of these components in undiluted glass (i.e. the higher peaks of Figure 14) can be used to estimate the concentrations of these components within the host rock, i.e. 1.1-1.75% NiO and 1.5-2.4% ZnO. Incidentally, the CoO calculated by this method would be 1.6-2.56%, which, considering that this is based on a distribution, is close to that calculated directly from the frit (1-1.6% CoO). In other words, the signature of the host rock from which the cobalt derived was potentially an igneous rock with CoO, NiO and ZnO concentrations around 1% to 2.6%, and MnO between 4% and 6.5%. Despite the higher levels of MnO with respect to CoO, this is not the signature of asbolane (which has a ratio of MnO:CoO of about 14.2) but is more likely to be another ore system with NiO, MnO, CoO and ZnO. This is discussed in Section 4.5.
The remarkably good co-dependence between Na2O and SiO2 in the frit (0.077) also supports the premise that silica and soda were added to cobaltiferous rock in that the association suggests SiO2 and the Na2O entered the system together, either from a common source or in measured proportions.

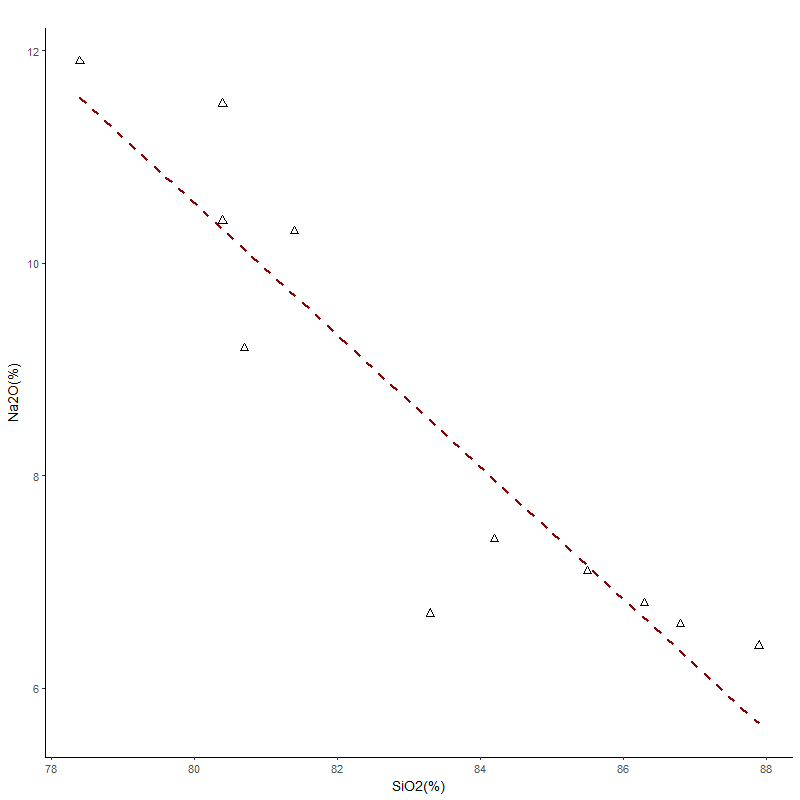
The ternary diagram (Figure 22) does not demonstrate any obvious one-dimensional pattern for the CoO-Na2O-SiO2 sub-composition, suggesting that the variation is not dominated by any of the component pairs. This is supported by the low coefficient of variation of SiO2 (CV = 3.8%) in the frit samples, which indicates that a controlled (and probably fixed) amount of silica was used, with the most probable scenario being that it was placed in a vessel of fixed volume, i.e. a crucible. The coefficient of variation of Na2O is also not high (24.8%). The relationship between Na2O and SiO2 can be seen on the bivariate plot (Figure 23), suggesting that higher amounts of silica are associated with lower amounts of Na2O. This would seem contrary to what would be required, in that a higher silica content would suggest that more flux should be added. However, this interaction is exactly what would be expected if a vessel of fixed volume was used, i.e. in this case, the concept of compositions adding up to 100% may inform on the proportions of the silica and soda added to the cobaltiferous rock in a crucible.
Furthermore, these added components must have been fairly pure, as there is low co-dependence between Fe2O3 and SiO2 (0.410), the opposite to what would be expected if, say, sand had been added, i.e. iron is often present in the silica source, and would therefore be associated with silica. In other words, silica, probably sourced from quartz (possibly pebbles, but more likely quartz associated with the rock), and soda, probably from an evaporite or a soda-based mineral, was added to a cobaltiferous rock that already contained Al2O3, K2O, TiO2 and CaO. Fe2O3 generally clusters with silica in the glasses (Figure 8 and Figure 9). This is consistent with mixing frit with a base glass, when it is considered that the silica source used for the base glass was potentially associated with iron compounds, which would result in a closer association between iron and silica after the frit had been mixed with the base glass components.
CuO is also not particularly well associated with any component in the frit but it clusters with Fe2O3. Low co-dependence of CuO is also found in the glasses (Figure 8 and Figure 9), which could be due to the deliberate addition of copper or bronze as a colourant (Mass et al. 2002). However, this is less likely for the frit, primarily because the levels of CuO in the frit (average: 0.02%CuO; range: 0-0.05%Cu) are much lower than would be expected for an additive, bearing in mind that 1-2%CuO is required to colour glass. In other words, copper probably entered the system as an impurity with the cobalt.
Despite the low concentration of CuO, which suggests that it is a natural component of the system, the low co-dependences and the clustering of CuO and Fe2O3 in the frit system would suggest that neither appear to be part of the mineralisation of the cobalt source. This could suggest their presence in the frit is due to contamination, such as from the fritting pans or from post-deposition. However, it is also possible that both were components of the cobalt source but their associations with the other components were weakened during the formation of the cobalt-rich colourant.
This leads to the inevitable question regarding why anyone would deliberately mix a siliceous rock with additional silica and a soda flux and heat it up to about 1000°C to make a glassy material unless they were trying to remove another component from the system. It is therefore proposed that cobalt frit colourant, such as that found at Amarna O.45, was not manufactured deliberately in order to produce a glass frit with low soda, low lime and high silica to which cobalt was added, but that this frit was a natural by-product of a metallurgical smelting system in which a soda-based mineral acted as a flux to melt cobaltiferous rock in order to remove a metal. By this rationale, the blue glass produced from melting the siliceous rock was, in essence, the slag of the system.
This may appear to be a nested argument in that it rests on the three conclusions previously outlined:
Nevertheless, considering that the cobalt-blue frit was a slag rather than a deliberately made glass not only goes some way to explaining the variation in the concentrations and close associations of most components but also its unusual composition. This scenario would also provide a reason for the low co-dependences of CuO with the other components in the frit system and why they cluster - unlike refractory oxides, CuO would potentially partition during the extraction process, thereby reducing its co-dependences with the other components in the system. This is examined in Section 4.5. Furthermore, if the colourant that arrived in Egypt was already a glassy slag (perhaps in the form of irregular-shaped rocks – see Figure 1), then the purpose of melting this raw material in fritting pans could have been to remove contaminants and debris. In other words, the cobalt-blue slag needed to be purified before it was subsequently added to a base glass.
Relating glass to metal production is not a new concept (e.g. Peltenberg 1987, 5-29; Mass et al. 2002), with Dayton (1981; 1993, 38) being the first person to claim that Egyptian and Mycenaean cobalt-blue glass derived from a silver ore, i.e. the silver-bearing cobalt ores of Erzgebirge on the Czech-Germany border. Although these studies had their detractors, it is proposed here that regardless of the archaeological veracity of the silver-cobalt ore source identified by Dayton (1981; 1993, 38), re-examination of cobalt-blue frit is a potential window to view whether cobalt-blue glass and frit found at Amarna are related to the extraction of metal.
Internet Archaeology is an open access journal based in the Department of Archaeology, University of York. Except where otherwise noted, content from this work may be used under the terms of the Creative Commons Attribution 3.0 (CC BY) Unported licence, which permits unrestricted use, distribution, and reproduction in any medium, provided that attribution to the author(s), the title of the work, the Internet Archaeology journal and the relevant URL/DOI are given.
Terms and Conditions | Legal Statements | Privacy Policy | Cookies Policy | Citing Internet Archaeology
Internet Archaeology content is preserved for the long term with the Archaeology Data Service (ROR). Help sustain and support open access publication by donating to our Open Access Archaeology Fund.