
Experiments and analyses were carried out on a five-element ore system in order:
Ore from the Silverfields deposit in Cobalt, Ontario, in Canada was obtained for the experiments, as this system is well characterised and was available. The ore occurs as nearly vertical veins in Huronian sedimentary rocks below a sill-like body of Nipissing diabase. The ore veins are composed of carbonates, arsenides, native silver and sulfides, and are zoned with respect to type of arsenides and grade of silver ore. The predominant arsenides in the upper parts of the ore veins are those of nickel, in the mid-portions, cobalt, and in the lower parts, iron. High-grade silver ore is generally associated with mixtures of nickel and cobalt arsenides, medium-grade with cobalt arsenides, and low- to very low-grade with either iron or nickel arsenides. Textural relations suggest that the arsenides and native silver have a common origin, while the sulphides were in the rocks prior to ore deposition but remobilised and redeposited in and around the ore veins as grains during the mineralisation period (Petruk 1968).
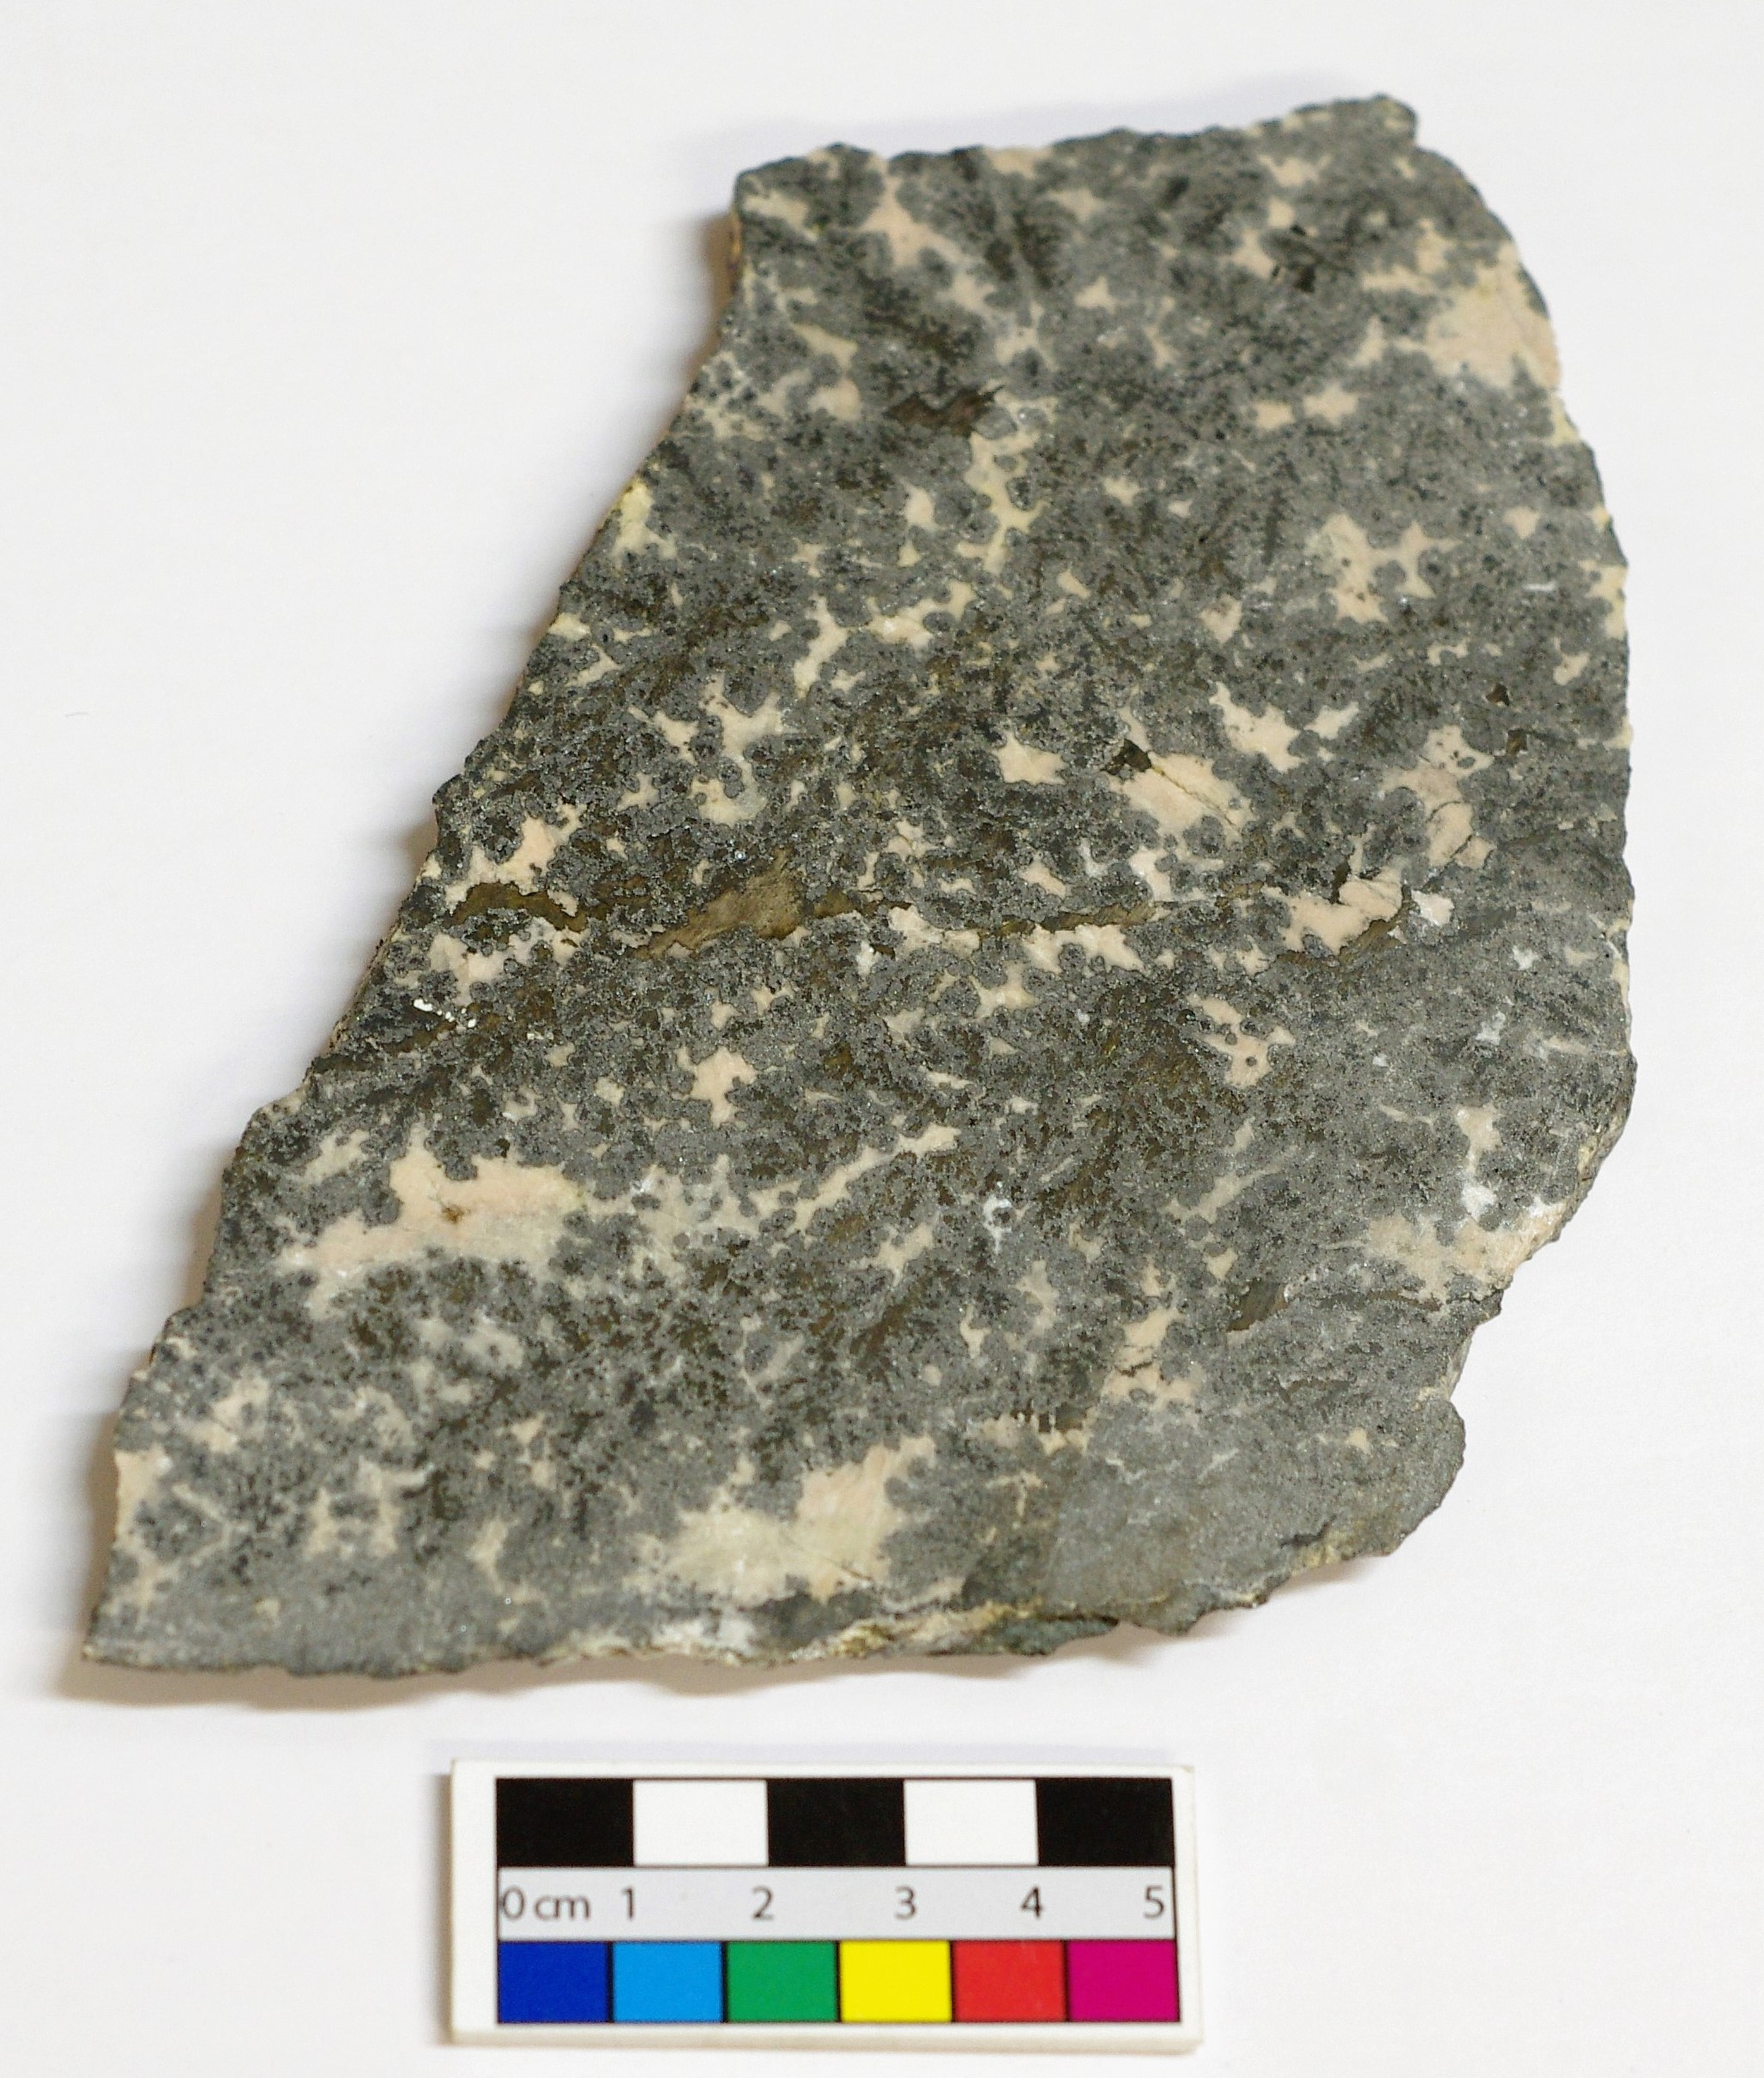
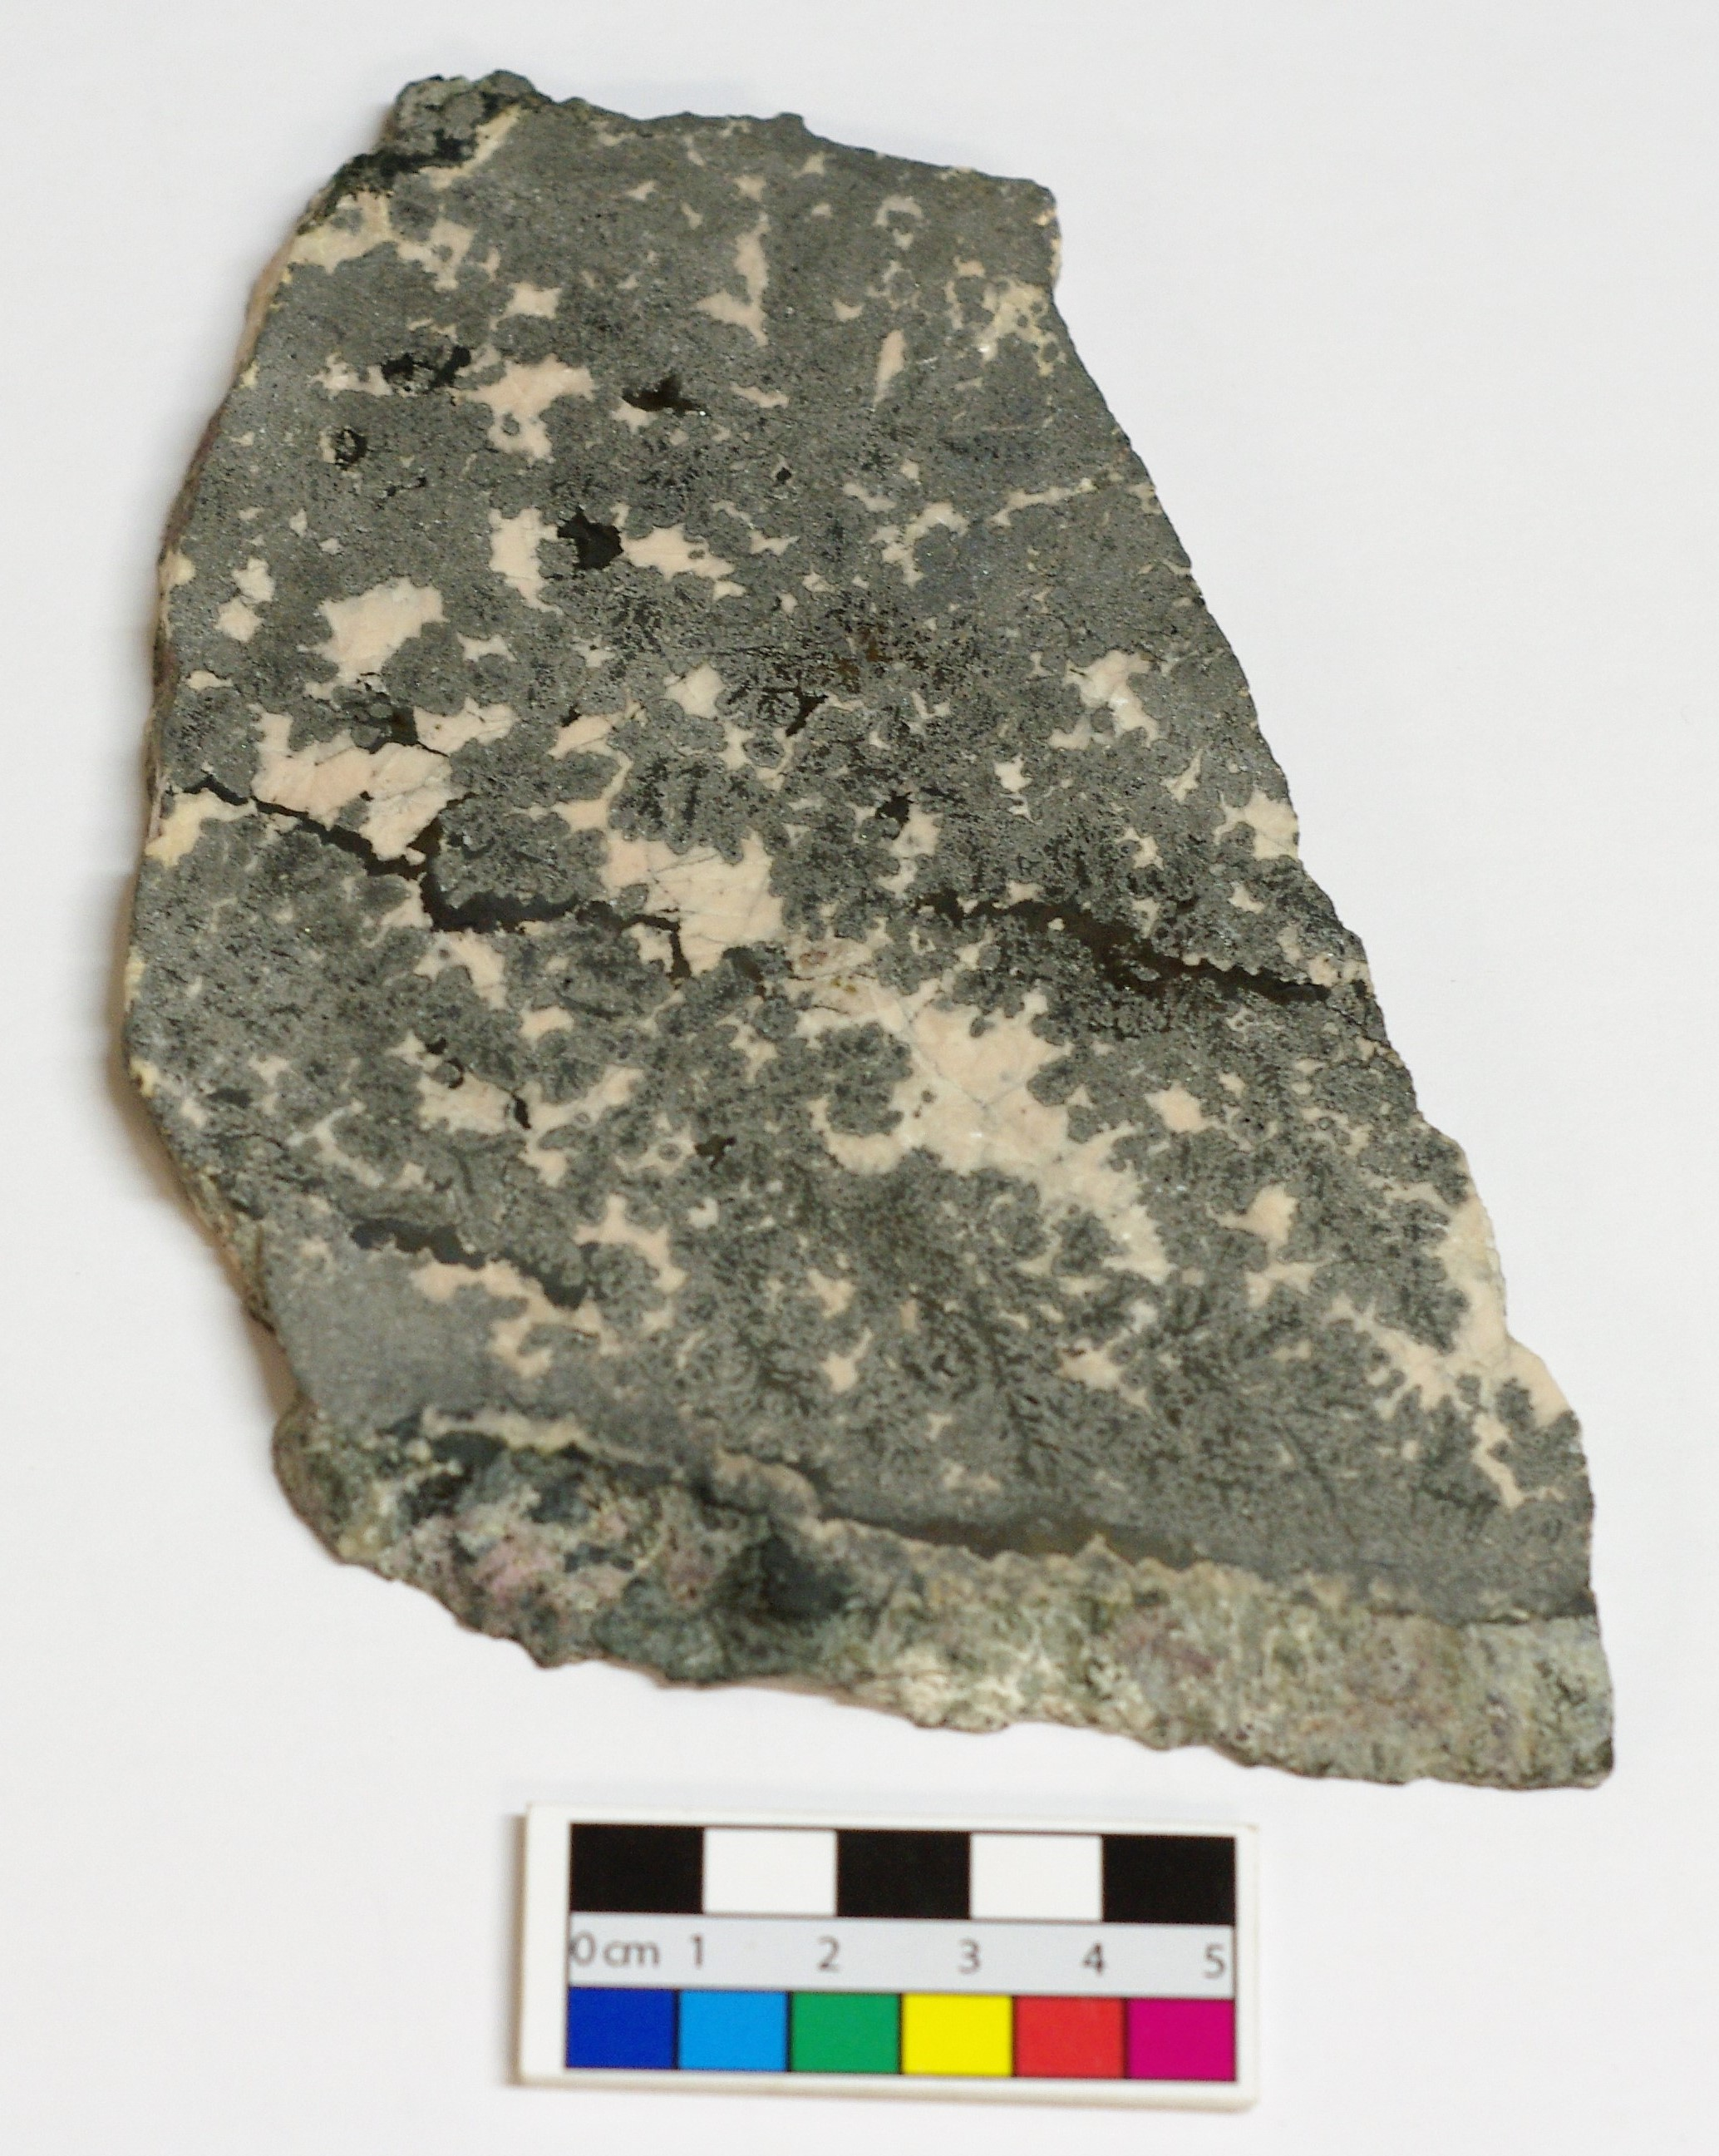
Figure 29 shows photographs of the ore slab and the ore surface using a Dino-Lite digital microscope. In terms of silver, it can be classified as a high-grade ore, exhibiting dendritic growth of silver into a cobalt-arsenide matrix with some silver growing at the core of large arsenide 'rosettes'. Figure 29 shows that the ore was heterogeneous at a macroscopic scale. A section of the ore was removed that contained all the phases that could be observed macroscopically. No attempt was made to examine representative sections in terms of the amount of each phase, i.e. the analyses were not conducted as a quantitative measure of the grade of the silver ore.
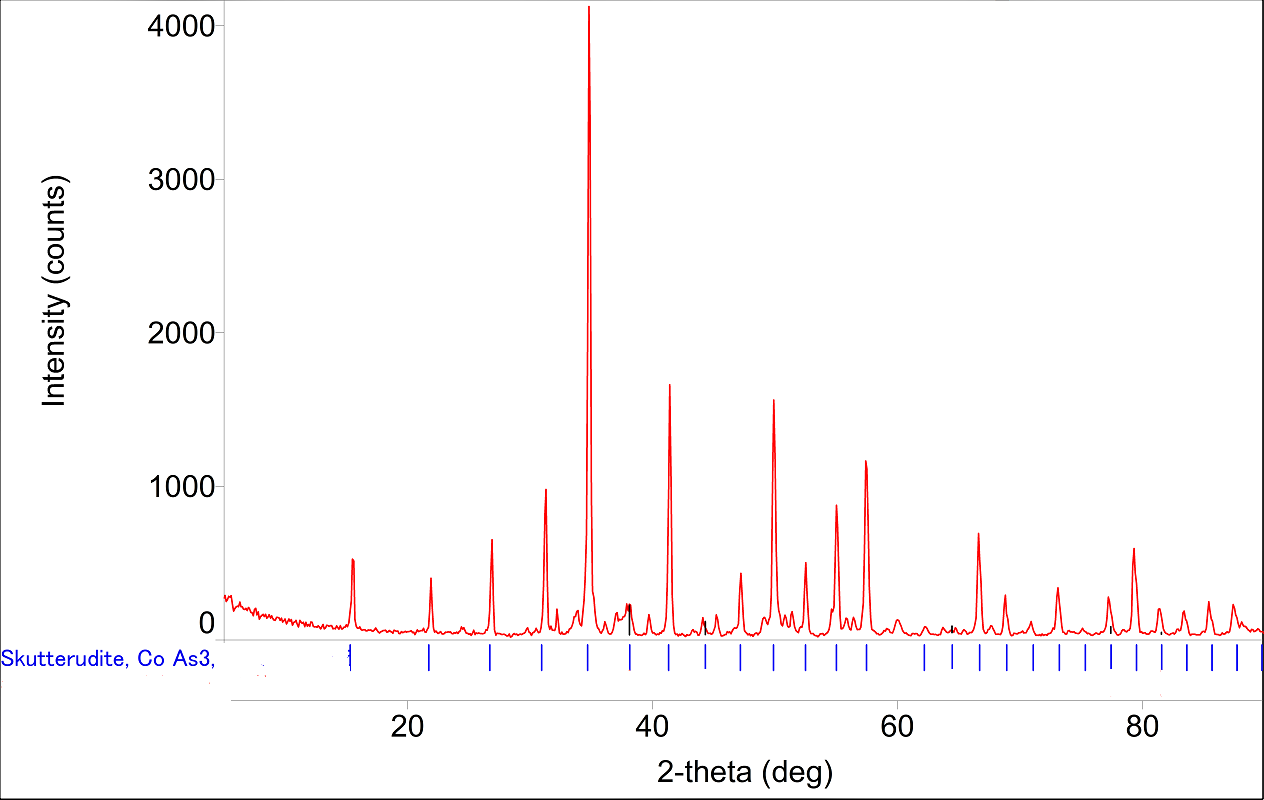
A small section of ore was cut from the slab and crushed to flakes. Some of these flakes were ground up using a mortar and pestle to determine which mineral phases were present using XRD (x-ray diffraction). A sample (about 0.1g) was placed in a Rigaku Miniflex 600, with a scan range of 5°-90°, a scan step of 0.1° and scan speed of 1.5° per minute. The resulting diffraction pattern (Figure 30) was matched to databases to aid identification. The results show that, apart from silver, the main components of the ore were cobalt arsenides, with skutterudite having the highest confidence in terms of identified minerals.
The remainder of the crushed ore was placed in a conical carbon crucible with laboratory grade silica, sodium carbonate and calcium carbonate. As it was unknown a priori which components of the ore would enter the glass slag, the amounts of silica, sodium carbonate and calcium carbonate were selected based on percentages to form a glass (i.e. 65%SiO2; 20%Na2CO3; 15%CaCO3). The percentage of each component were as follows: ore (31.3%), silica (44.6%), Na2CO3(13.8%) and CaCO3(10.3%). The crucible charge was heated in a closed furnace at a rate of about 10°C/hour. The temperature was held at 750°C for 1 hour in order to allow partial vitrification and removal of entrapped air before being heated to 1100°C where it was held for 1 hour before cooling down to room temperature. The sample was removed from the partially oxidised carbon crucible before being sectioned for SEM analysis (Figure 31). The metallic and glassy parts were analysed. The remaining glassy part of the sectioned sample was reheated to determine any compositional changes in this glassy material on subsequent reheating cycles. The glass was reheated in a carbon crucible at a rate of about 10°C/hour to 1300°C and cooled without any dwell time to simulate reprocessing of glass. Part of this glass was removed, mounted and polished for SEM-EDS analysis. The other parts were reheated twice more under the same processing conditions. In effect, the reheating experiments produced three glass samples (in addition to the originally produced sample) which had been reheated to 1300°C from one to three times.

SEM-EDS was conducted on the ore from Silverfields, Cobalt, Ontario, and the sample produced. The ore, the produced sample and the reheated glasses were mounted in resin and polished down to 1μm using alumina paste. In the case of the produced sample, the section of the sample with the silvery phase still attached (Figure 31) was mounted and polished for SEM-EDS analysis. Figure 31 shows the sectioned sample, demonstrating clear separation of the cobalt-blue glass and a large shiny silvery bead, which collected at the base of the crucible (i.e. the sample has been inverted for the photograph).
A Hitachi S-3400N SEM attached to an INCA EDS (Oxford Instruments, UK) was used. A conductive carbon-coating was applied to the sample, which was examined at a working distance of 10mm using a voltage of 20keV. Carbon was removed subsequently from all elemental analyses. Backscattered electron imaging (BSE) was used to help identify differences in phase and particle composition. EDS was used to generate elemental composition of certain areas of the samples to understand the chemical structure and the distribution of elements. An acquisition time of 100 seconds was used with a dead time between 35-40%. The SEM-EDS was optimised using cobalt prior to any analytical work, and approximately every 90 minutes during scanning. The count rate on the cobalt was 3500 counts/second. Corning A was used as a certified reference material, primarily because it was a soda-lime-silica glass with measurable cobalt levels for SEM-EDS, i.e. 0.17%CoO. Errors were high on the cobalt (20%) standard, mainly because levels are close to the detection limits of the EDS. Two additional soda-lime-silica glass reference materials were used to determine measurement errors, specifically for arsenic. These standards (LOP07-C006 and LOP07-C057) were selected as they have much higher arsenic concentrations than any other soda-lime-silica glass standard reference materials. The errors for As2O3 were 14% and 5.5% for the two standards, respectively. All standard measurements were conducted at the same magnification as the bulk sample measurements (x200).
As previously mentioned, the ore was macroscopically heterogeneous and glass formers had been added. The SEM-EDS analyses were therefore not conducted as a quantitative assessment of the grade of the silver ore, nor to determine the composition of the sample produced per se, but as an exploratory investigation to determine how elements present in the ore partitioned between the glassy and metallic phases of the sample (see Table 6).
| % (n=3) | O | Mg | Si | S | Ca | Mn | Fe | Co | Ni | As | Ag |
|---|---|---|---|---|---|---|---|---|---|---|---|
| Area a) | 18.3 | 3.7 | 0.5 | 1.4 | 4.4 | 0.2 | 3.6 | 10.6 | 1.2 | 51.5 | 8.0 |
| st. dev. | 15.1 | - | - | 0.6 | 3.9 | - | 1.0 | 1.7 | 0.1 | 12.0 | 5.8 |
| % (n=5) | O | Mg | S | Ca | Mn | Fe | Co | Ni | As | Ag | Sb | Hg |
|---|---|---|---|---|---|---|---|---|---|---|---|---|
| Area b) | bdl | bdl | bdl | bdl | bdl | bdl | bdl | bdl | bdl | 91.9 | 3.2 | 4.9 |
| Area c) | bdl | bdl | 17.6 | bdl | bdl | 30.2 | 3.1 | 0.5* | 49.0 | bdl | bdl | bdl |
| Area d) | bdl | bdl | 0.3 | bdl | bdl | 2.5 | 15.5 | 2.0 | 79.8 | bdl | bdl | bdl |
| Area e) | 68.0 | 11.0 | bdl | 19.1 | 0.4 | 1.28 | bdl | bdl | 0.19 | bdl | bdl | bdl |
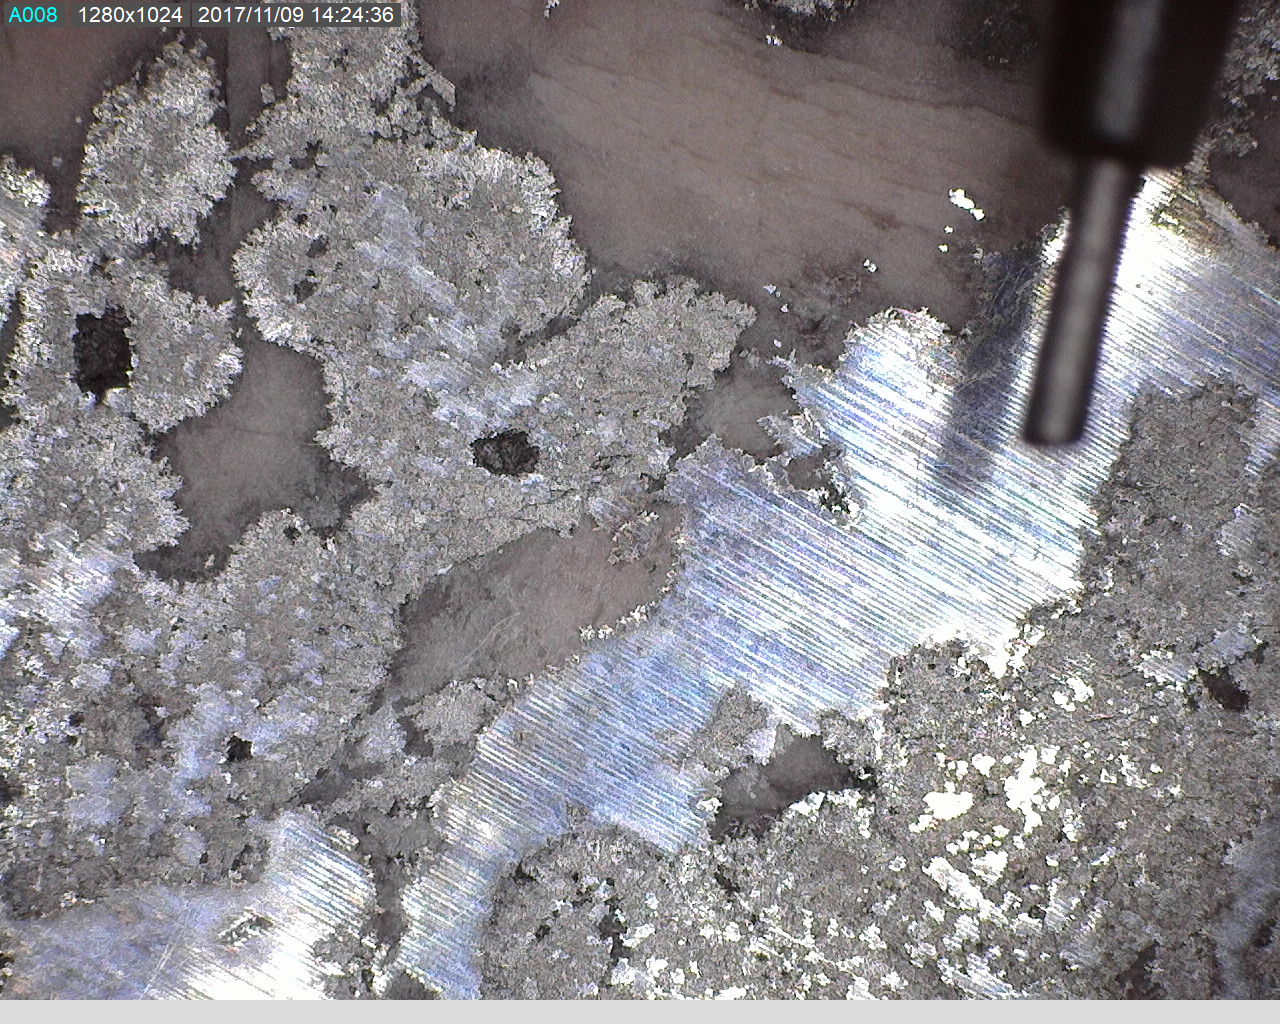
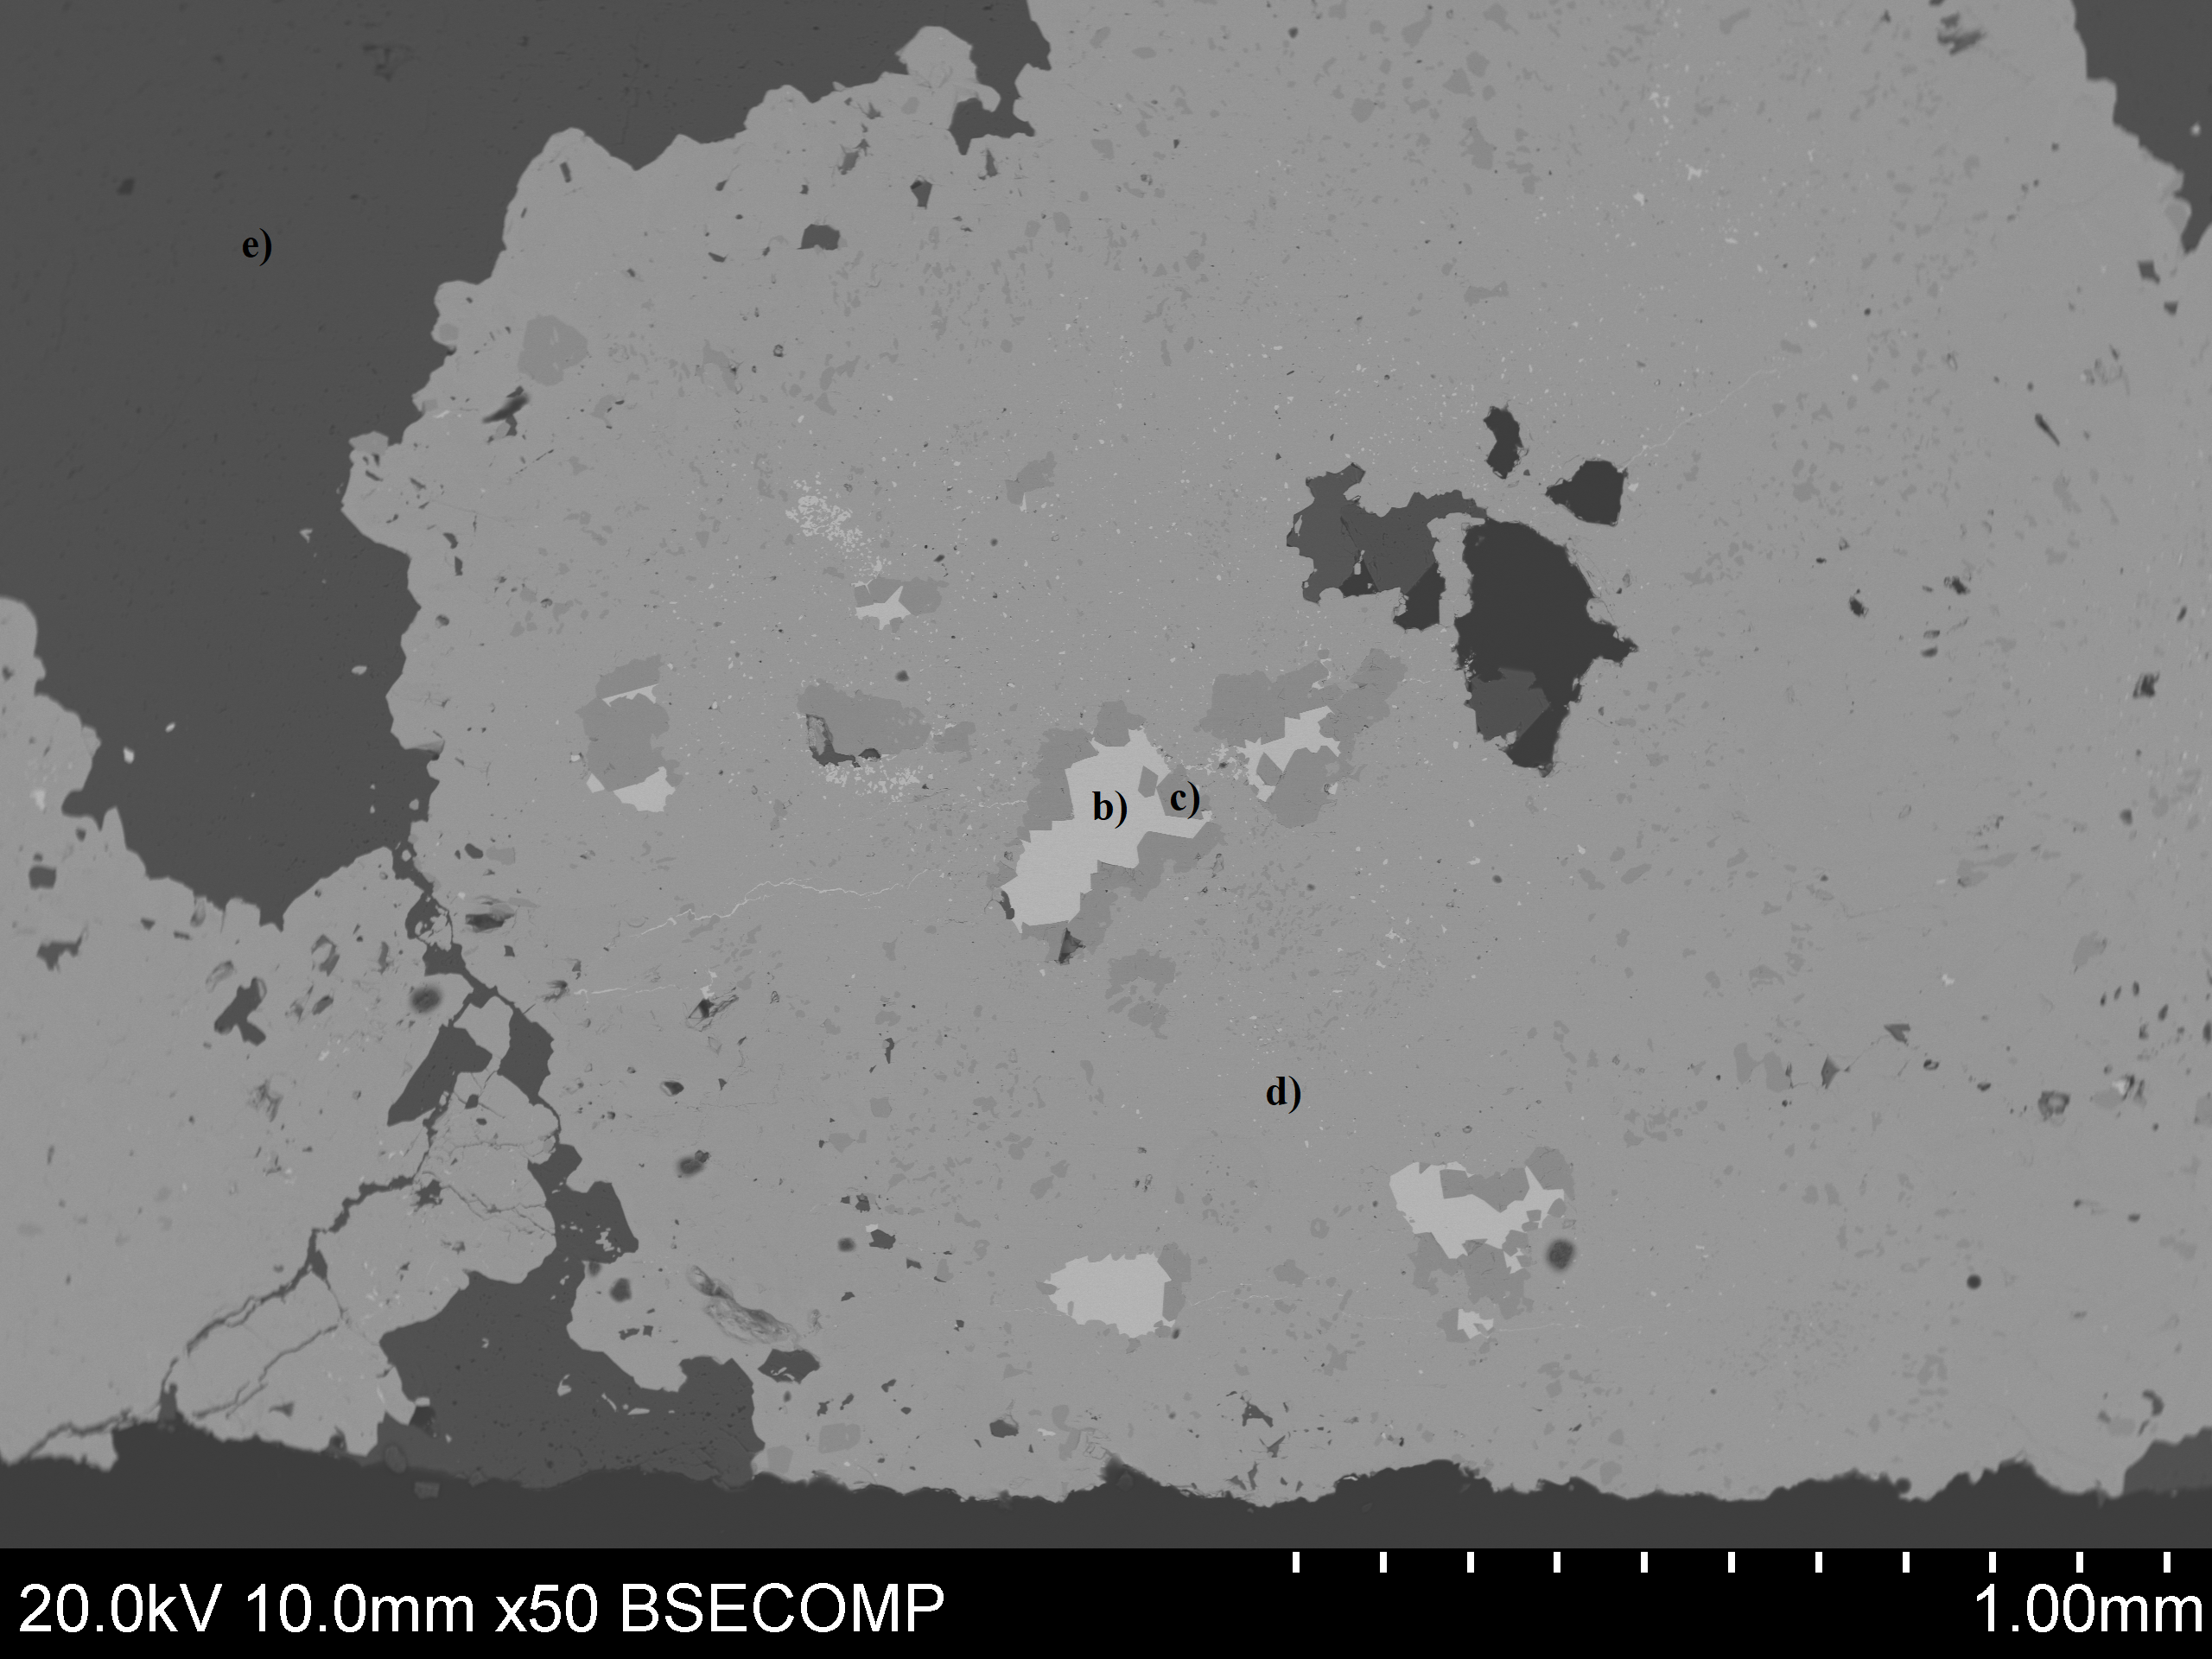
Back-scattered images showed that the ore had a variable composition (Figure 32 - a). Table 4 presents the normalised results in weight per cent based on three analyses from low magnification scans. At least four separate phases were discernible. The silver-rich phase in the ore (Figure 32 - b) had a normalised composition of: Ag (91.9%), Hg (4.9%), Sb (3.2%). Cobalt and nickel were found in association with arsenic in two discrete phases with sulphur and iron (Figure 32 - c and 32 - d). A phase composed primarily of Mg and Ca was also present in the ore (Figure 32 - e), which by stoichiometry of oxides was composed of mainly of 36.7%MgO and 57.9%CaO, the remainder being 3.6%Fe2O3, 1.1%MnO and 0.5%As2O3.
| % | Na2O | MgO | SiO2 | CaO | Fe2O3 | CoO | As2O3 |
|---|---|---|---|---|---|---|---|
| mean (n=5) | 11.1 | 1.4 | 60.0 | 11.3 | 2.9 | 5.2 | 8.1 |
| st. dev. | 0.2 | 0.2 | 0.3 | 0.4 | 0.4 | 1.0 | 2.0 |
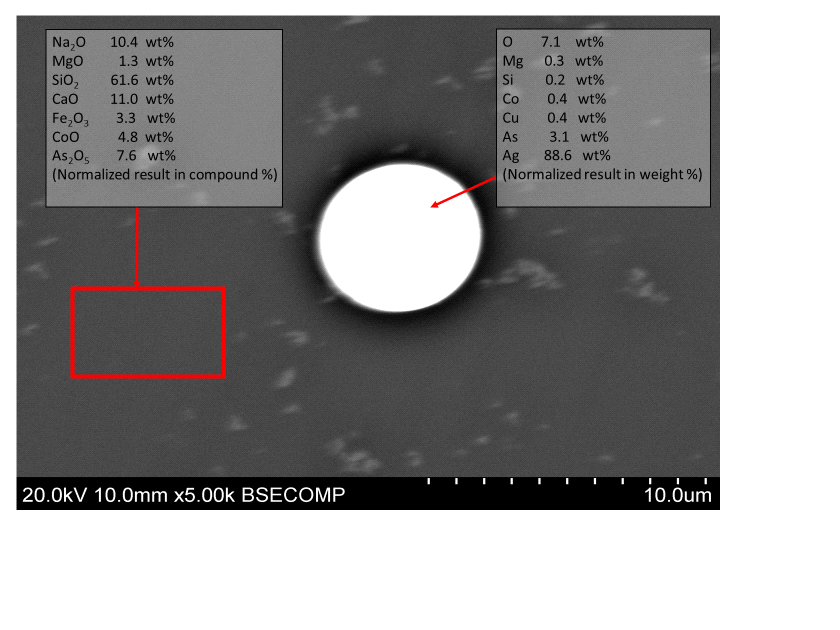
Table 5 shows the composition of the glass slag. Small silver-rich prills were also found in the glass. Figure 33 shows a prill of about 6μm in diameter surrounded by the glass matrix. Silica-rich needles were observed in the glass (Figure 36). These needles were avoided for bulk compositional measurements.
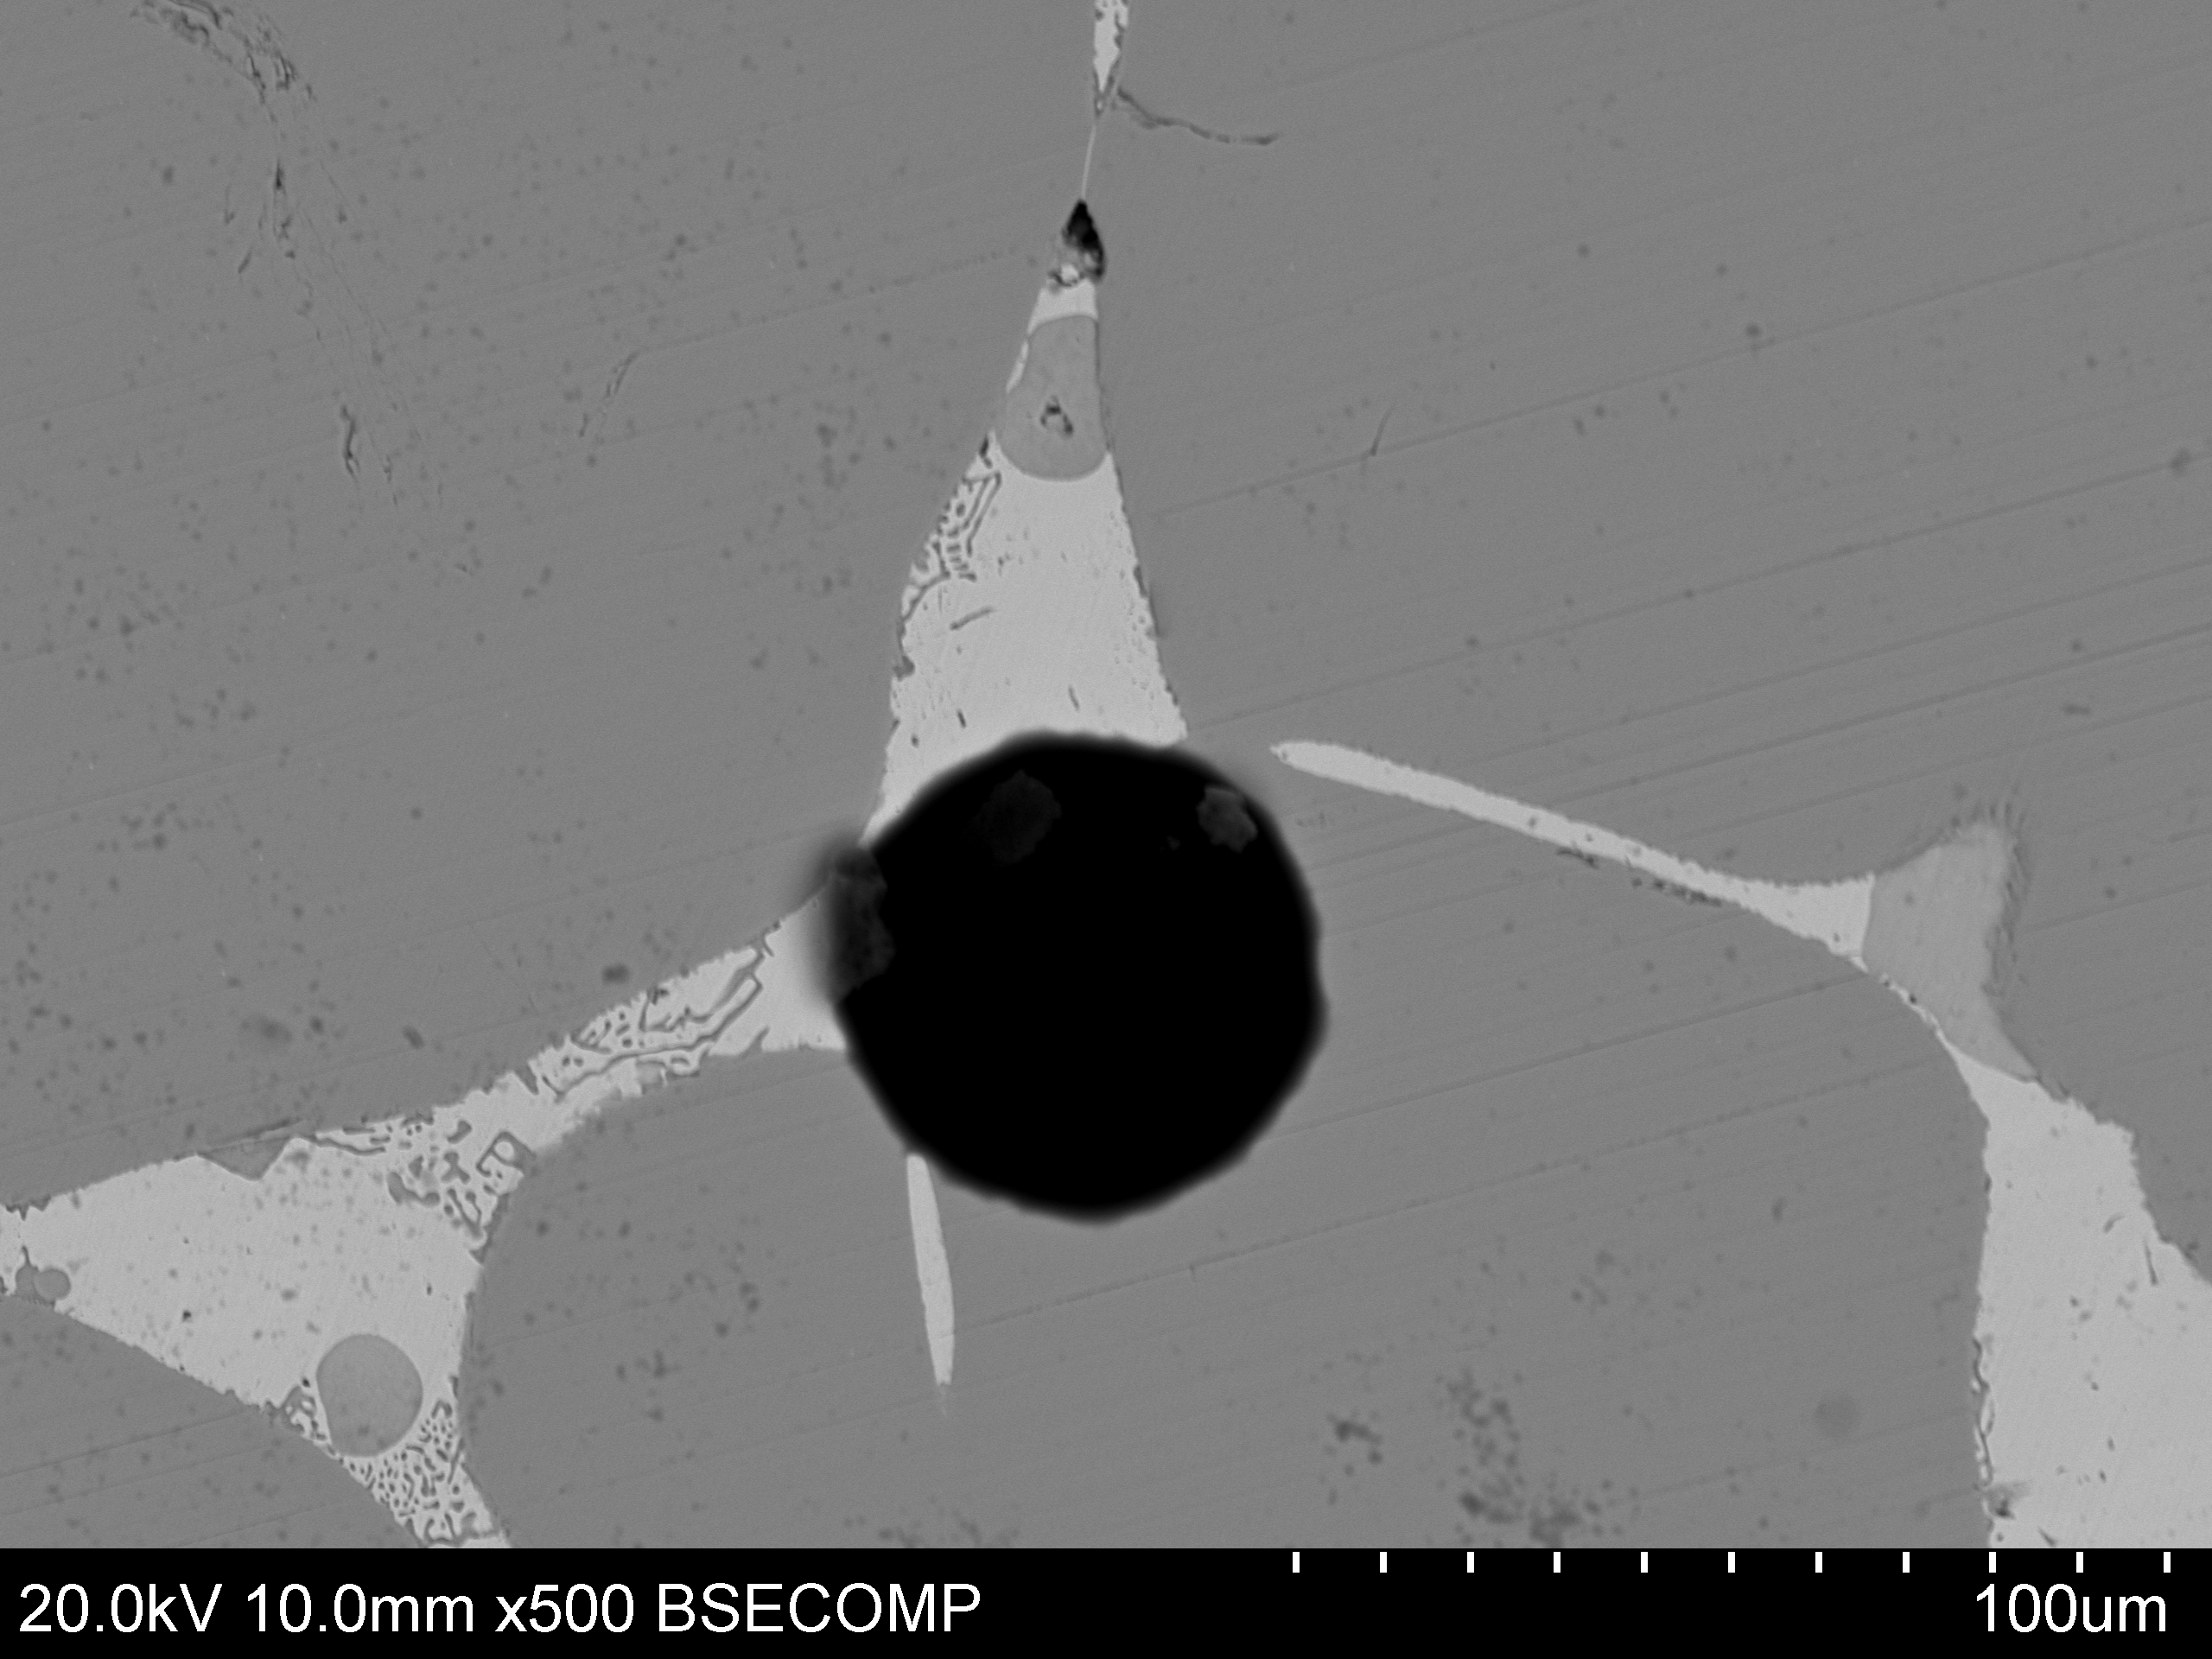
The metallic bead had a variable composition comprising two main phases: one silver-rich, the other cobalt-rich. The cobalt-rich phase was mainly composed of cobalt-nickel arsenides. The presence of a cobalt-rich phase suggests that the glass slag could not dissolve any more cobalt (i.e. around 5% CoO may have saturated the glassy matrix). The silver-rich phase contained arsenic, copper and some sulphur. Antimony and some cobalt-nickel arsenides were present only in small discrete phases within the silver-rich phase. In essence, the metallic bead was a composite of silver and Co-Ni-As.
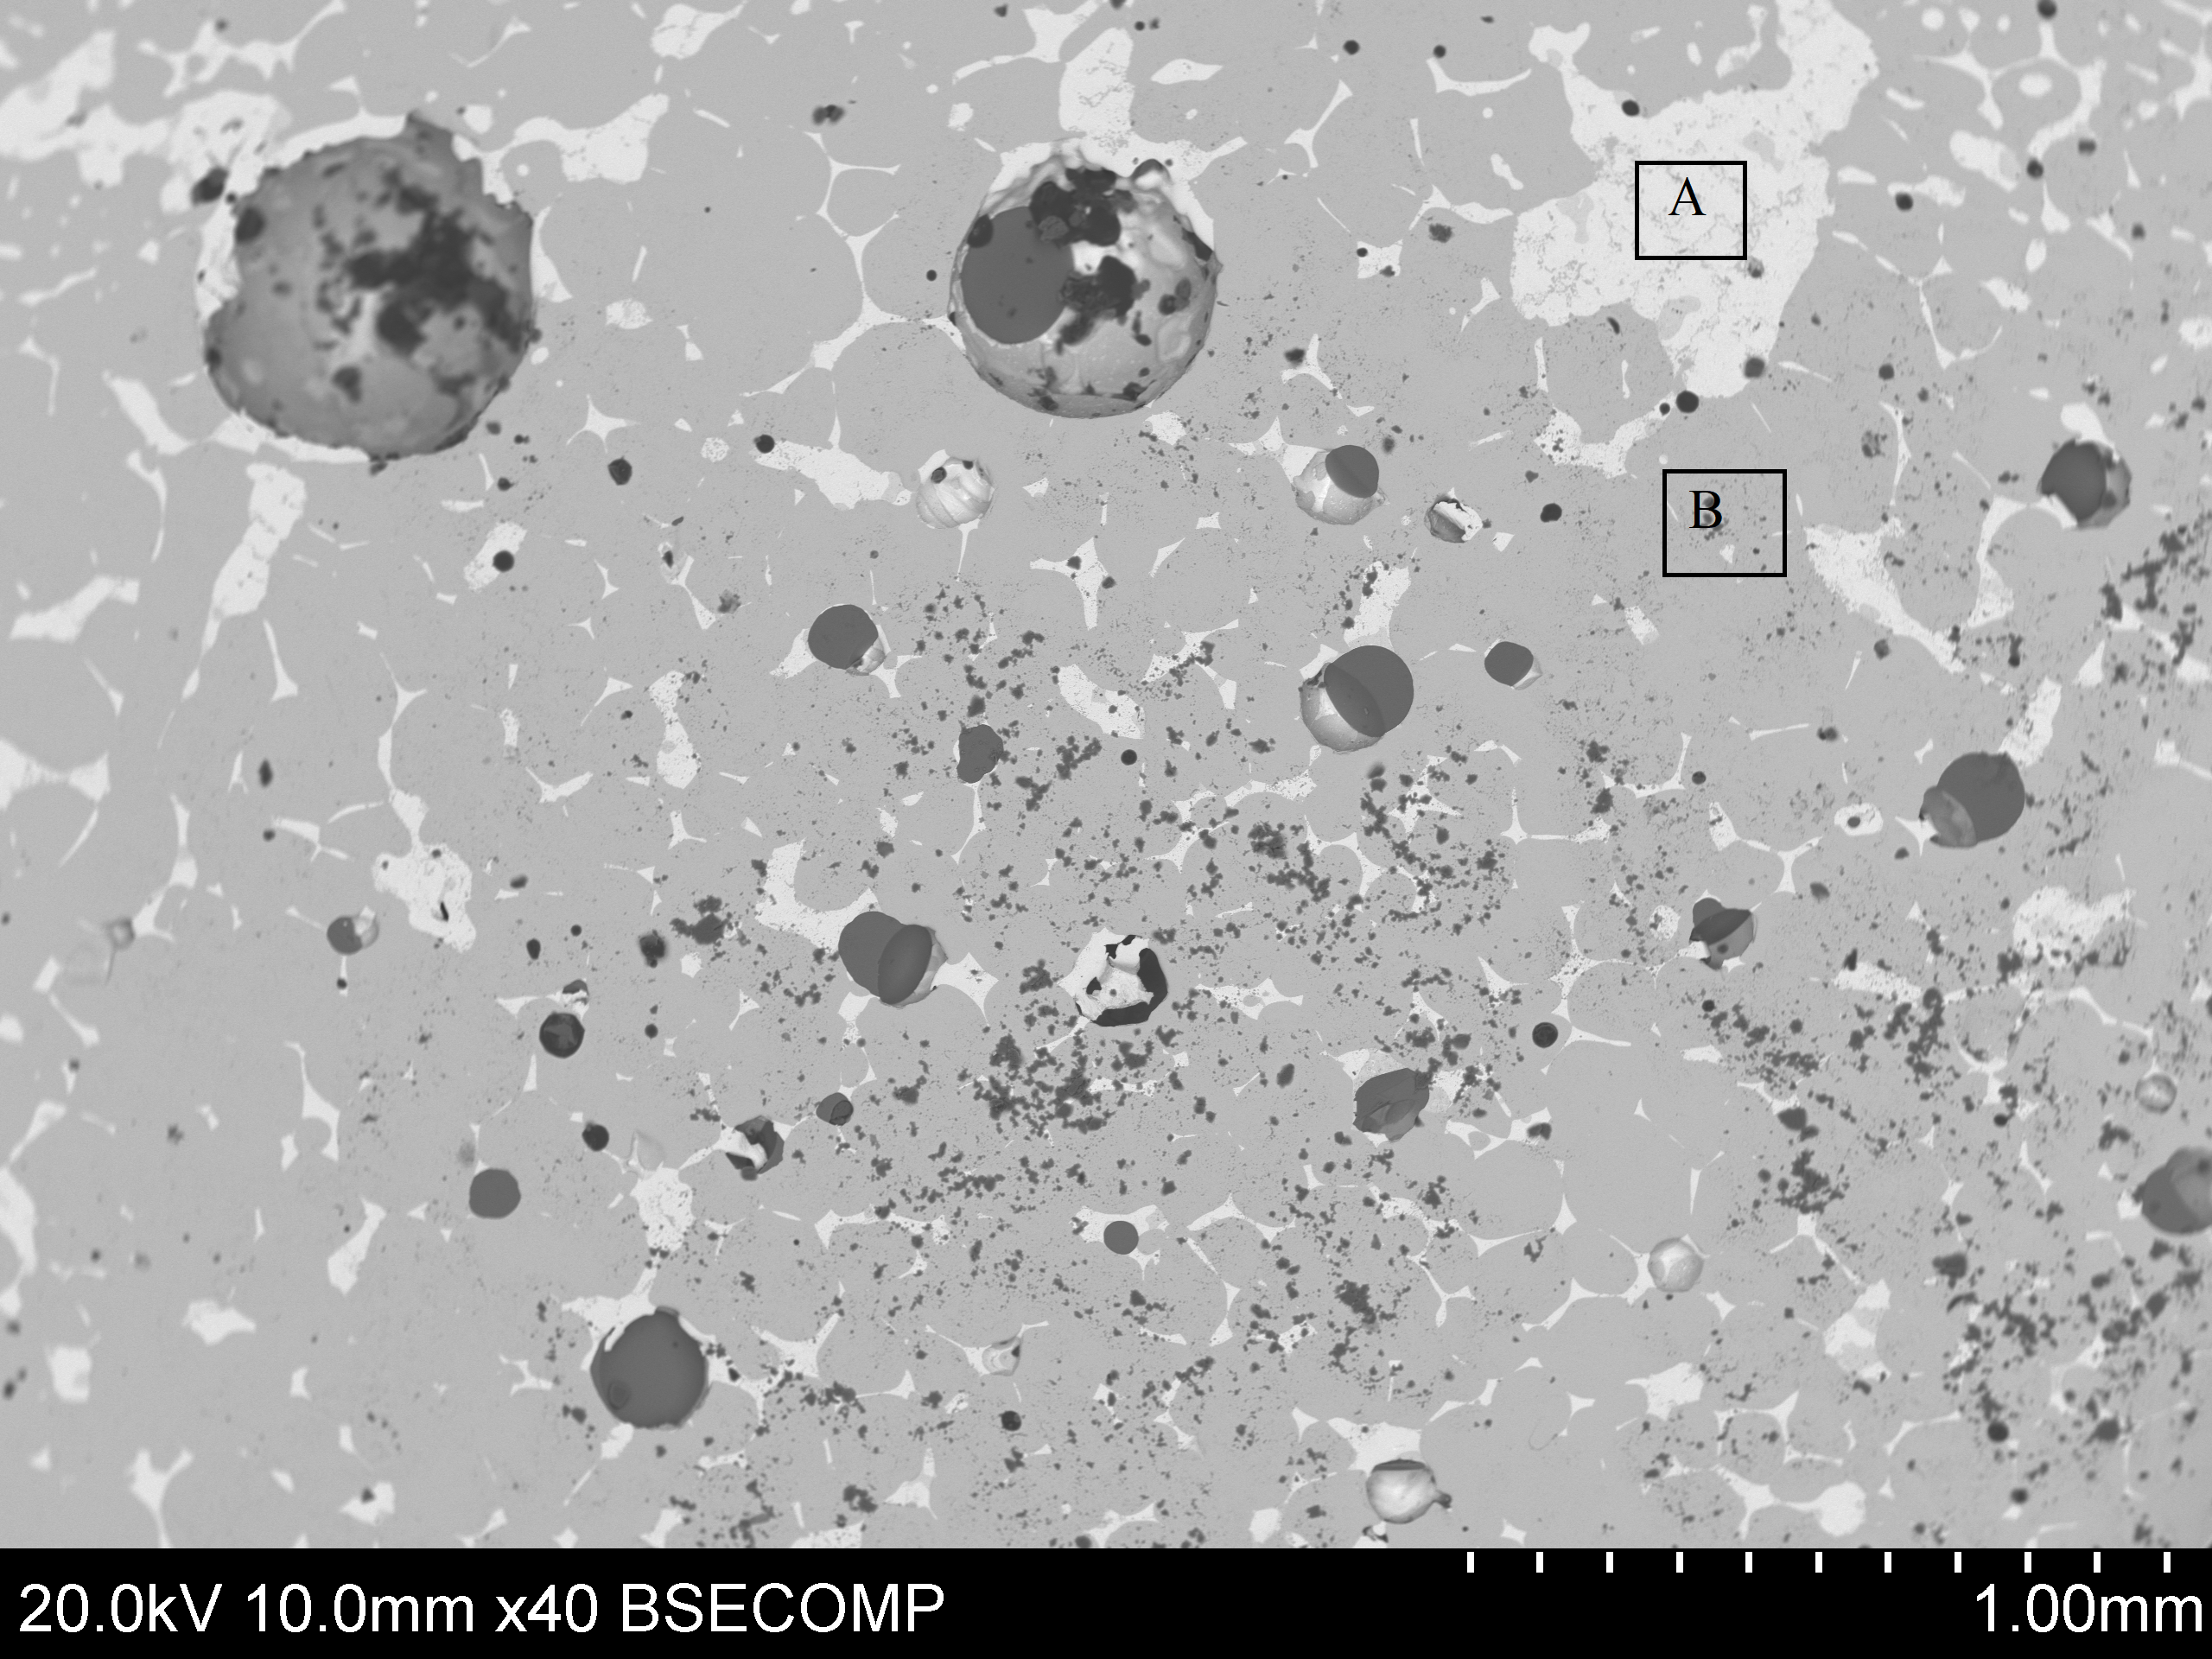
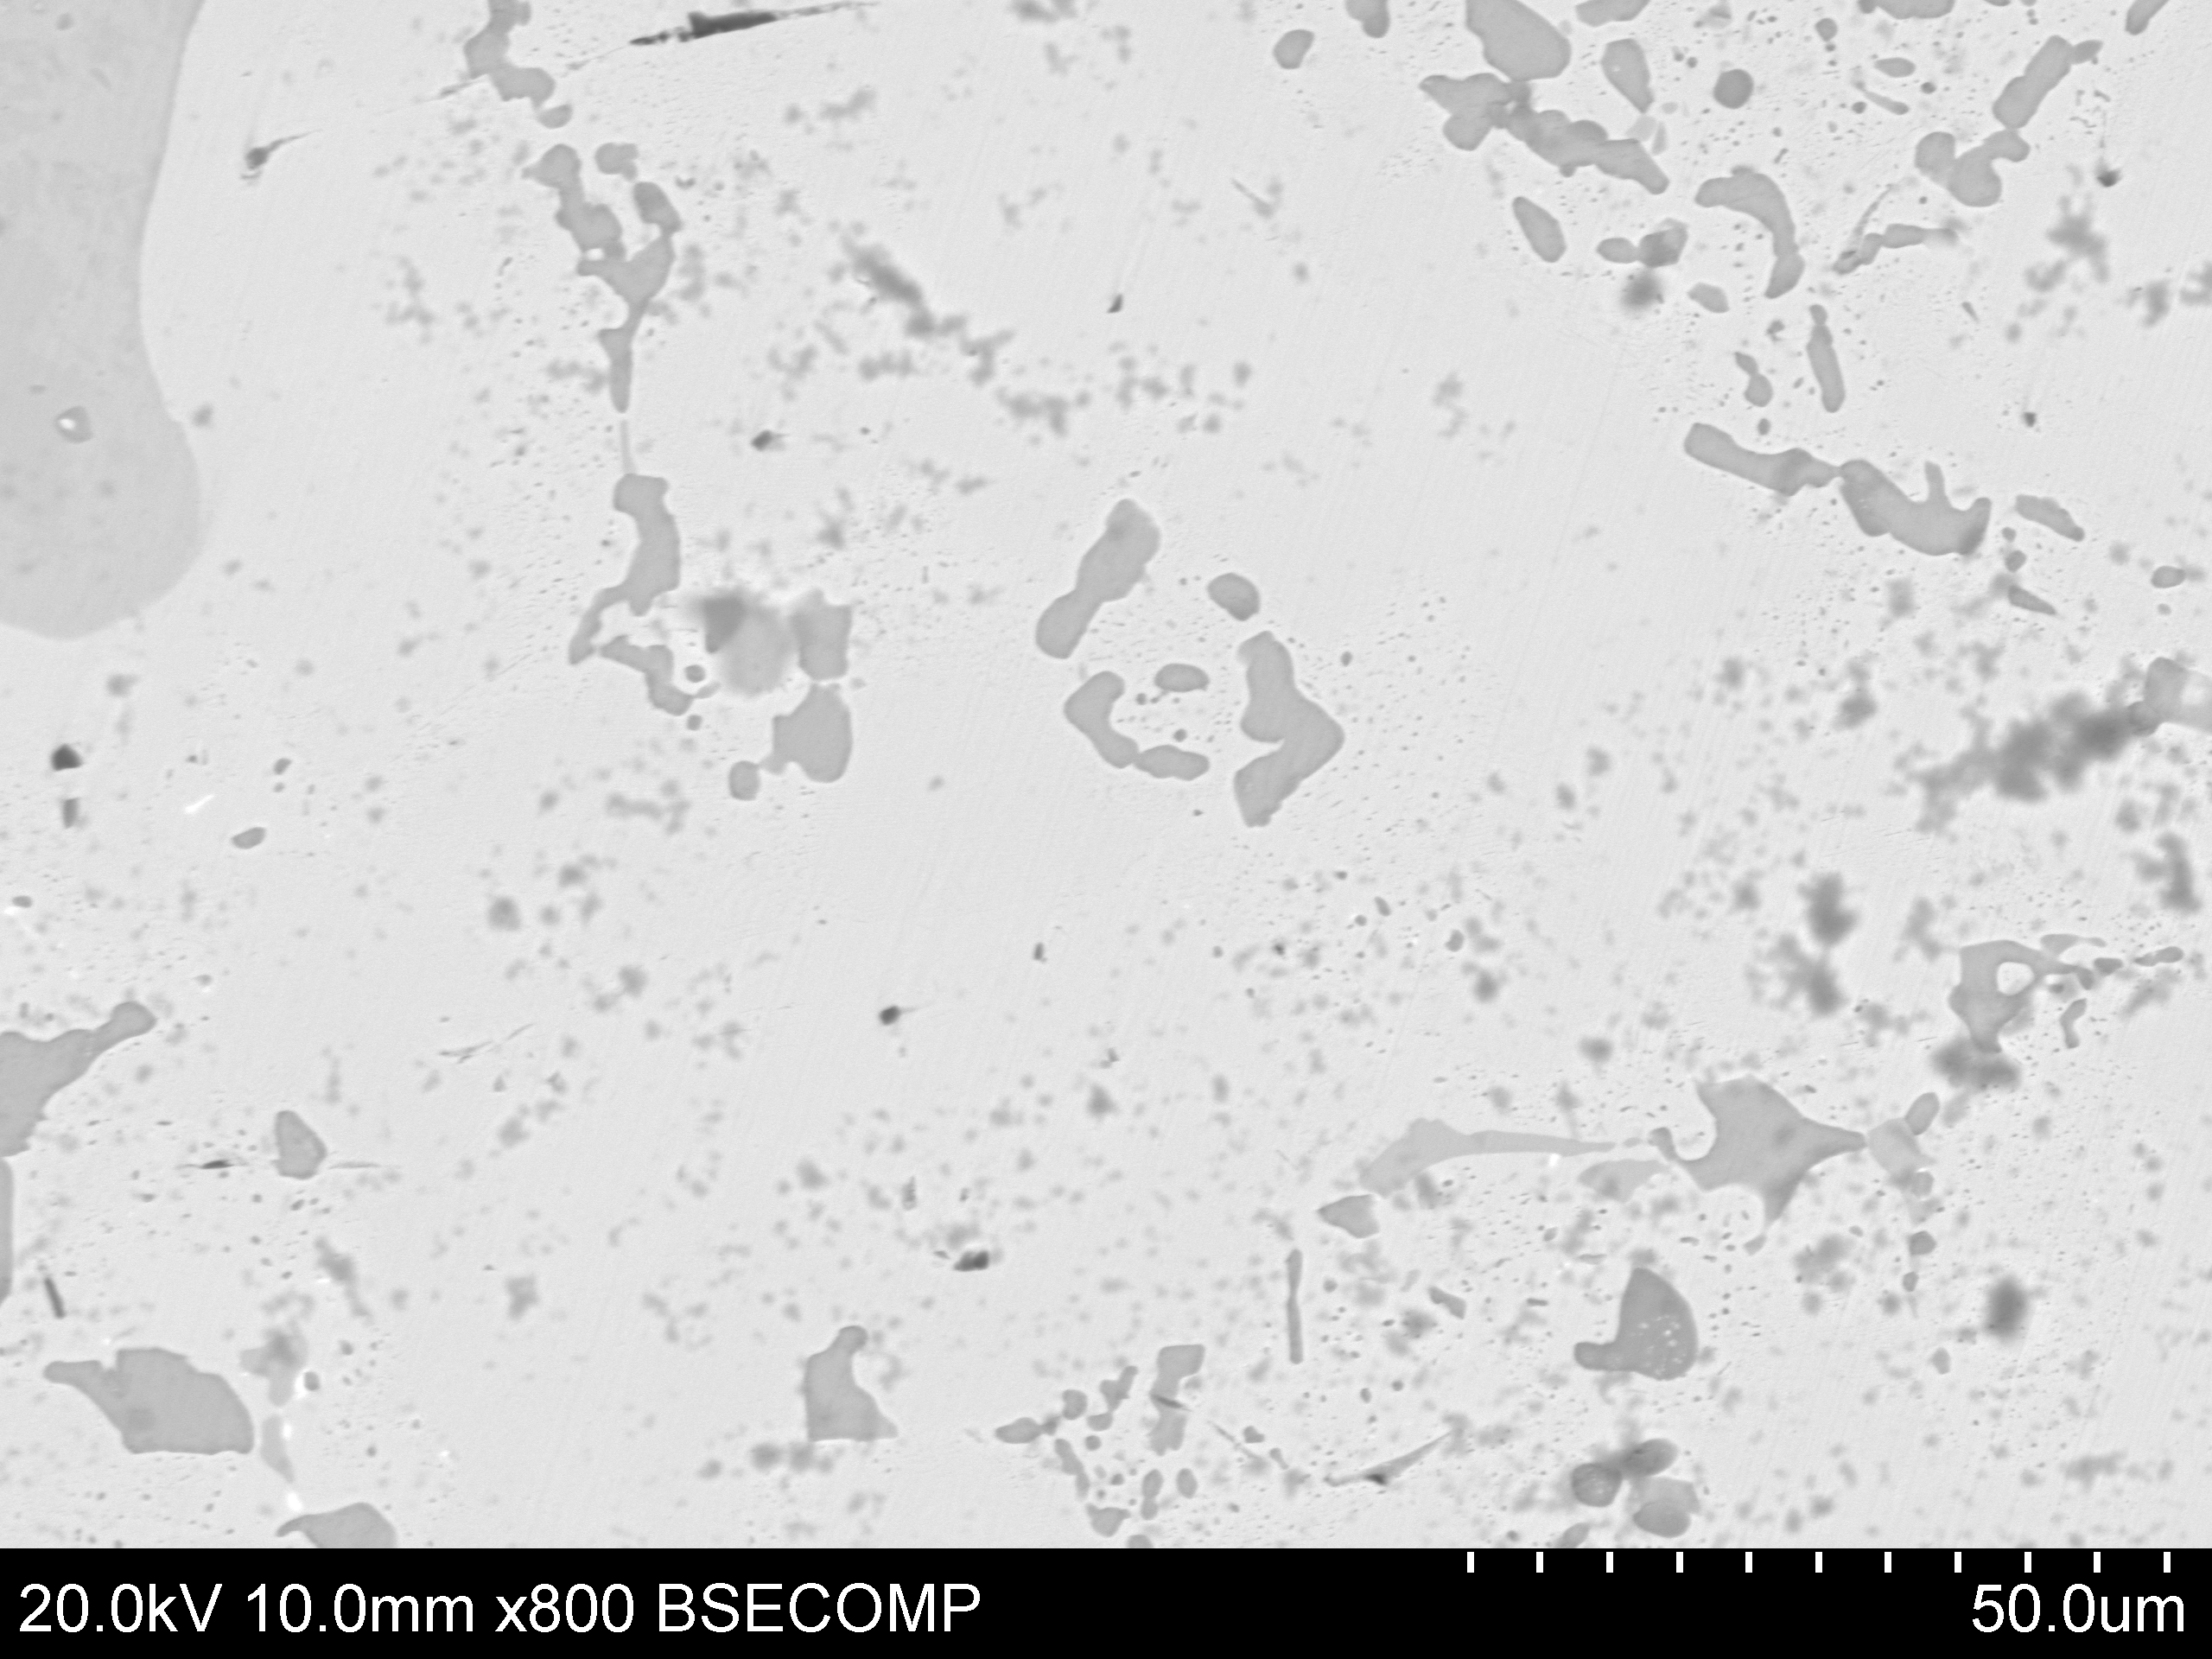
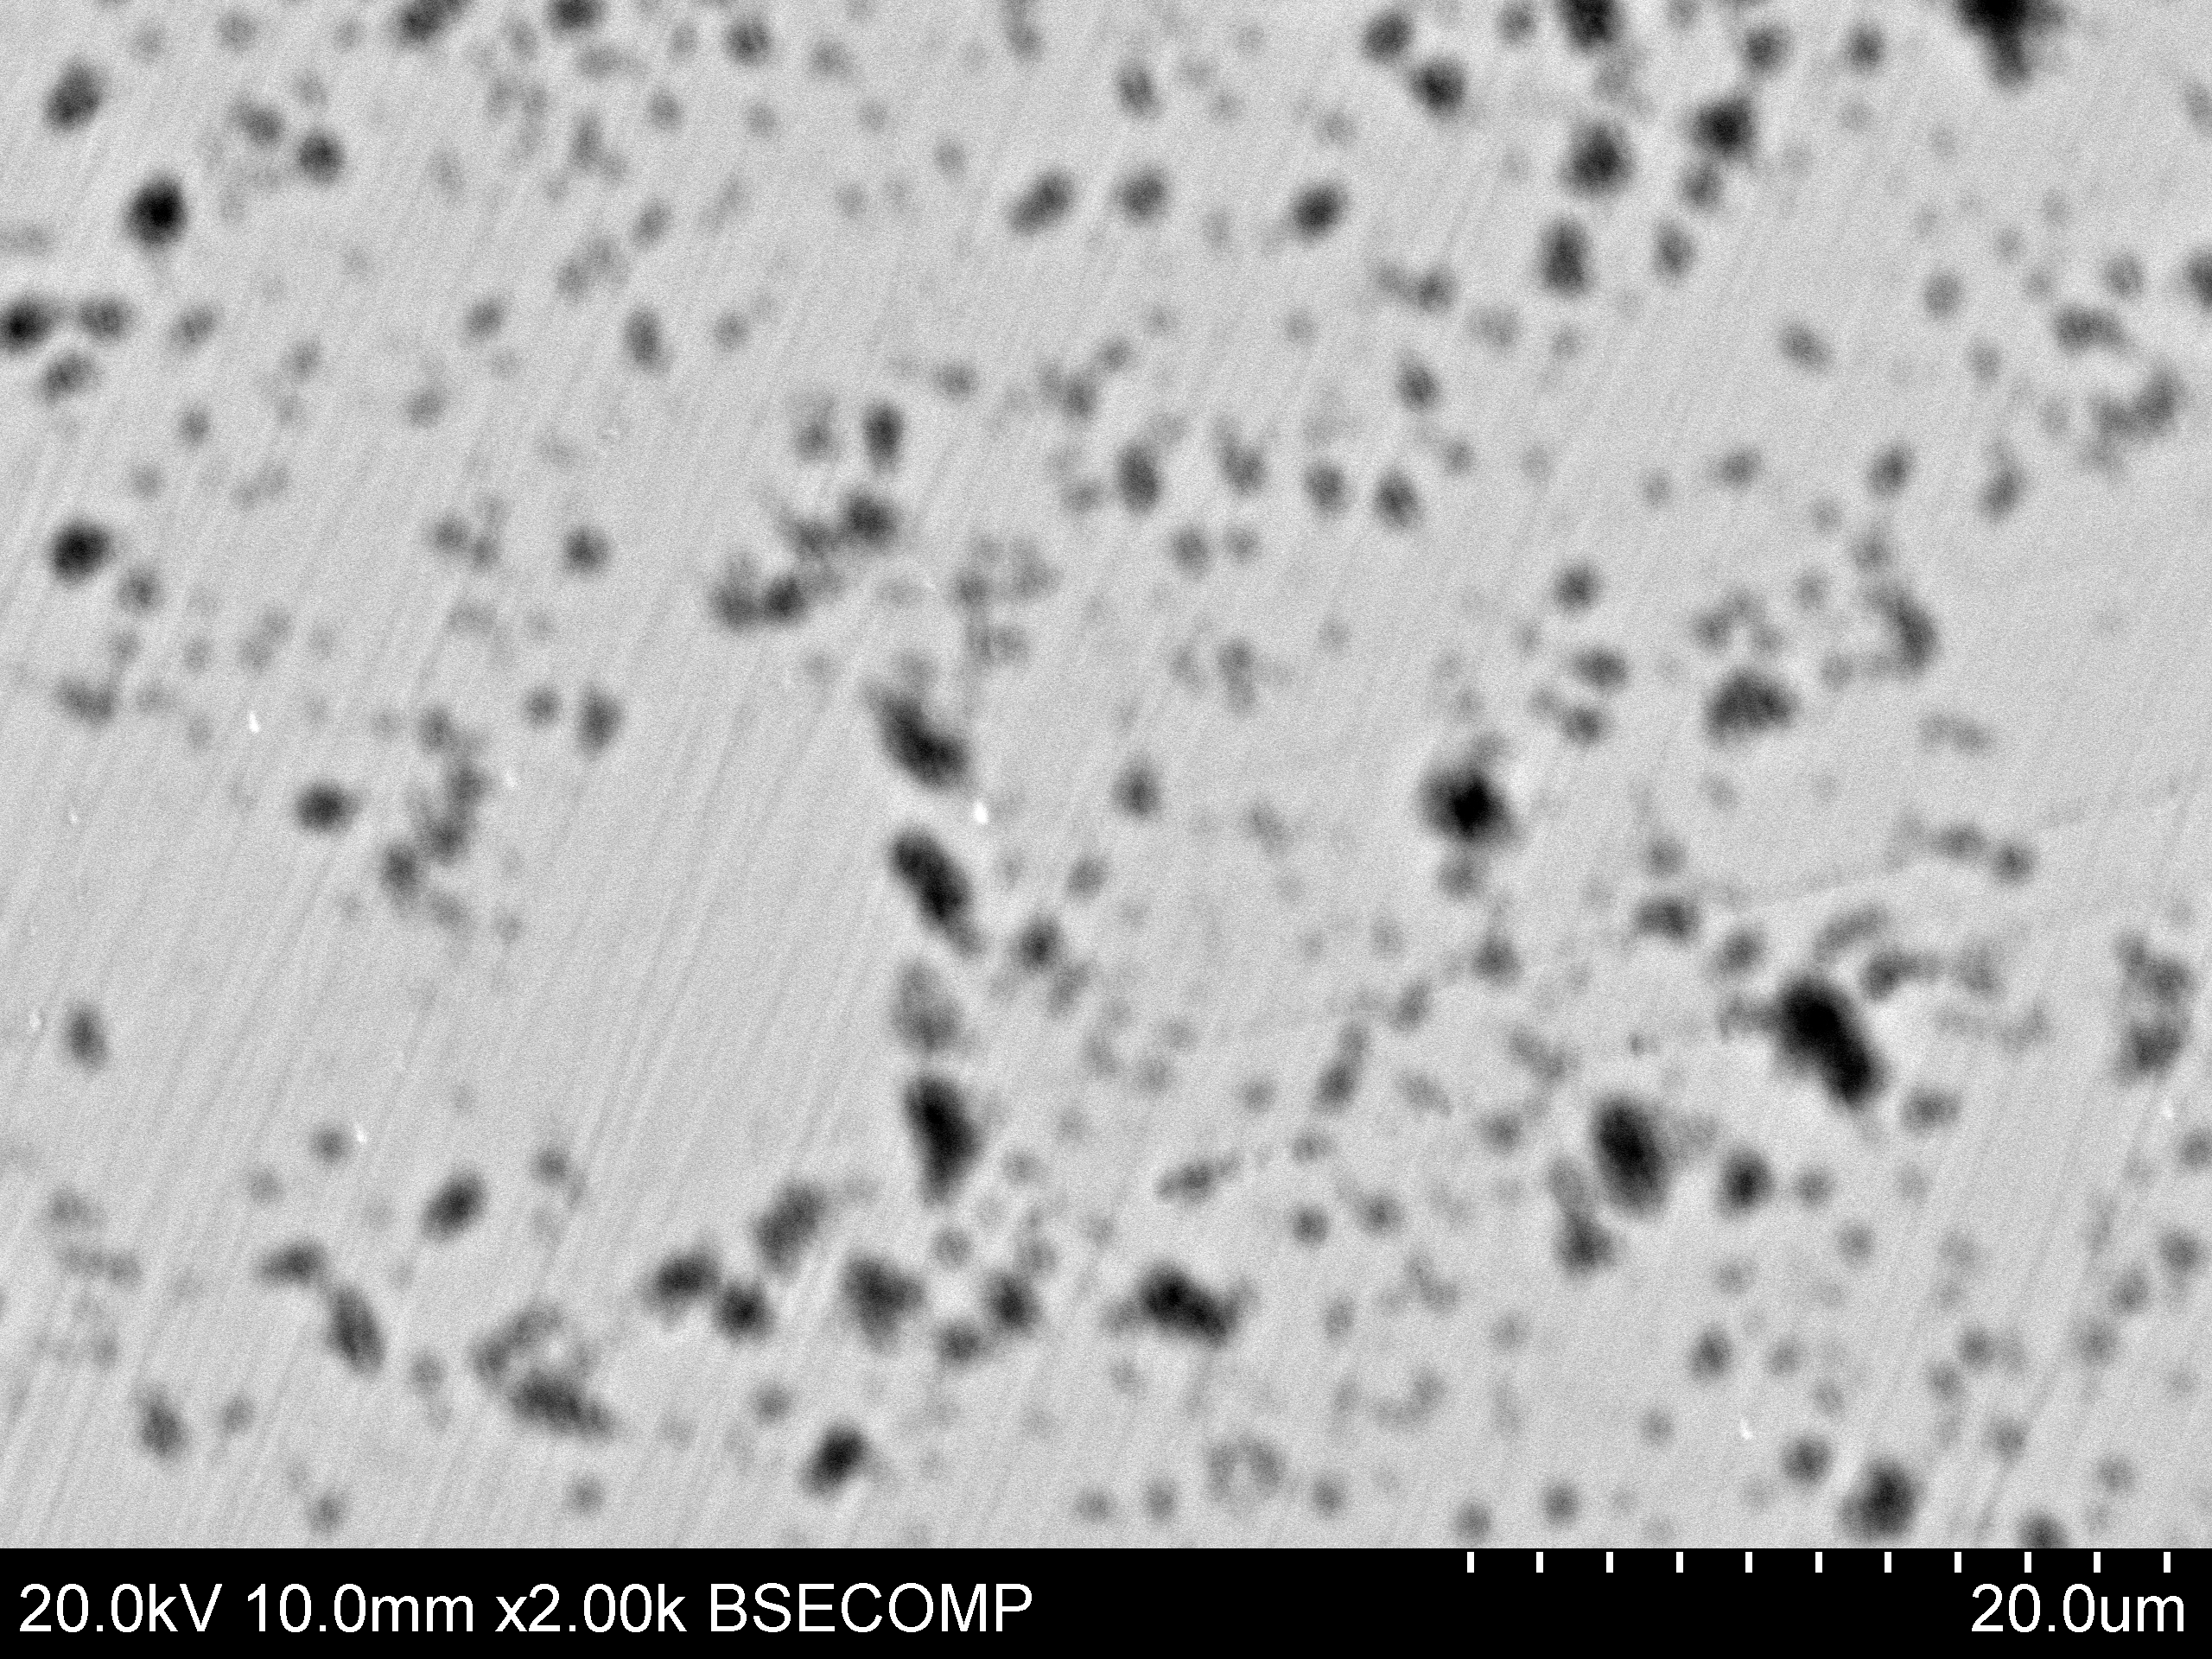
Figure 34 shows the bulk of the metallic bead with brighter silver-rich areas (e.g. Area A) and the darker Co-Ni-As phase (e.g. Area B). Many spherical voids were found (Figure 35), possibly suggesting that metallic silver prills were lost during the polishing (very dark areas), indicating a weak interface between the Co-Ni-As phase and the silver-rich phases.
Table 6 shows how the components from the ore partitioned into the glass and the metallic parts of the sample. Ticks denote whether an element was detected, even if it was only a minor component. More details are presented below.
| Raw materials | Products | ||||||
|---|---|---|---|---|---|---|---|
| slag/glass | metal | ||||||
| Element | bulk ore | silver phase in ore | added to ore | glass | metallic prills in glass | silver phase | non-silver phase |
| Silicon | ✔ | x | ✔ | ✔ | ✔* | x | x |
| Sodium | x | x | ✔ | ✔ | x | x | x |
| Calcium | ✔ | x | ✔ | ✔ | ✔* | x | x |
| Silver | ✔ | ✔ | x | x | ✔ | ✔ | x |
| Copper | x | x | x | x | x | ✔ | x |
| Nickel | ✔ | x | x | x | ✔ | ✔ | ✔ |
| Manganese | ✔ | x | x | x | x | x | x |
| Iron | ✔ | x | x | ✔ | x | x | x |
| Mercury | ✔ | ✔ | x | x | x | x | x |
| Antimony | ✔ | ✔ | x | x | x | ✔ | x |
| Magnesium | ✔ | ✔ | x | ✔ | x | ✔ | x |
| Sulphur | ✔ | x | x | x | ✔ | ✔ | ✔ |
| Cobalt | ✔ | x | x | ✔ | ✔ | ✔ | ✔ |
| Arsenic | ✔ | x | x | ✔ | ✔ | ✔ | ✔ |
| Tin | ✔** | x | x | x | x | x | x |
| Aluminium | x | x | ✔ | x | ✔ | ✔ | ✔ |
| * probably from glass surrounding the prill **only found in one analysis at 0.57%Sn |
|||||||
The added glass-forming materials (silica-soda-lime) were found predominantly in the glass part of the sample, with only very low amounts in the metallic bead. Alumina was not added or found in the ore but was used as an abrasive to polish the sample. Its presence in the metallic bead can therefore be attributed to contamination.
Silver was only detected in the metallic bead, apart from some small isolated prills found in the glass (Figure 33). Copper, which had not been detected in the ore, was only found in the metallic bead (Figure 34), suggesting that the low amounts in the ore concentrated in the metallic bead with the silver. Nickel also appears to concentrate in the metallic part as it was not detected in the glass. However, apart from some discrete particles found at high magnification, it was not found in the silver-rich phases. Manganese, which was detected at low percentages (0.4%) in one phase of the ore, was not found either in the glass or the metallic part of the sample, suggesting that it must form an unfound discrete phase, or that it was diluted beyond the limits of detection of the instrument. Iron was only detected in the glass. Mercury was detected in the silver phase of the ore, but not in the sample. This is probably because it is volatile and boiled off during processing. Antimony was found in the metallic bead as one of the phases within the silver-rich phase. Magnesium was found predominantly in the glass, with only low concentrations found in the non-silver phases of the metallic bead. Sulphur was only detected in the metallic bead, where it appeared to be associated with copper. Arsenic was detected in the glass and metallic bead. Cobalt was detected in the glass at quite high percentages (average 5.2%CoO). It was not found in the silver-rich phase of the metallic bead, apart from a few isolated particles of cobalt arsenide found at high magnifications (x5000). CoO was present at high concentrations (up to 30%CoO) in the cobalt-rich phase of the metallic part in association with nickel (4.4%NiO) and arsenic (42.9%As2O3) (Figure 35).
The main conclusion from these experiments is that a five-element ore can be fluxed to produce a cobalt-rich glassy material, and to separate the silver from components found in the ore. Although the metallic bead still contained cobalt in association with arsenic and nickel, it was malleable as the silver formed a discrete phase from the Ni-Co arsenides, i.e. working the bead or reheating it would easily remove the silver. The spherical voids possibly indicate that silver prills would separate easily from the surrounding phases (Figure 35).
In terms of partitioning, the experiments and the analytical method used suggest that any object made from the silver from such an ore system would have only copper, arsenic and sulphur distributed with the bulk, with antimony, nickel and cobalt being in discrete phases. The glass would have the usual base glass components, with arsenic in association with the cobalt. No silver was found in the glass, apart from isolated prills, suggesting that it would also not generally be detected in archaeological cobalt glass or frit. Iron would be elevated in the glass, although this may be difficult to ascertain because the silica source probably has variable levels of iron. However, it provides a possible explanation for the semblance of linearity between CoO and FeO in the frit (Figure 25), in that iron from skutterudite maintains some association with the cobalt in the glass phase. Furthermore, the fact that copper partitions with the silver provides an explanation for its low co-dependence with cobalt and with the other components in the glasses and frit. However, the experiments also show that when cobalt and nickel arsenides are abundant in the ore, they separate out into a discrete phase with the silver (probably because they have reached their solubility limit within the glass). This will not affect the relationship between cobalt and nickel found in cobalt-blue glass from both Egypt and Mesopotamia, as both separate out together. In other words, nickel only appears to partition in association with cobalt, which potentially explains why the linear relationship between nickel and cobalt prevails in the glasses (Figure 2, Figure 6 and Figure 24). However, it will clearly affect the absolute amounts of cobalt, nickel and arsenic present in the glassy slag (and therefore any glass subsequently coloured with this frit), potentially depending not only on the initial concentrations of these components but also on the processing conditions.
| % | Na2O | MgO | SiO2 | CaO | Fe2O3 | CoO | As2O3 |
|---|---|---|---|---|---|---|---|
| sample (n=5) | 11.1 | 1.4 | 60.0 | 11.3 | 2.9 | 5.2 | 8.1 |
| st. dev. | 0.2 | 0.2 | 0.3 | 0.4 | 0.4 | 1.0 | 2.0 |
| reheat 1 (n=5) | 11.3 | 1.7 | 68.6 | 11.5 | 2.7 | 3.1 | 1.1 |
| st. dev. | 0.2 | 0.0 | 0.1 | 0.1 | 0.1 | 0.1 | 0.1 |
| reheat 2 (n=5) | 10.9 | 1.7 | 69.2 | 12.0 | 2.8 | 2.7 | 0.6 |
| st. dev. | 0.0 | 0.0 | 0.4 | 0.2 | 0.0 | 0.3 | 0.1 |
| reheat 3 (n=5) | 10.6 | 1.8 | 70.8 | 11.9 | 2.5 | 2.4 | bdl |
| st. dev. | 0.1 | 0.1 | 0.3 | 0.1 | 0.1 | 0.2 | - |
Reheating experiments conducted on the glassy part of the sample showed that arsenic and cobalt levels decreased, and silica levels increased with respect to the sample produced (Table 7). The increase in silica concentration is probably a consequence of silica-rich phases dissolving into the glassy matrix, as evidenced by a noted decrease in the number of silica needles on each successive reheating cycle. Arsenic levels decreased from 8% in the produced sample to just over 1% after the first reheating cycle, to 0.6% after the second reheating and below the detection limit after the third cycle (highlighted in Table 7). These decreases in arsenic concentration were associated with decreases in the size and number of the bright phase (Figure 36). This was particularly evident after the third reheating cycle. Closer examination of this bright phase showed that it was predominantly cobalt and arsenic with a low percentage of nickel (58%Co, 28%As and 2%Ni, by element in normalised weight per cent).

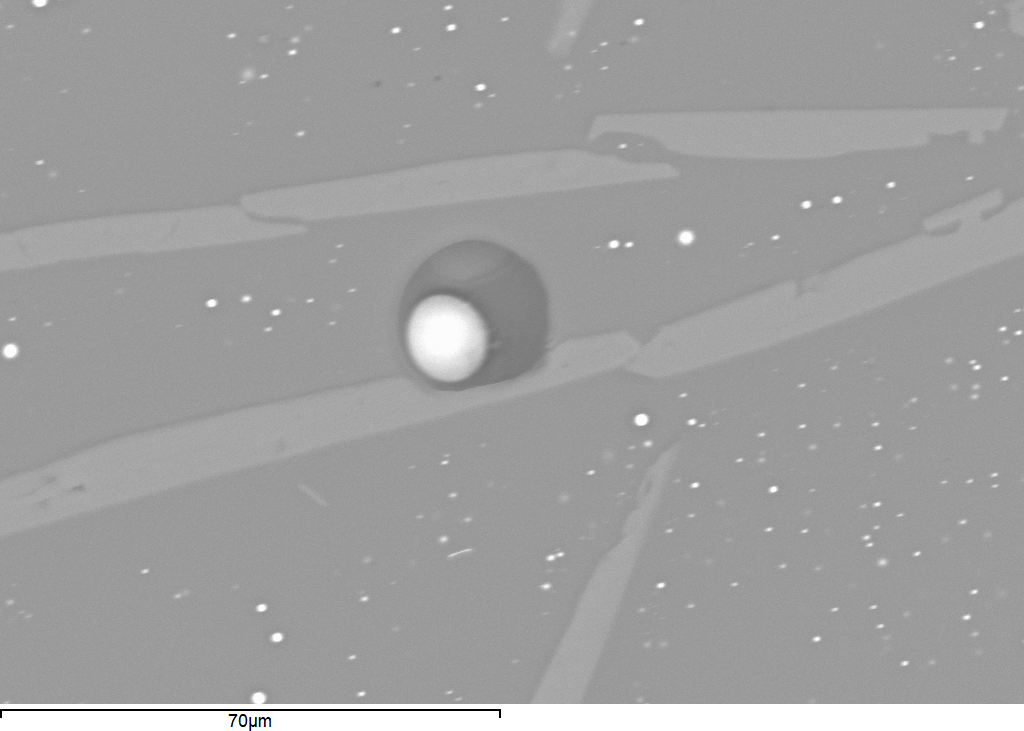
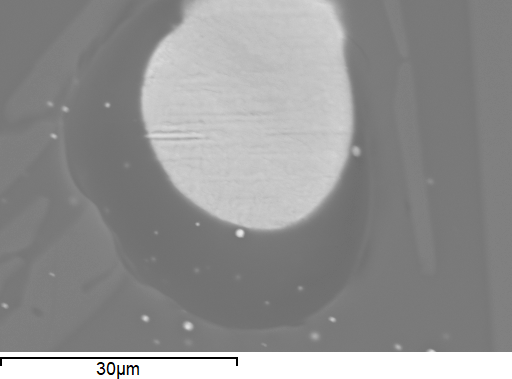
Figure 36 (a) shows a Co-As rich particle on a silica-rich needle, indicating that the silica provided a substrate for a reaction between cobalt and silica, potentially forming cobalt silicate, the compound responsible for the dark blue colour. The darker area surrounding the bright particle in Figure 36 (b and c) was predominantly cobalt and silica, without any detectable arsenic. This suggests that arsenic within the Co-As phase oxidised (probably forming As2O3, which has a boiling point of 465°C) as cobalt reacted with silica. Table 7 shows the composition of the original sample (from Table 4) and after three successive reheating cycles.
These experiments suggest that arsenic deriving from the Co-Ni-As ore is volatile. CoO levels also decreased on reheating (Table 7). Although cobalt oxides may convert to different forms at higher temperatures, they are unlikely to form volatile compounds. It is more likely that cobalt in the bulk glass reacted with the silica with successive heating as observed in Figure 36 (i.e. areas that were avoided for bulk measurements), thereby reducing the amount of cobalt in the bulk. This is supported by the decrease in variation in cobalt concentrations after reheating (Table 7). In effect, successive reheating of the glass resulted in further dissolution of silica, reactions between silica and cobalt, and the release of arsenic, probably in the form of a gaseous product. It should also be noted that these reheating experiments were conducted without stirring or working the glass, which would presumably remove arsenic even more readily.
In effect, these reheating experiments suggest that arsenic is not a reliable indicator to provenance glass, and that glass with low arsenic levels could have derived from an arsenic-rich ore as suggested in Section 4.5 with regard to archaeological cobalt-blue glasses and frit.
Internet Archaeology is an open access journal based in the Department of Archaeology, University of York. Except where otherwise noted, content from this work may be used under the terms of the Creative Commons Attribution 3.0 (CC BY) Unported licence, which permits unrestricted use, distribution, and reproduction in any medium, provided that attribution to the author(s), the title of the work, the Internet Archaeology journal and the relevant URL/DOI are given.
Terms and Conditions | Legal Statements | Privacy Policy | Cookies Policy | Citing Internet Archaeology
Internet Archaeology content is preserved for the long term with the Archaeology Data Service (ROR). Help sustain and support open access publication by donating to our Open Access Archaeology Fund.