Cite this as: Gaffney, V. et al. 2020 A Massive, Late Neolithic Pit Structure associated with Durrington Walls Henge, Internet Archaeology 55. https://doi.org/10.11141/ia.55.4
| ID | Parish | Radius | Depth | Dating | Aerial | Geophysics | Borehole | Excavation | Investigator |
|---|---|---|---|---|---|---|---|---|---|
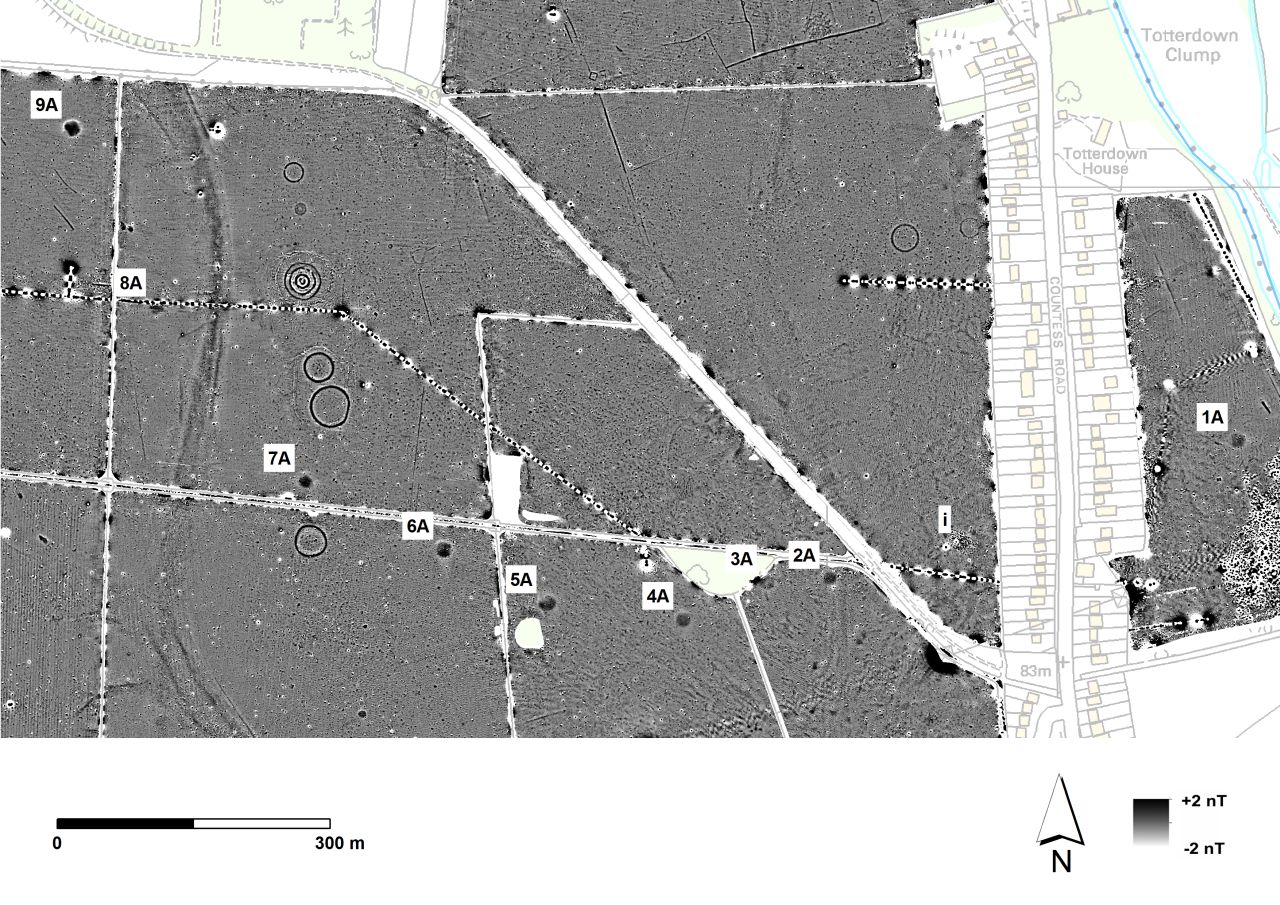
| 1A | Amesbury | c.17m | - | - | - | Y | - | - | SHLP |
| 2A | Amesbury | c.15m | - | - | - | Y | - | - | SHLP |
| 3A | Amesbury | c.17m | - | - | - | Y | - | - | SHLP |
| 4A | Amesbury | c.17m | - | - | Y | Y | - | - | SHLP |
| 5A | Amesbury | c.20m | >7m* | MBA | - | Y | Y | - | SHLP |
| 6A | Amesbury | c.19m | - | - | Y | Y | - | - | SHLP |
| 7A | Amesbury | c.15m | <5m | - | Y | Y | Y | - | SHLP |
| 8A | Amesbury | c.18m | <5m | LN | - | Y | Y | - | SHLP |
| 9A | Amesbury | c.19m | - | - | Y | Y | - | - | SHLP |
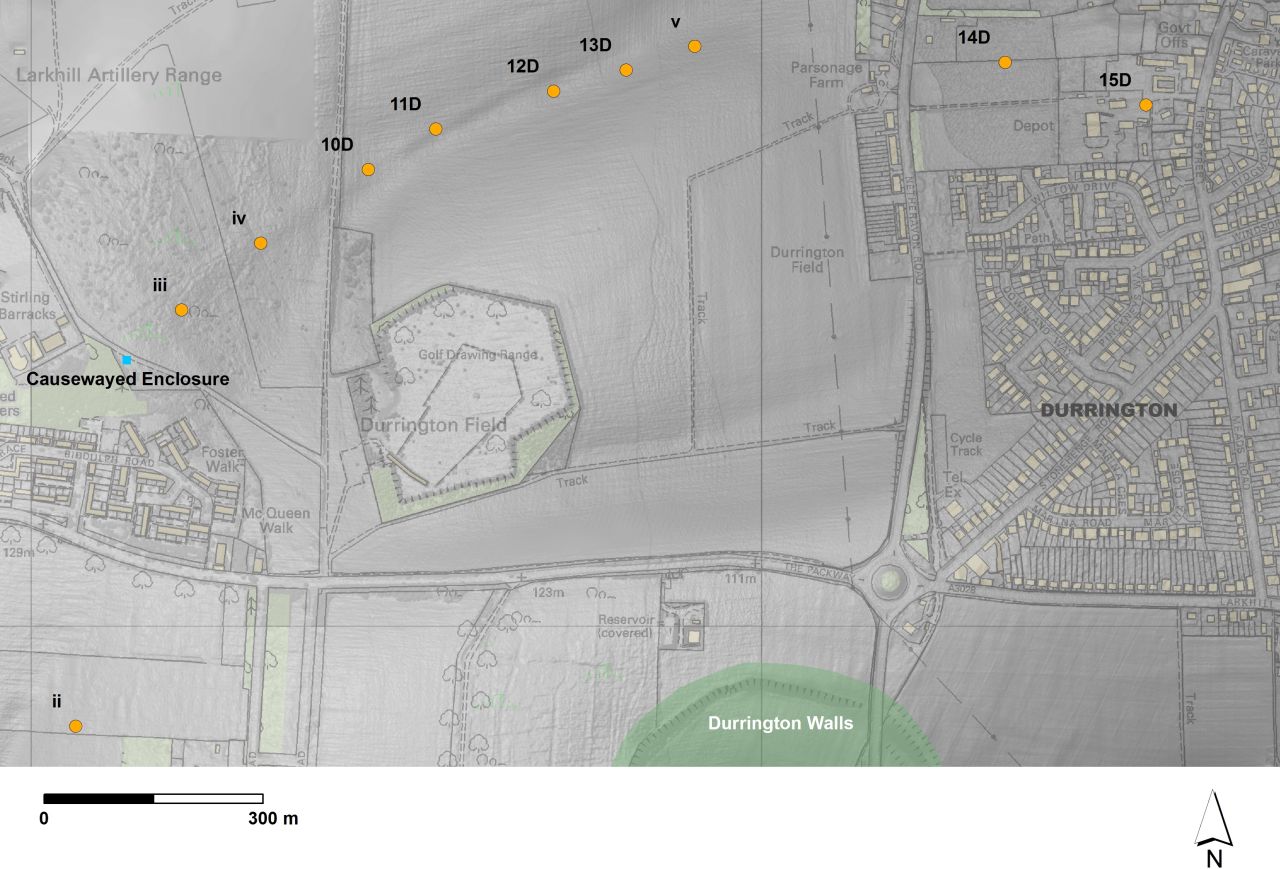
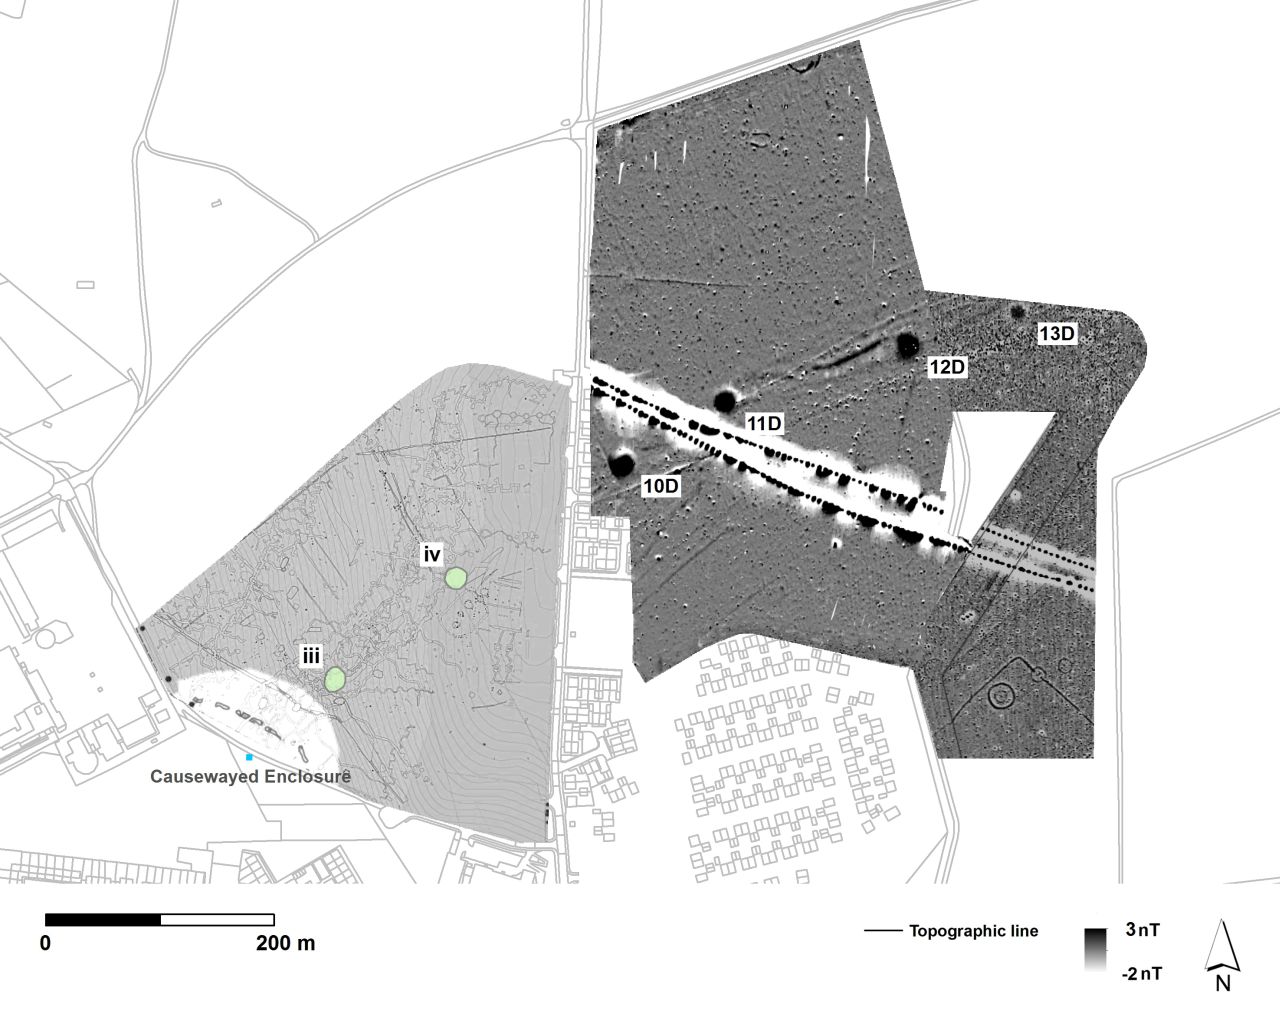
| 10D | Durrington | c.22m | >2m* | MBA | - | Y | - | Y | WA |
| 11D | Durrington | c.18m | >2.5m* | BA | - | Y | - | Y | WA |
| 12D | Durrington | c.20m | - | - | - | Y | - | - | WA |
| 13D | Durrington | c.15m | - | - | Y | Y | - | - | WA |
| 14D | Durrington | c.23m | >3.1m* | LN,MBA, RB | - | - | - | Y | WA |
| 15D | Durrington | c.20m | >6m* | RB | - | - | Y | Y | WA |
| i | Amesbury | c.20m | - | - | - | Y | - | - | SHLP |
| ii | Durrington | c.18m | - | - | Y | - | - | - | NMP |
| iii | Durrington | c.19m | - | - | - | Y | - | Y | WA |
| iv | Durrington | c.19m | - | - | - | Y | - | Y | WA |
| v | Durrington | c.18m | - | - | Y | - | - | - | SHLP |
* not bottomed
SHLP = Stonehenge Hidden Landscapes Project
NMP = National Mapping Programme
WA = Wessex Archaeology
LN: Late Neolithic, BA: Bronze Age, MBA: Middle Bronze Age, RB: Romano British
| Fluxgate gradiometer survey - motorized | |
|---|---|
| Sampling | 0.125m x 0.25m, zigzag |
| Grid Size | Custom |
| Instrument | Foerster Ferex 10-probe (650mm length) array x2 |
| Configuration | 0.2nT |
Ten Ferex fluxgate probes were mounted at 0.25m separation to two custom-built, long non-magnetic carts and towed 7m behind low impact ATV Quad bikes. The system was based on an A/D converter and data logging software developed by Eastern Atlas. Magnetic measurements were sampled at 0.125m inline intervals and logged by onboard laptop using in-house software, which also provided navigation aids via an integrated DGPS unit. An odometer control unit was built and integrated with fibre optics into the system to account for GPS coverage fallout and positional control.
Raw data were downloaded and processed using in-house software (apmag) developed by the LBI ArchPro and ZAMG (Central Institute for Meteorology and Geodynamics, Austria). Processing included zero-mean traverse and the correction of any positional irregularities using time stamps collected with the integrated DGPS receiver during survey.

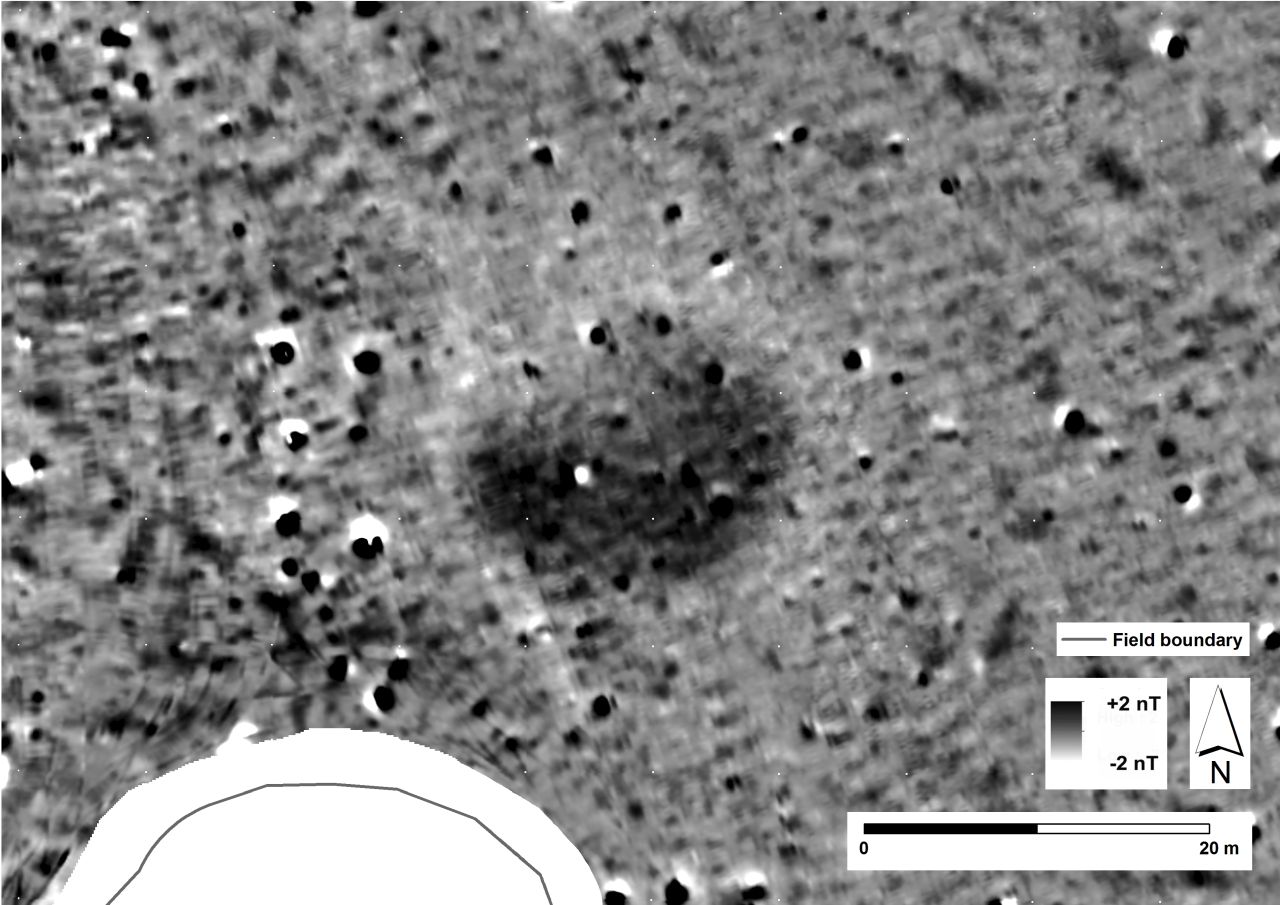
Magnetic survey revealed a broad, positive pit-like response c.18m in diameter, surrounded by a fainter, less magnetic halo. The feature coincides with a concentration of worked flint of similar size and form, identified during archaeological investigations in the mid-1990s (Batt 2003, fig. 1). Subsequent evaluation seems not to have specifically targeted the feature but did reveal significant Neolithic activity in the area (Batt 2003, 3-4; Wright and Moore 2004).
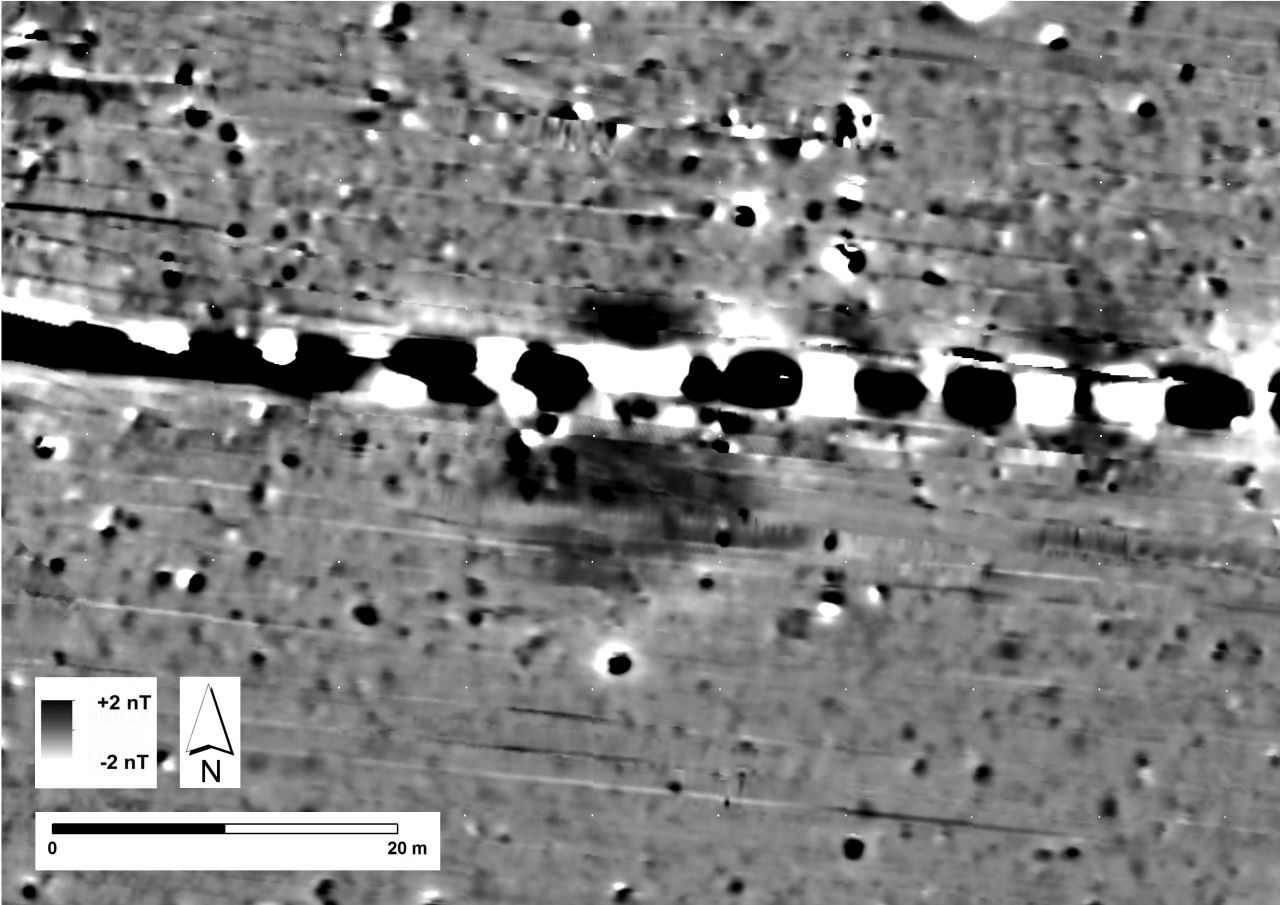
Magnetic survey revealed broad, positive pit-like anomaly, c.16m in diameter, and situated within 40m of the line of the former Larkhill light military railway depicted on historic Ordnance Survey mapping. This feature had not been recorded previously
Magnetic survey reveals a broad pit-like anomaly c.17m in diameter, surrounded by a very faint magnetic halo. The feature is obscured to the north-west by interference from a metallic fence forming the field boundary with an adjacent copse (Half Moon Clump). This feature had not been recorded previously.
Magnetic survey revealed a broad pit-like anomaly c.19m in diameter with a pronounced halo effect to the north-west. It coincides, approximately, with aerial photography transcripts of an ellipsoidal crop mark interpreted as a bank (Crutchley 2002). Anomaly 4A also lies adjacent to the documented location of a levelled round barrow or ring ditch, Amesbury 151 (RCHME 1979). This was recorded 400m north of the A303 Countess Farm (SM10414 – Heritage List Entry No. 1009138 – Historic Environment Record PRN14488). No round barrow is documented by Grinsell at this location (1957).
Magnetic survey revealed a broad, positive pit-like anomaly with a diameter of c.14m, surrounded by a fainter, less magnetic halo. This feature had not been recorded previously.

Magnetic survey revealed a broad, positive pit-like anomaly, c.19m in diameter and surrounded by a fainter, less magnetic halo. It coincides with aerial photography transcripts of a circular crop mark interpreted as a bank (Crutchley 2002). The location was previously documented as the position of levelled round barrow or ring ditch Amesbury 146 (RCHME 1979), and is located 450m north of the A303 Countess Farm (SM10413 – Heritage List Entry No. 1009137 – Historic Environment Record (PRN14487). No round barrow is documented by Grinsell at this location (1957).

Magnetic survey reveals a broad, positive pit-like anomaly with diameter of c.15m, surrounded by a fainter, less magnetic halo. This feature was previously recorded as a slight surface dip associated with a soil discolouration (Papworth 2009). The anomaly also coincides, in part, with a large, circular feature, 30m in diameter. This was identified during the National Mapping Programme as a ring ditch (Crutchley 2002). Both previously recorded features are situated just off the northern edge of a farm track that bisects Countess Farm fields. No round barrow is documented by Grinsell at this location (1957).
Magnetic survey revealed a broad, positive anomaly, c.18m in diameter. It may be surrounded by a weakly magnetic halo, but the response is partially obscured by a metallic water pipe that cuts the north side of the feature. This feature had not been recorded previously.
Magnetic survey reveals a broad, positive anomaly c.18m in diameter, and surrounded by a pronounced weakly magnetic halo. It coincides generally with aerial photographic transcripts of a circular crop mark, interpreted as a ring ditch (Crutchley 2002). The area has been scheduled as the location of a bowl barrow, 170m south-east of Strangways on Countess Farm (SM 10424 – Heritage List Entry No. 1009145 – Historic Environment Record PRN14482). Neither the RCHME (1979), nor Grinsell (1957), document a round barrow at this location.

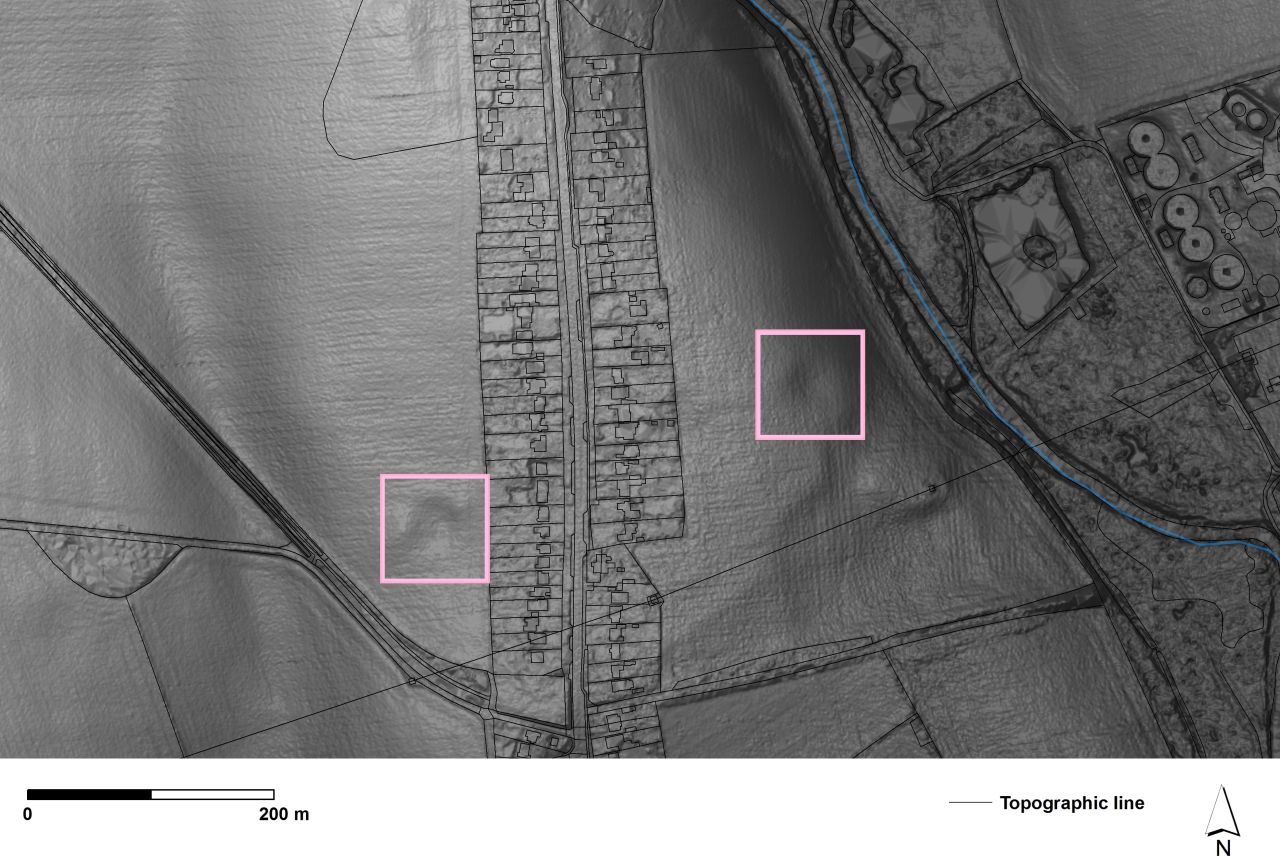
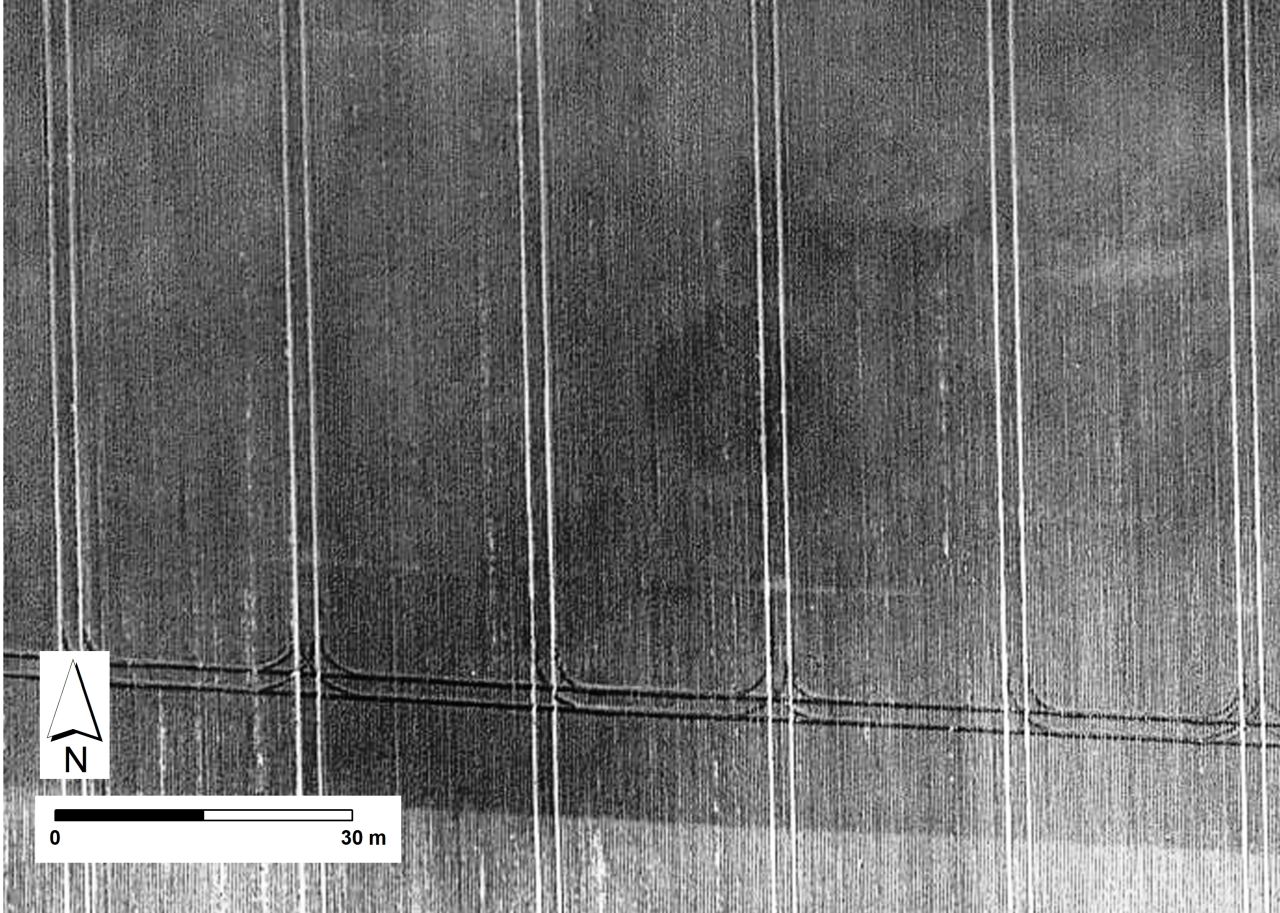
A circular feature, c.17m in diameter (Figures 1.1 and 1.12). It coincides with a large, surface depression present in the topographic data (Figure 1.13), and a concentration of strong dipolar responses. These are ferrous in character and may indicate the intentional infilling of the area with magnetic debris. The strong response of the overlying magnetic debris may obscure any underlying, weaker, magnetic features. The feature is situated within 100m of the line of the former Larkhill light military railway which runs to the west and south of the area, close to the point where it crossed Countess Road.
Anomaly i is identified as potentially of interest on the basis that (a) it is situated on the line of the arc between anomalies 1A–4A and (b) the area of magnetic disturbance is broadly similar in size and form to anomalies 1A-9A. This feature had not been recorded previously.

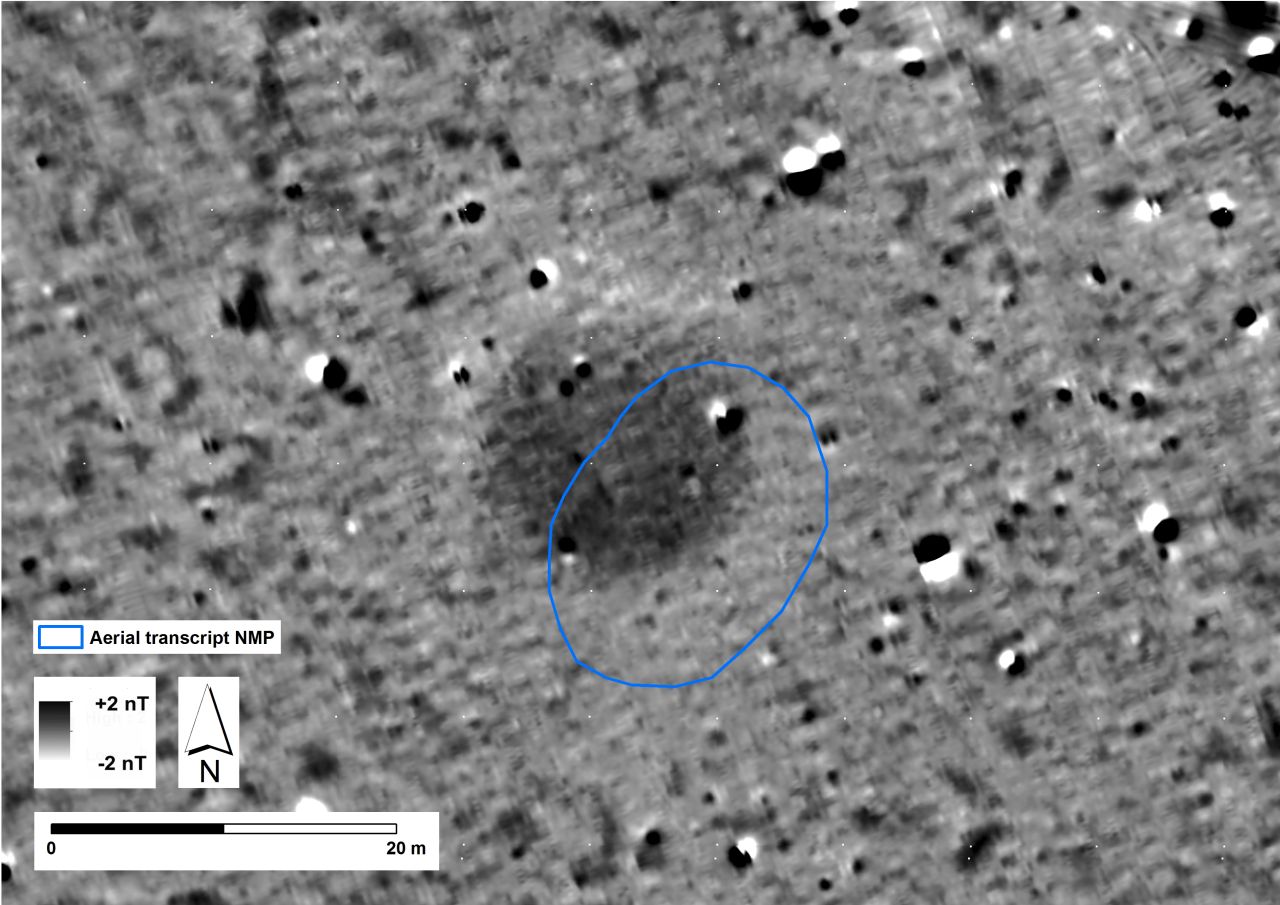
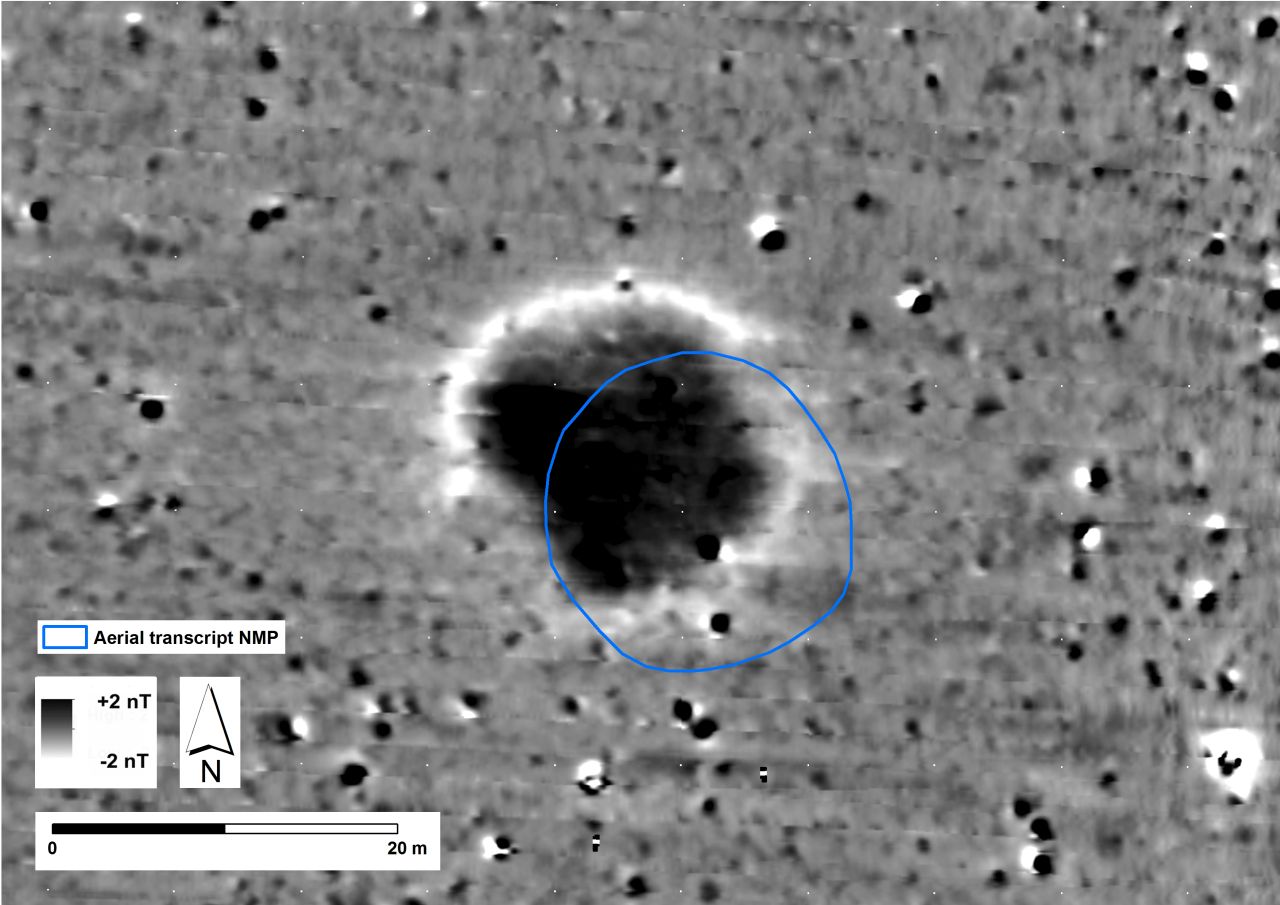
A circular feature measuring c.18m in diameter recorded as part of the National Mapping Programme and interpreted as a circular bank (Crutchley 2002). The position coincides with a surface depression noticeable in the topographic data (Figure 1.12).
Anomaly ii is identified as a potential feature of interest on the basis that;
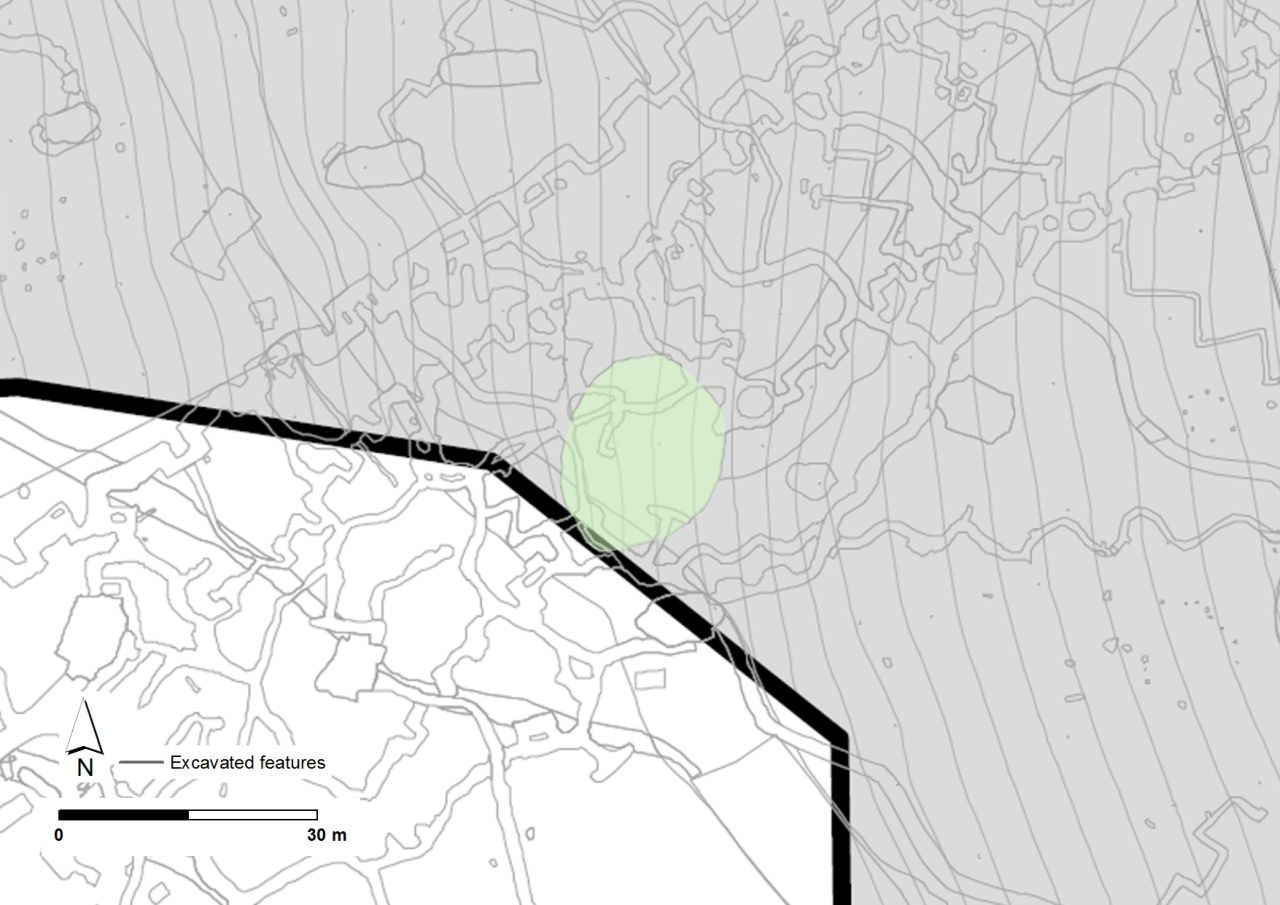
A circular feature c.19m in diameter, recorded during developer-led archaeological investigations in 2016 (DIO 2017, Constraints and Opportunities Plan, 20). It is identified as a potential feature of interest on the basis of its dimensions and alignment with feature iv and geophysical anomalies 10D-13D to the east.
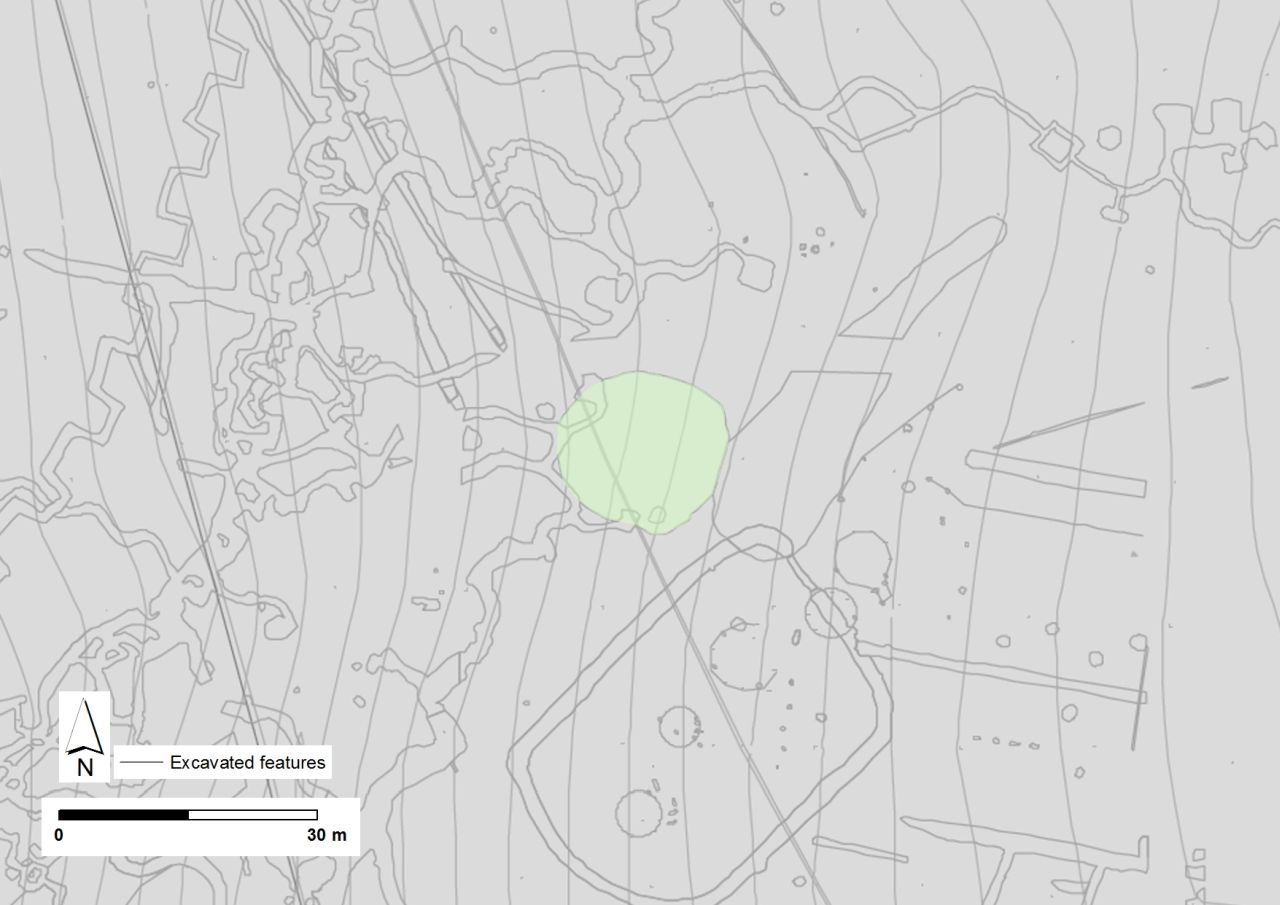
An ellipsoidal feature c.22m x 18m in dimension, recorded during developer-led archaeological investigations in 2016 (DIO 2017, Constraints and Opportunities Plan, 20 and Figure 1.13). It is identified as a potential feature of interest on the basis of its dimensions and alignment with feature iv and geophysical anomalies 10D-13D to the east.
A disc-like crop mark measuring c.18–19m in diameter. It is identified as a potential feature of interest on the basis of its dimensions and alignment with geophysical anomalies 10D-13D to the west.
A large circular anomaly, with no associated ferrous responses, was identified during caesium vapour magnetometer survey in 2014. It was interpreted as an infilled solution hollow or pit (Urmston 2014; Leivers and Thompson 2015).
Excavation of sample trench (107) in 2015 exposed the feature, which was interpreted as a sinkhole (10704). At approximately 1m below the current ground surface the feature measured c.22m in diameter. The feature was excavated to a depth of over 2m but was not bottomed owing to health and safety concerns. It had a steep edge (45°) and was filled with a series of erosion deposits. The sediments included struck flint and pottery identified as Late Bronze Age or Early Iron Age.
A large circular anomaly, with no associated ferrous responses, was identified during caesium vapour magnetometer survey in 2014. It was interpreted as an infilled solution hollow or pit (Urmston 2014; Leivers and Thompson 2015).
Excavation of sample trench (112) in 2015 exposed the feature (11207) c.1.2m below the current ground surface. The feature was at least 18m in diameter and excavated to 1.5m: it was not bottomed owing to health and safety concerns. The feature had a moderately steep (c.40°) edge and was filled with a homogeneous loose pale yellow-brown silty clay. Cultural material, interpreted as potentially Bronze Age, was recorded in the fill.

A large circular anomaly, with no associated ferrous responses, was identified originally during caesium vapour magnetometer survey in 2014. It was interpreted as an infilled solution hollow or pit (Urmston 2014 and Schmidt and Crabb 2017)
A large circular anomaly, with no associated ferrous responses, was identified during caesium vapour magnetometer survey in 2014. It was interpreted as an infilled solution hollow or pit (Schmidt and Crabb 2017).
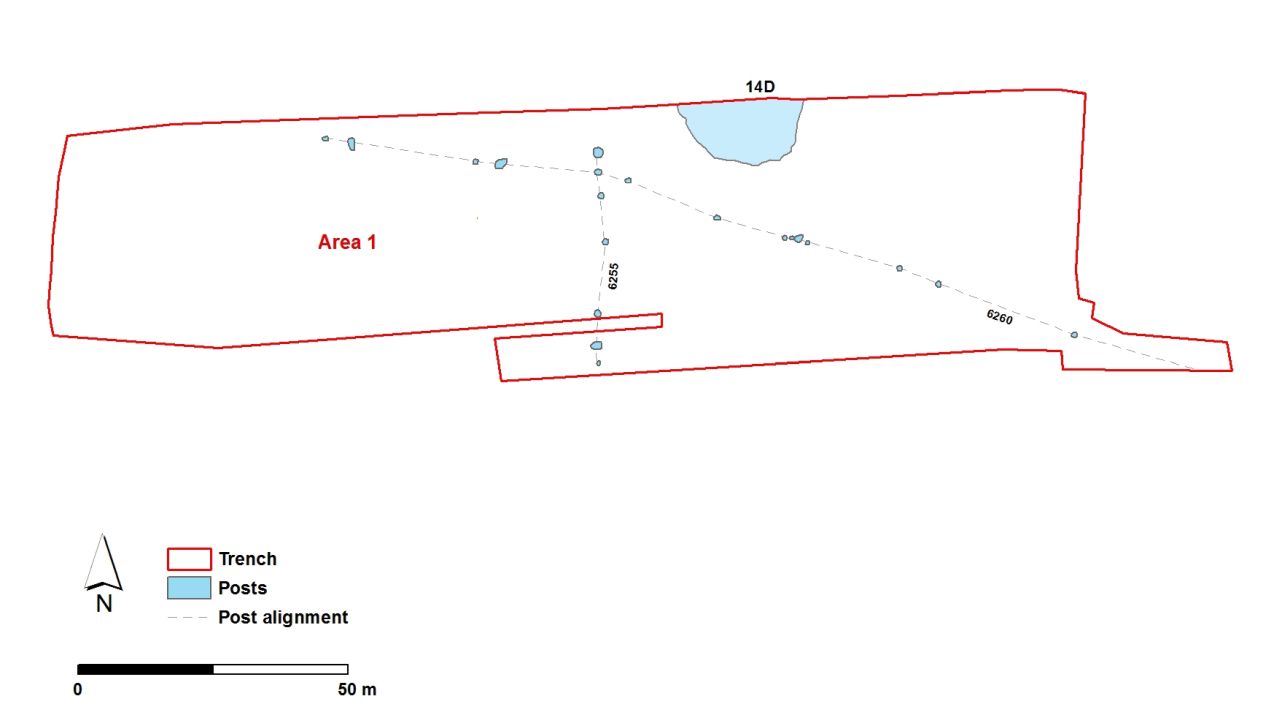
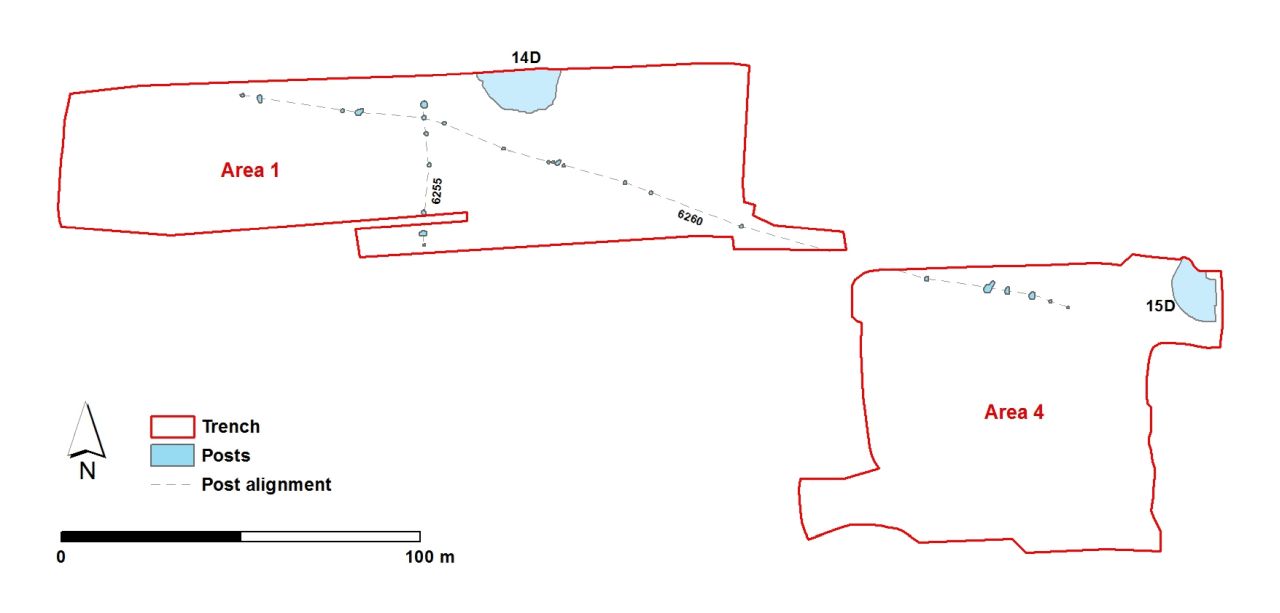
Feature 14D was located during excavation at the site of the former Ministry of Defence Headquarters at Durrington by Wessex Archaeology. Interpreted as a natural sinkhole, the feature (6257 in area 1) measured 23m in diameter, with a 7m wide natural solution shaft at its centre. It was partially excavated to a depth of 3.1m but not bottomed. Evidence for Neolithic activity was associated with this feature. Two intersecting post-hole alignments were located south of feature 14D and 15D (Figure 1.25). One of these alignments comprised 16 post-holes; irregularly spaced and between 4.8m and 27m apart. These were recorded by the excavators over a distance of 240m, and probably continued east and west beyond the excavation trench (Thompson and Powell 2018, fig. 3.1). Radiocarbon dates from these features provided a construction date for the post alignments between 2670–2550 cal BC ((86.6%) at 95% probability) and a date for the decommissioning of the alignments within the range of 2575–2470 cal BC (at 95% probability), Thompson and Powell 2018, 111).
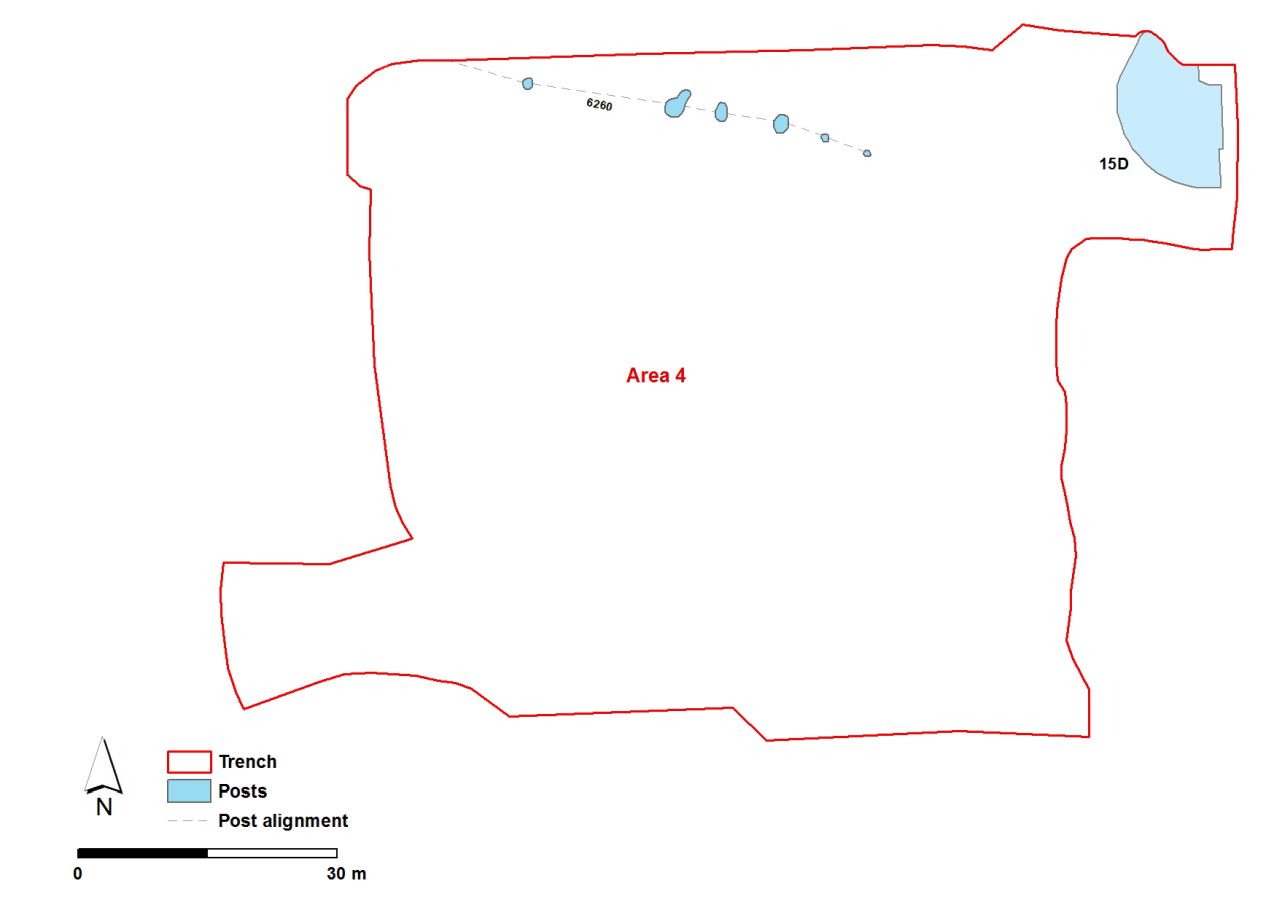
Feature 15D was located during excavation at the site of the former Ministry of Defence Headquarters at Durrington by Wessex Archaeology. Interpreted as a natural sinkhole, this feature (6513 in Area 4) measured c.20m in diameter and was partially excavated to a depth of 1.2m. Its (assumed) central shaft was machine-augured to a depth of 6m but not bottomed. A total of 72 pieces of residual struck flint were recovered from the upper fills of this feature. The excavators could not rule out a potential significance for this feature during the Late Neolithic.
Two intersecting post-hole alignments were located south of feature 14D and 15D (Figure 1.25). One comprised 16 post-holes; irregularly spaced and between 4.8m and 27m apart. These were recorded by the excavators over a distance of 240m, and probably continued east and west beyond the excavation trench (Thompson and Powell 2018, fig. 3.1). Radiocarbon dates from these features provided a construction date for the post alignments between 2670–2550 cal BC ((86.6%) at 95% probability) and a date for the decommissioning of the alignments within the range of 2575–2470 cal BC (at 95% probability), Thompson and Powell 2018, 111).
Internet Archaeology is an open access journal based in the Department of Archaeology, University of York. Except where otherwise noted, content from this work may be used under the terms of the Creative Commons Attribution 3.0 (CC BY) Unported licence, which permits unrestricted use, distribution, and reproduction in any medium, provided that attribution to the author(s), the title of the work, the Internet Archaeology journal and the relevant URL/DOI are given.
Terms and Conditions | Legal Statements | Privacy Policy | Cookies Policy | Citing Internet Archaeology
Internet Archaeology content is preserved for the long term with the Archaeology Data Service (ROR). Help sustain and support open access publication by donating to our Open Access Archaeology Fund.
 Home
Home