Cite this as: Gaffney, V. et al. 2020 A Massive, Late Neolithic Pit Structure associated with Durrington Walls Henge, Internet Archaeology 55. https://doi.org/10.11141/ia.55.4
| Ground Penetrating Radar – cart system | |
|---|---|
| Sampling | 0.05m x 0.25m, 0.05 x 0.5m, zigzag |
| Grid Size | 30m x 30m |
| Instrument | Mala X3M |
| Configuration | 500MHz and 250MHz antennae |
| Ground Penetrating Radar – cart system | |
|---|---|
| Sampling | 0.08m x 0.08m, zigzag |
| Grid Size | Custom |
| Instrument | Mala 16-channel MIRA imaging system |
| Configuration | 400MHz |
Survey was undertaken over four anomalies, 1A, 5A, 7A and 8A, with a Mala GeoScience X3M single channel GPR system; the antennae (250MHz or 500MHz) were mounted on a cart with integrated odometer and controlled via an X3M Ramac control unit and XVII monitor. All survey grids were located to OSGB36 (15) with a DGPS unit (Leica GS16 GNSS Rover).
| 2016 | ||
|---|---|---|
| ID | Survey | MHz |
| Barrow group A147–150 | area | 400 |
| August 2019 | October 2019 | |||||||||
|---|---|---|---|---|---|---|---|---|---|---|
| ID | Survey | MHz | Transects | No. | Survey | MHz | Transects | No. | ||
| 1A | Profile | 250 | W–E | N–S | 2 | |||||
| 5A | Profile | 250 | NW–SE | NE–SW | 2 | |||||
| 7A | Profile | 500 | W–E | N–S | 2 | Area | 250 | W–E | 120 | |
| 8A | Area | 250 | W–E | 61 | ||||||
| 8A | Area | 500 | W–E | 61 | ||||||
Raw data were downloaded, positioned and processed using GPR-Slice processing software. This was also used to generate profiles (radargrams) and depth-slice images (time-slices). All images were located to grid outlines collected with DGPS in real world coordinates.
Radargram profiles were produced after applying minimal processing and included time-zeroing and background filter removal. Signal velocity was set according to calculations from hyperbola testing of select radargrams. Further processing was implemented to enhance the signal where necessary, including bandpass filters, deconvolution and migration. Time-slices were produced at 10cm depth intervals from radargrams processed with background filters, migration process and Hilbert transforms.
Feature 1A was profiled with a 250MHz and 500MHz antenna across 30m transects and aligned N–S and W–E. The area is normally under crop and had been recently harvested. Survey was undertaken during a protracted period of unusually dry weather and consequently ground conditions were extremely dry. The underlying bedrock is documented as Seaford Chalk formation (2018 BGS 1:10000), although archaeological evaluation in the 1990s noted a local presence of complex drift geology, including the presence of clay and green sand outcrops, with frequent changes across this field (Batt 2003, 1).
Velocity was estimated at 0.1m/ns for processing purposes. Profiles across the feature produced noisy results – probably owing to high clay content of the subsoil. This would also attenuate the signal strength and limit penetration depth. Processing revealed a change in the underlying geology at approximately 40-50cm depth and this broadly coincides with magnetic anomaly 1A. Below this depth information regarding feature depth is not discernible and processing was unable to enhance the signal.
Velocity estimation was set to a 0.1m/ns for processing purposes. Profiles across the feature produced noisy results – again probably owing to high clay content of the subsoil. Further processing of the profiles cleared some of the noise to reveal (perhaps) the shallow outline of a feature reaching approximately 120cm in depth.
Feature 5A was profiled with a 250MHz antenna using 50m transects aligned NW–SE and NE–SW. The area had been drilled in late summer and ground conditions were dry.
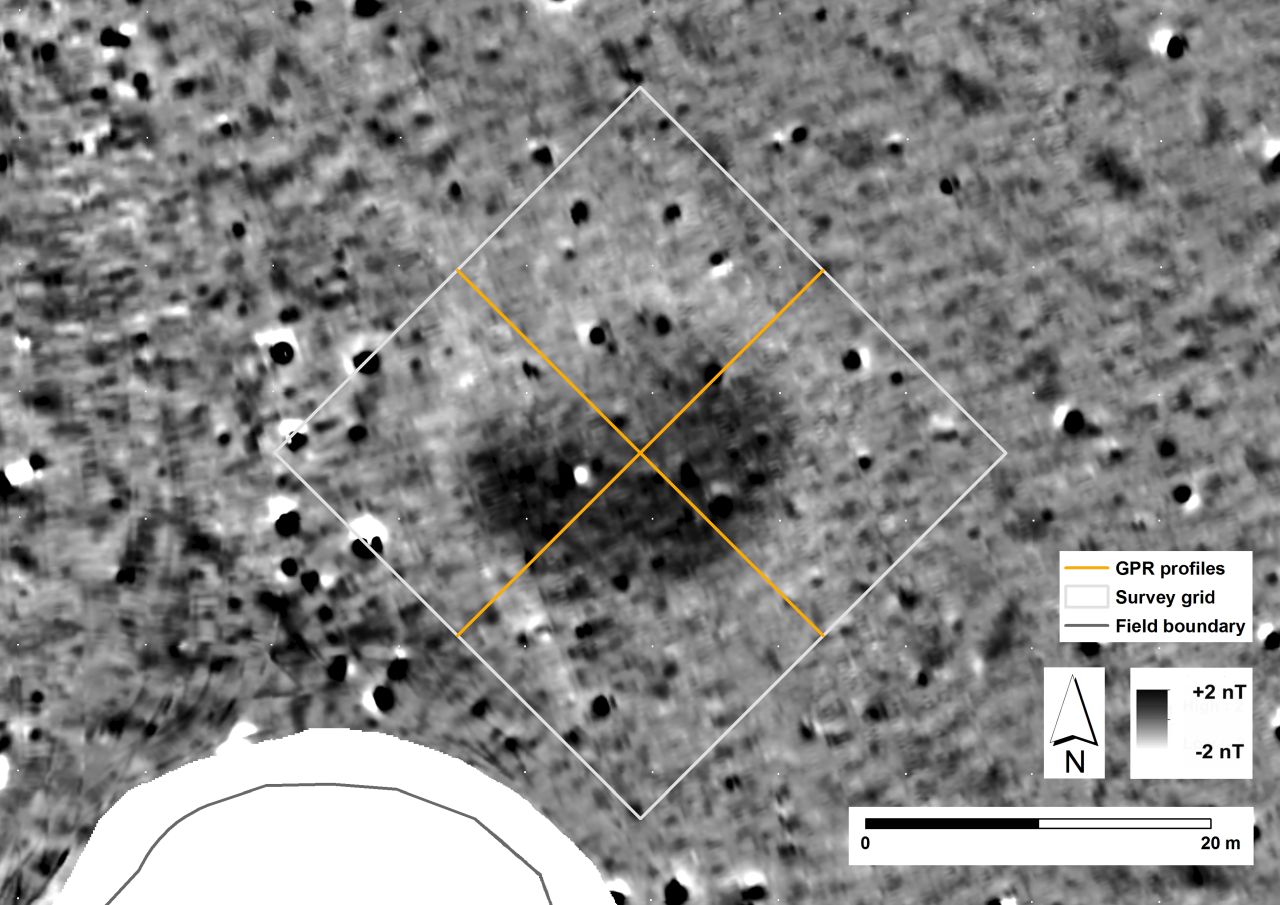
Velocity was estimated at 0.1m/ns for processing purposes. Profiles across the feature produced noisy results. This was probably owing to high clay content of the subsoil. This would also attenuate the signal strength and limit penetration depth. Further processing of the profiles was able to identify a faint cut feature of c.20m length NW–SE and c.15m SW-NE. The cut seems to be more gradual on the slightly lower, eastern, half of the feature, and steeper on the slightly higher, western, side. Other faint traces related to the feature could be tentatively identified at lower levels. The vertical 'ringing' throughout the radargrams is a result of bounce over the surface, which resulted from collecting data at angles to the modern ploughing.
Feature 7A was initially surveyed by the SHLP in 2012 as part of the large area fluxgate gradiometer survey. Following the identification of the pit group within the magnetic data, this feature was included in a follow-up GPR survey (400MHz) in 2016 targeting barrow group Amesbury 147–150. It was again re-visited and profiled in August 2019 with a 500MHz antenna using 30m transects aligned N–S and W–E. The area was under crop until 2012, when it was re-established as wild grassland. Survey profiles were undertaken over long grass and during a protracted period of unusually dry weather. Ground conditions were extremely dry.
Subsequently, a further full area survey was carried out over feature 7A in October 2019 with a 250MHz antenna at 0.25m intervals in W–E direction across a 30m x 30m area grid. Survey guidelines assisted navigation along transects. Surface ground conditions varied because an early frost thawed and then dried out during the course of the survey.
An open water pipe trench close to the survey area demonstrated the topsoil to be c.30cm deep above the chalk bedrock.
Signal velocity was set to 0.07m/ns, as calculated from hyperbola testing. Central radargram 8295 clearly reveals a c.20m feature within the chalk bedrock at c.30cm, decreasing steadily to c.14m at approximately 1.2m depth. The upper fill of the bowl-like feature is noticeably noisy. A strong geological response is evident on the right of Figure 2.8 and possibly represents a flint seam.
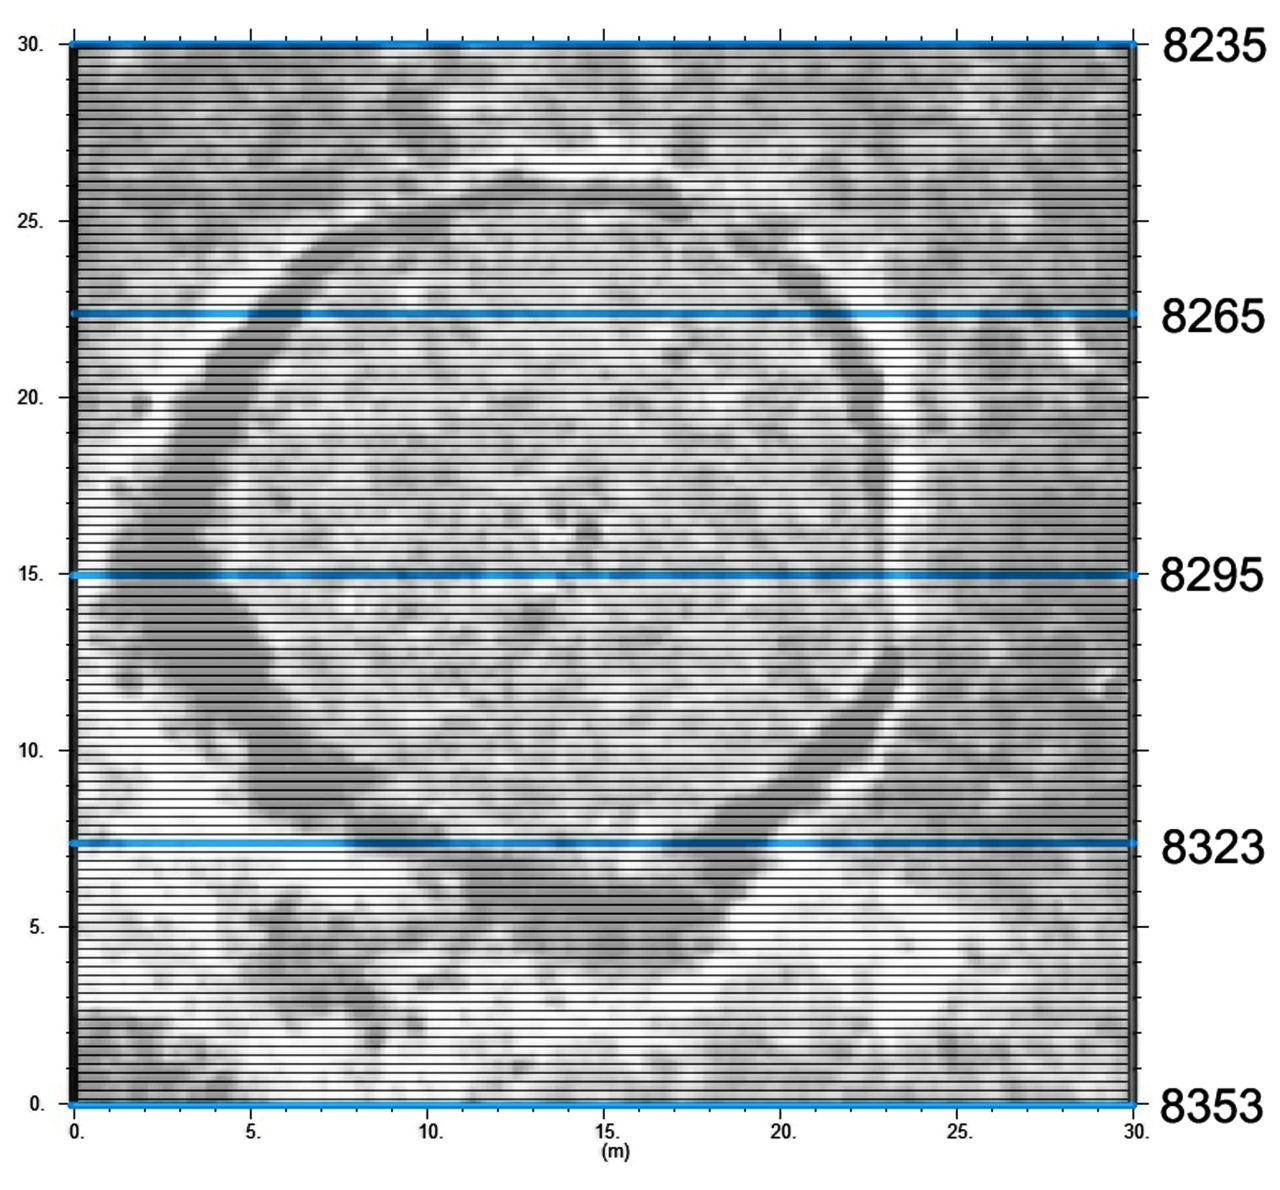
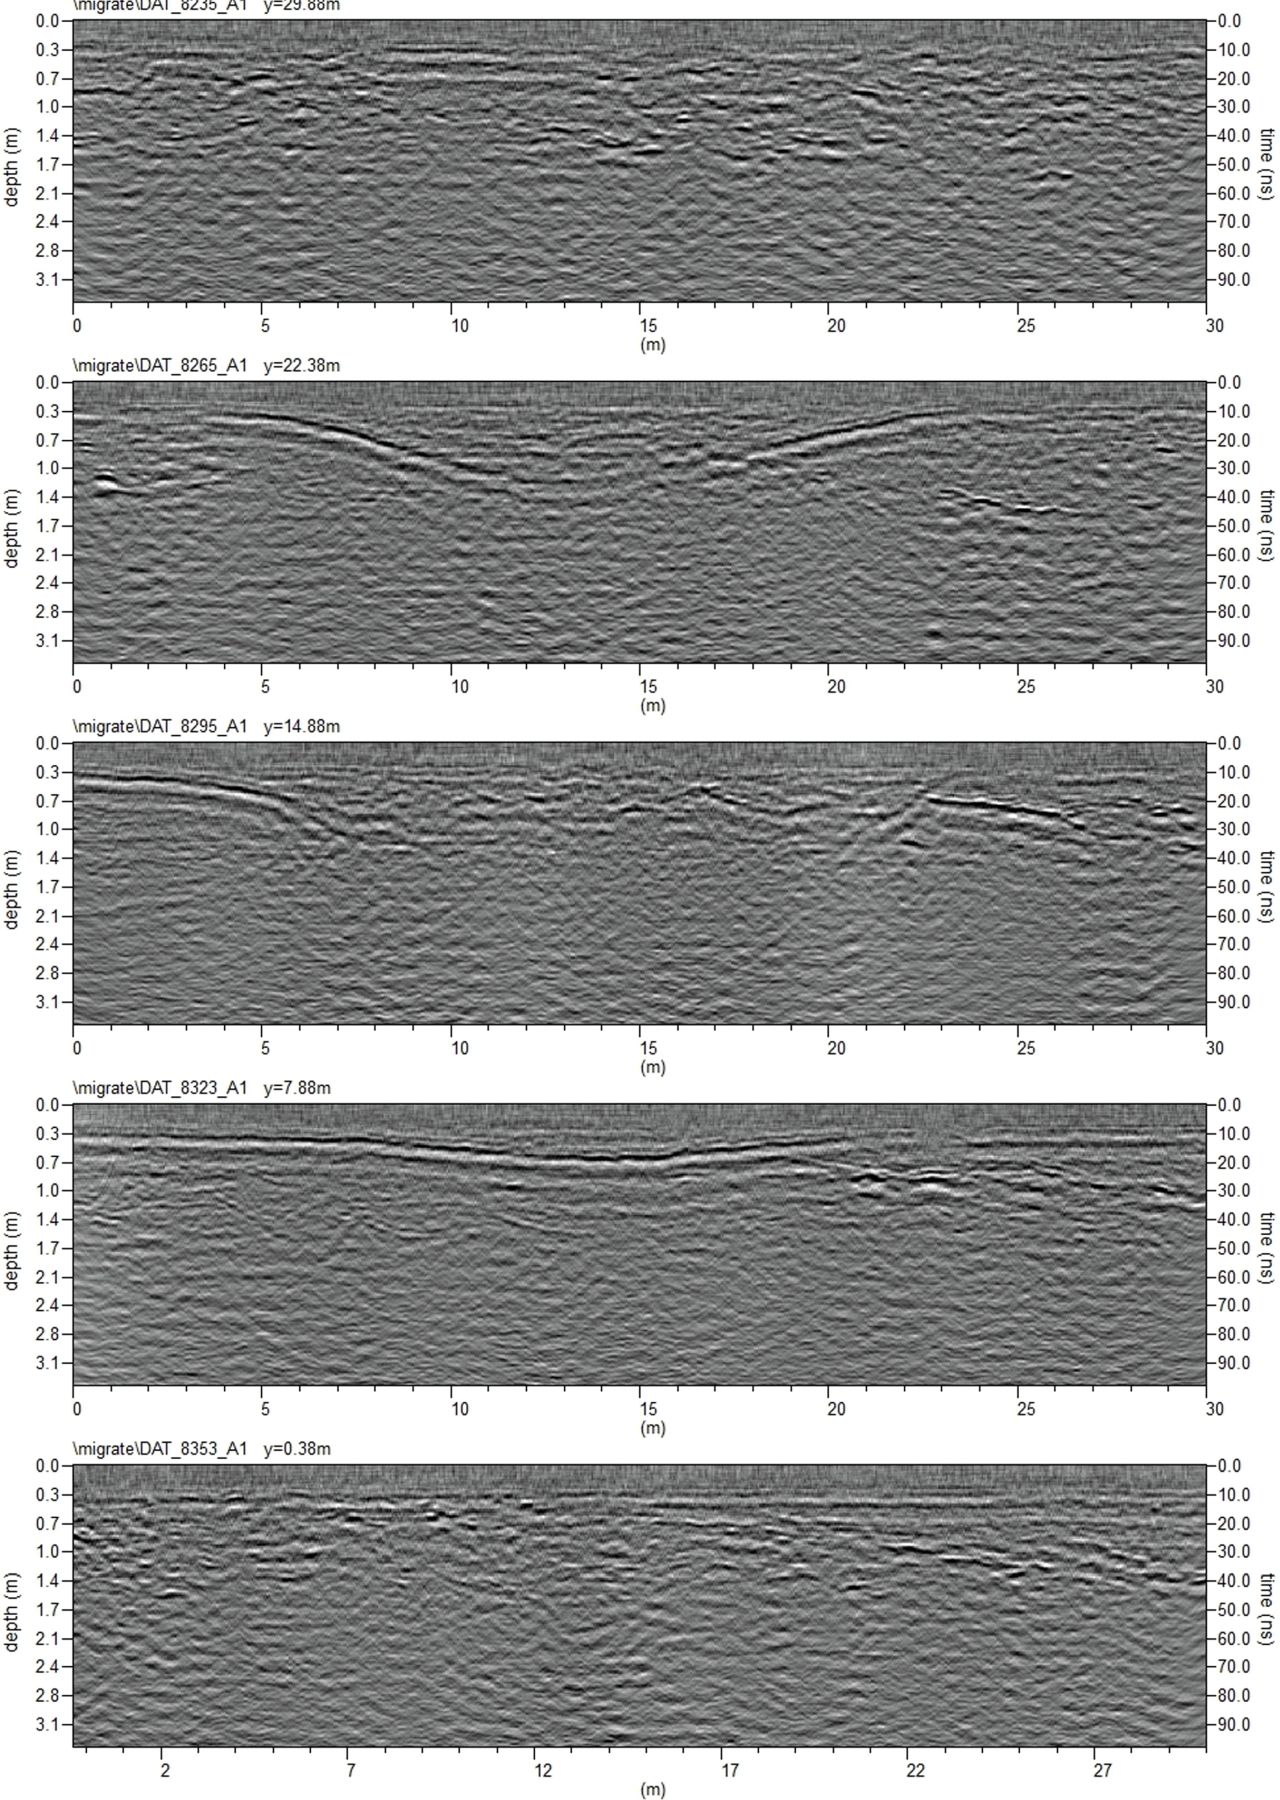
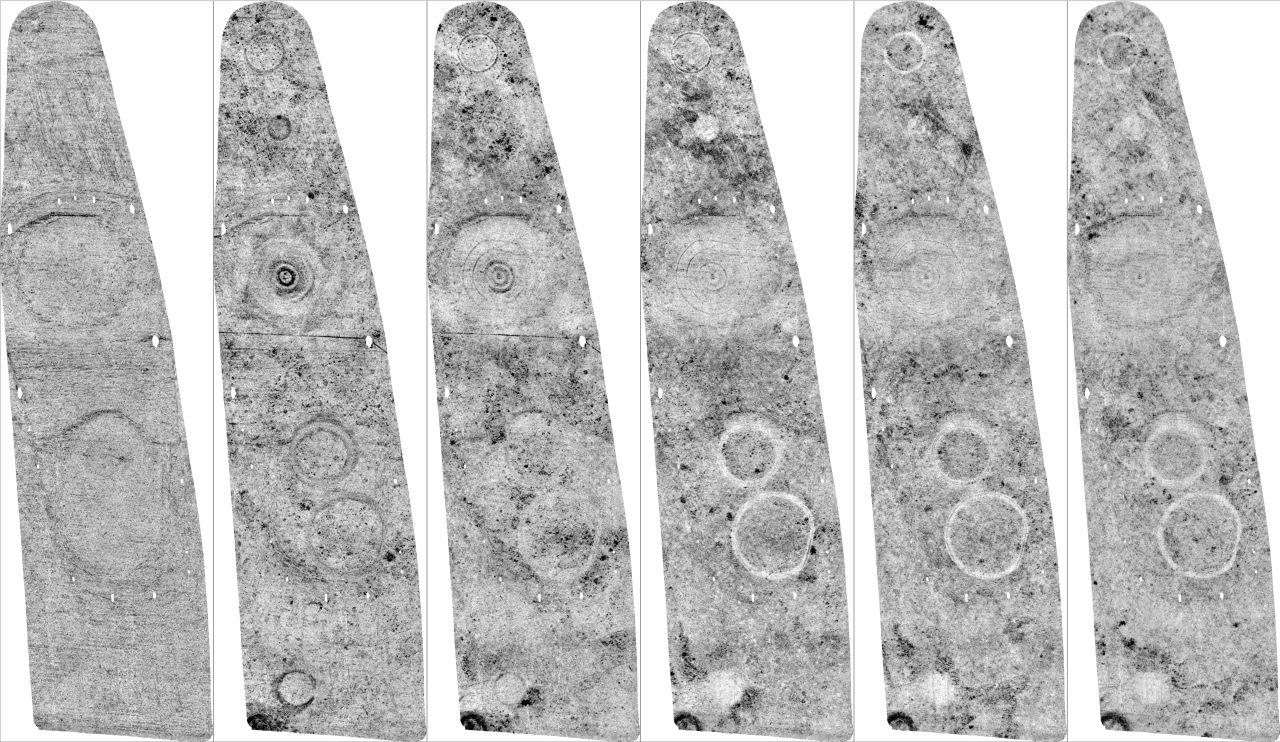
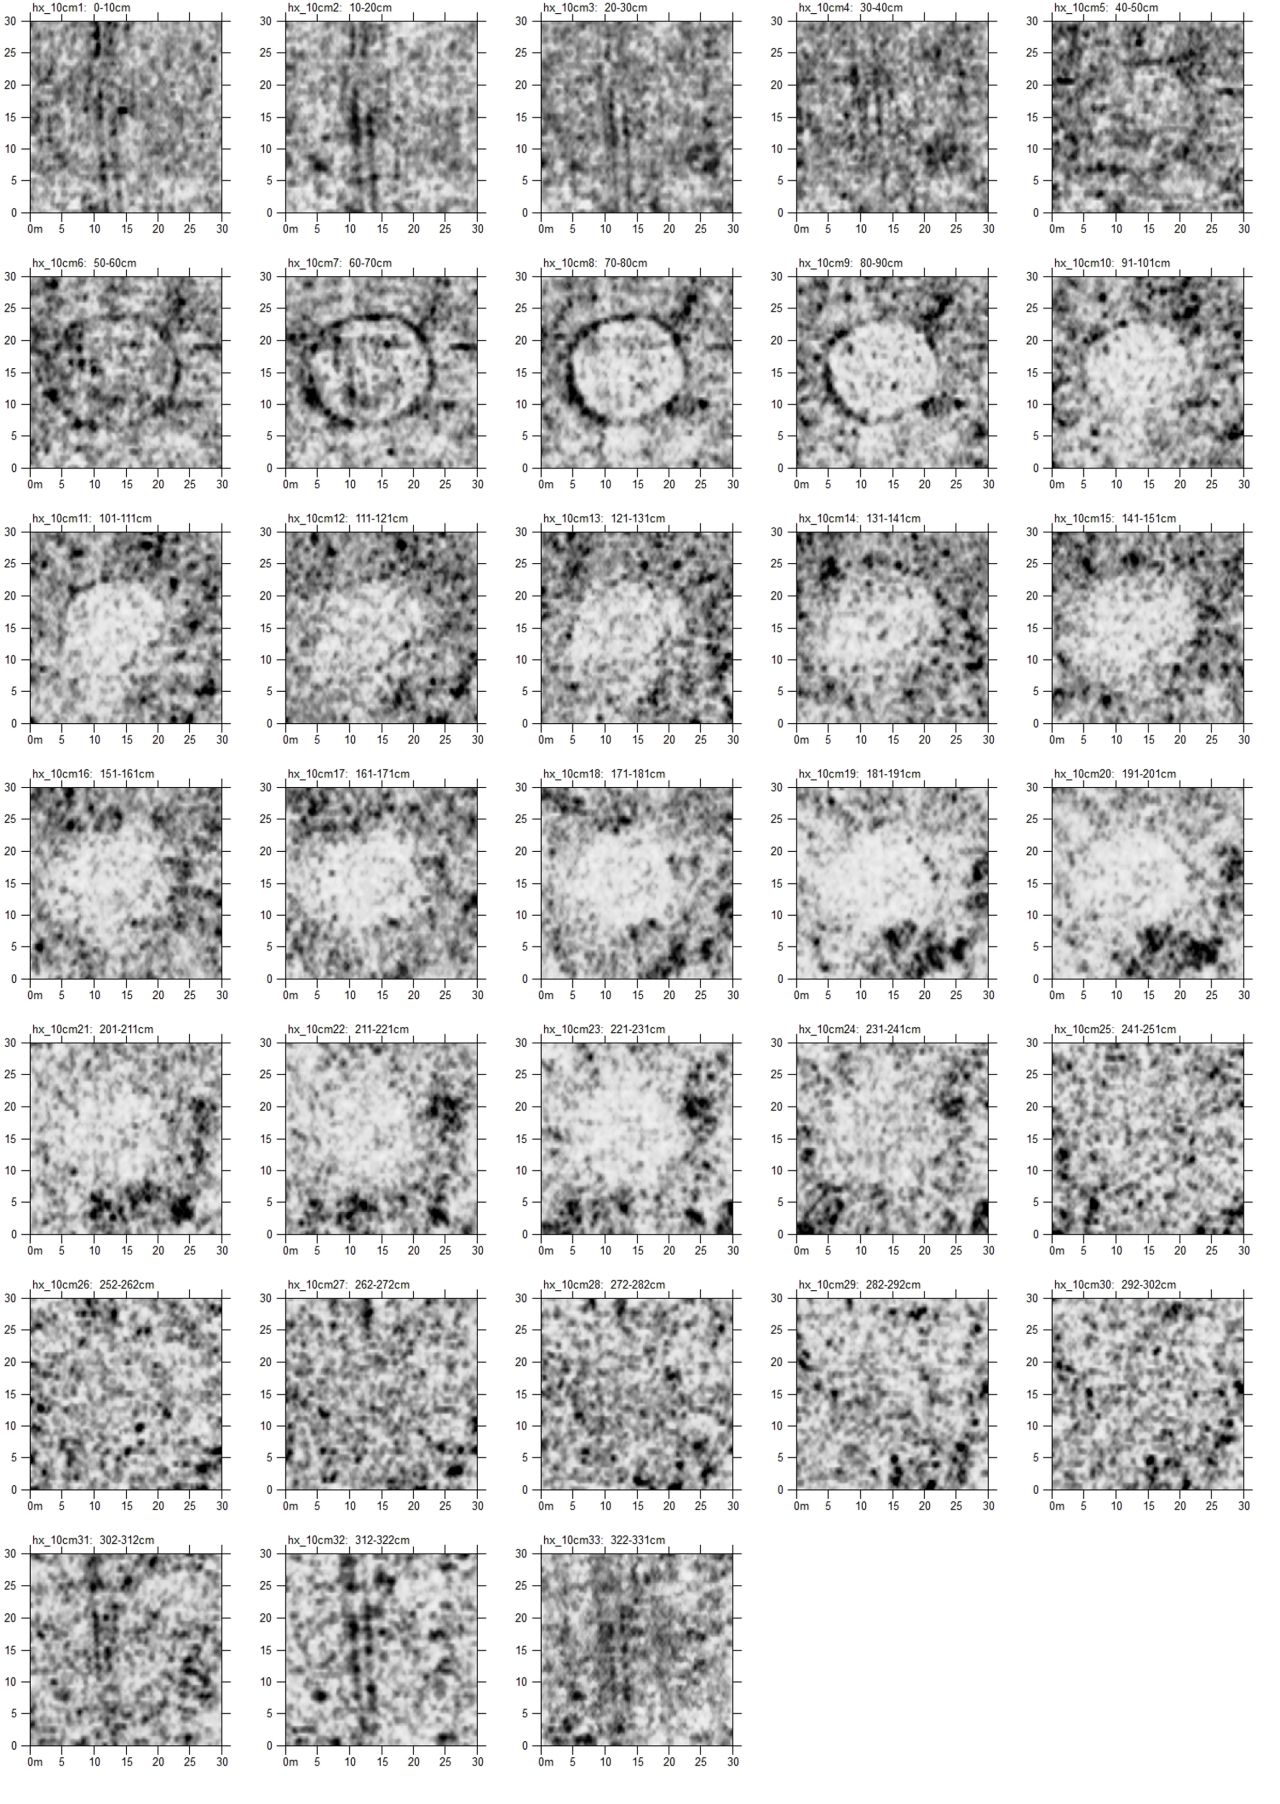
Time slices at 10cm intervals across the whole grid confirm presence of a circular, bowl-like form of the anomaly (Figure 2.9). The width of this feature decreases steadily with depth until c.1.3m, where the signal from the feature is lost. Contrast between bands of high amplitude responses, particularly in the north and north-west of the grid, and a more homogenised central area, suggest the feature may continue beyond this depth.
The approximate dimensions of Anomaly 7A based on the GPR 250MHz data, are summarised in Table 2.4.
| Anomaly 7A | 250MHZ Antenna | ||||||
|---|---|---|---|---|---|---|---|
| Time-Slice | Raw | Processed | |||||
| Depth (cm) | l (m) | b (m) | (m²) | l (m) | b (m) | (m²) | Comment |
| 30-40 | 26 | 23 | 470 | outer extremity | |||
| 40-50 | 20 | 20 | 314 | 22 | 19 | 328 | inner edge |
| 50-60 | 19 | 19 | 284 | 17.5 | 17.5 | 241 | inner edge |
| 60-70 | 17 | 17 | 227 | 16 | 16 | 201 | inner edge |
| 70-80 | 16 | 17 | 214 | 15 | 15 | 177 | inner edge |
| 80-90 | 15 | 15 | 177 | 15 | 15 | 177 | inner edge |
| 90-100 | 15 | 15 | 177 | 14.5 | 14.5 | 165 | inner edge |
| 100-110 | 15 | 15 | 177 | 14 | 14 | 154 | inner edge |
| 110-120 | 15 | 14 | 165 | 14 | 14 | 154 | inner edge |
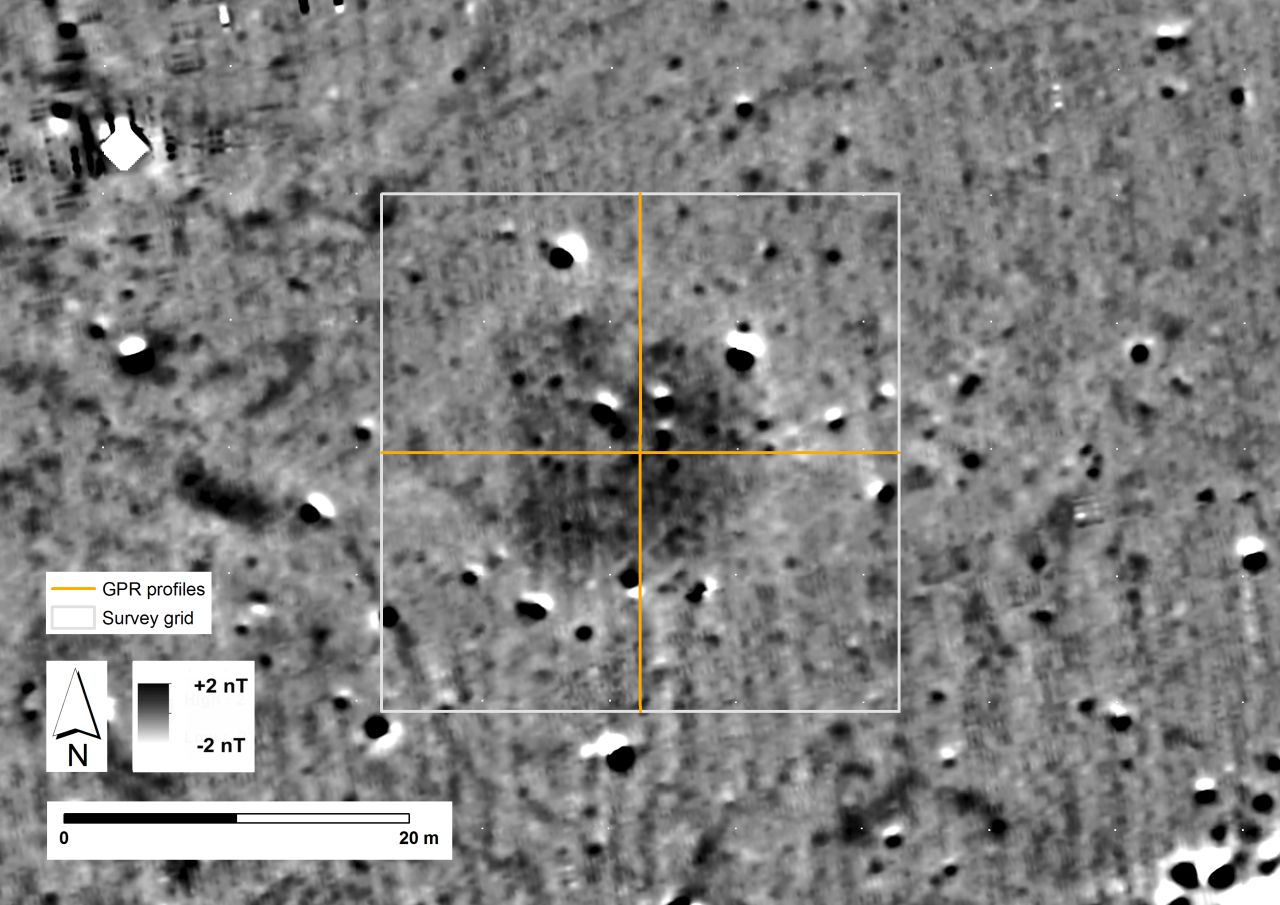
Feature 8A was surveyed with a 250MHz and 500MHz antenna at 0.5m intervals in W–E direction within a 30m x 30m grid. Survey markers assisted navigation along transects. The area is normally under crop and had been recently drilled. Survey was undertaken during a protracted period of unusually dry weather. Ground conditions were extremely dry.
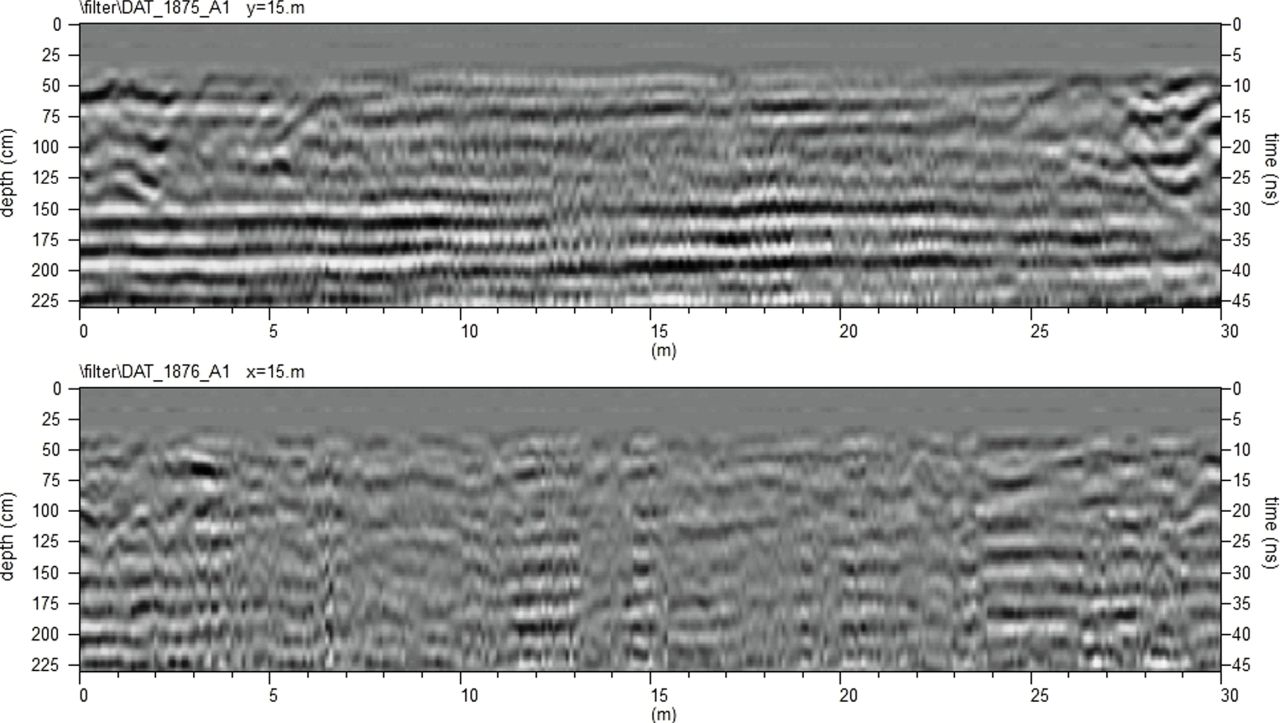
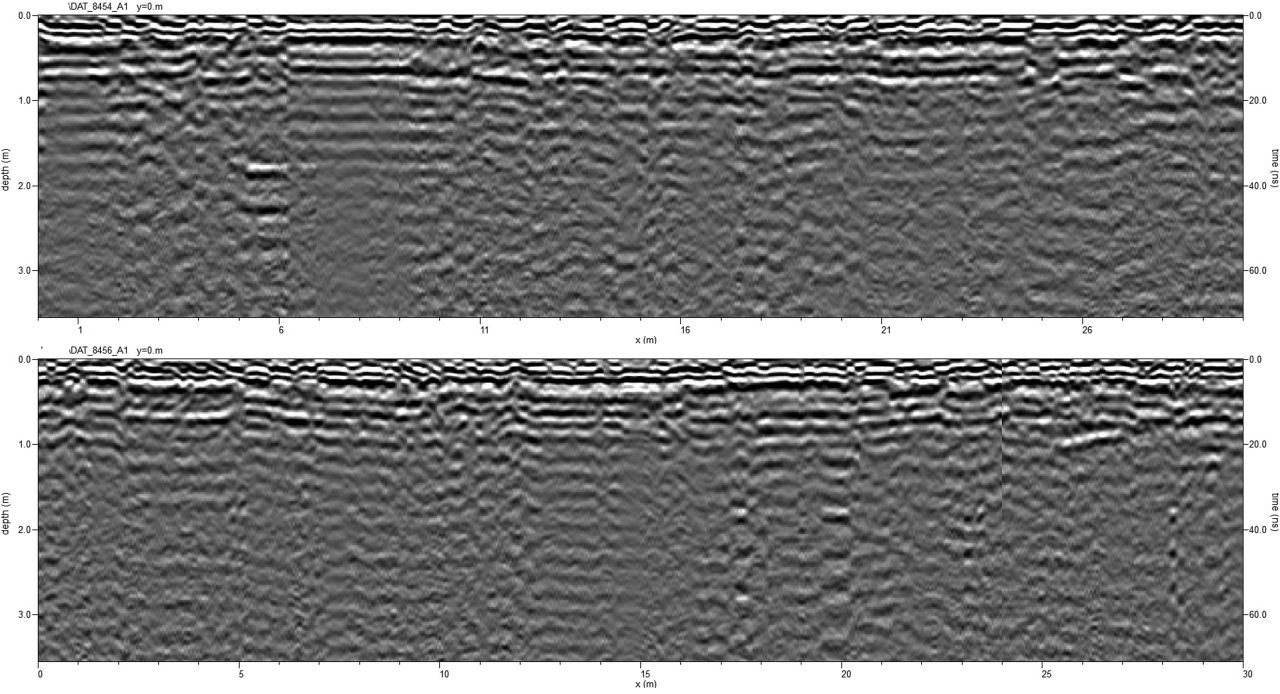
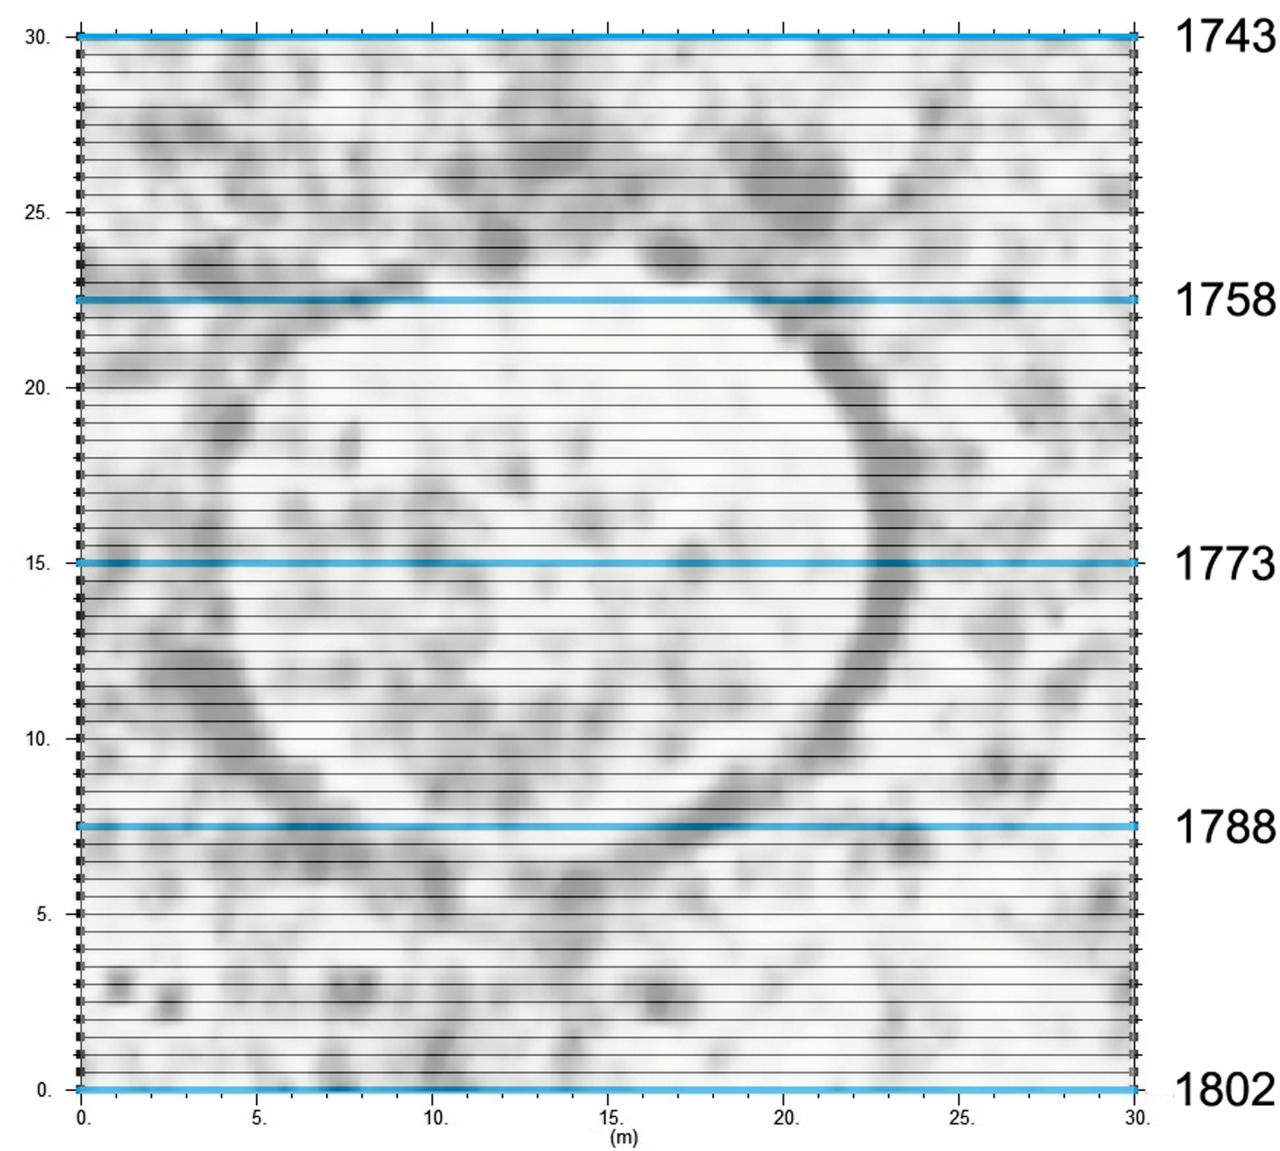
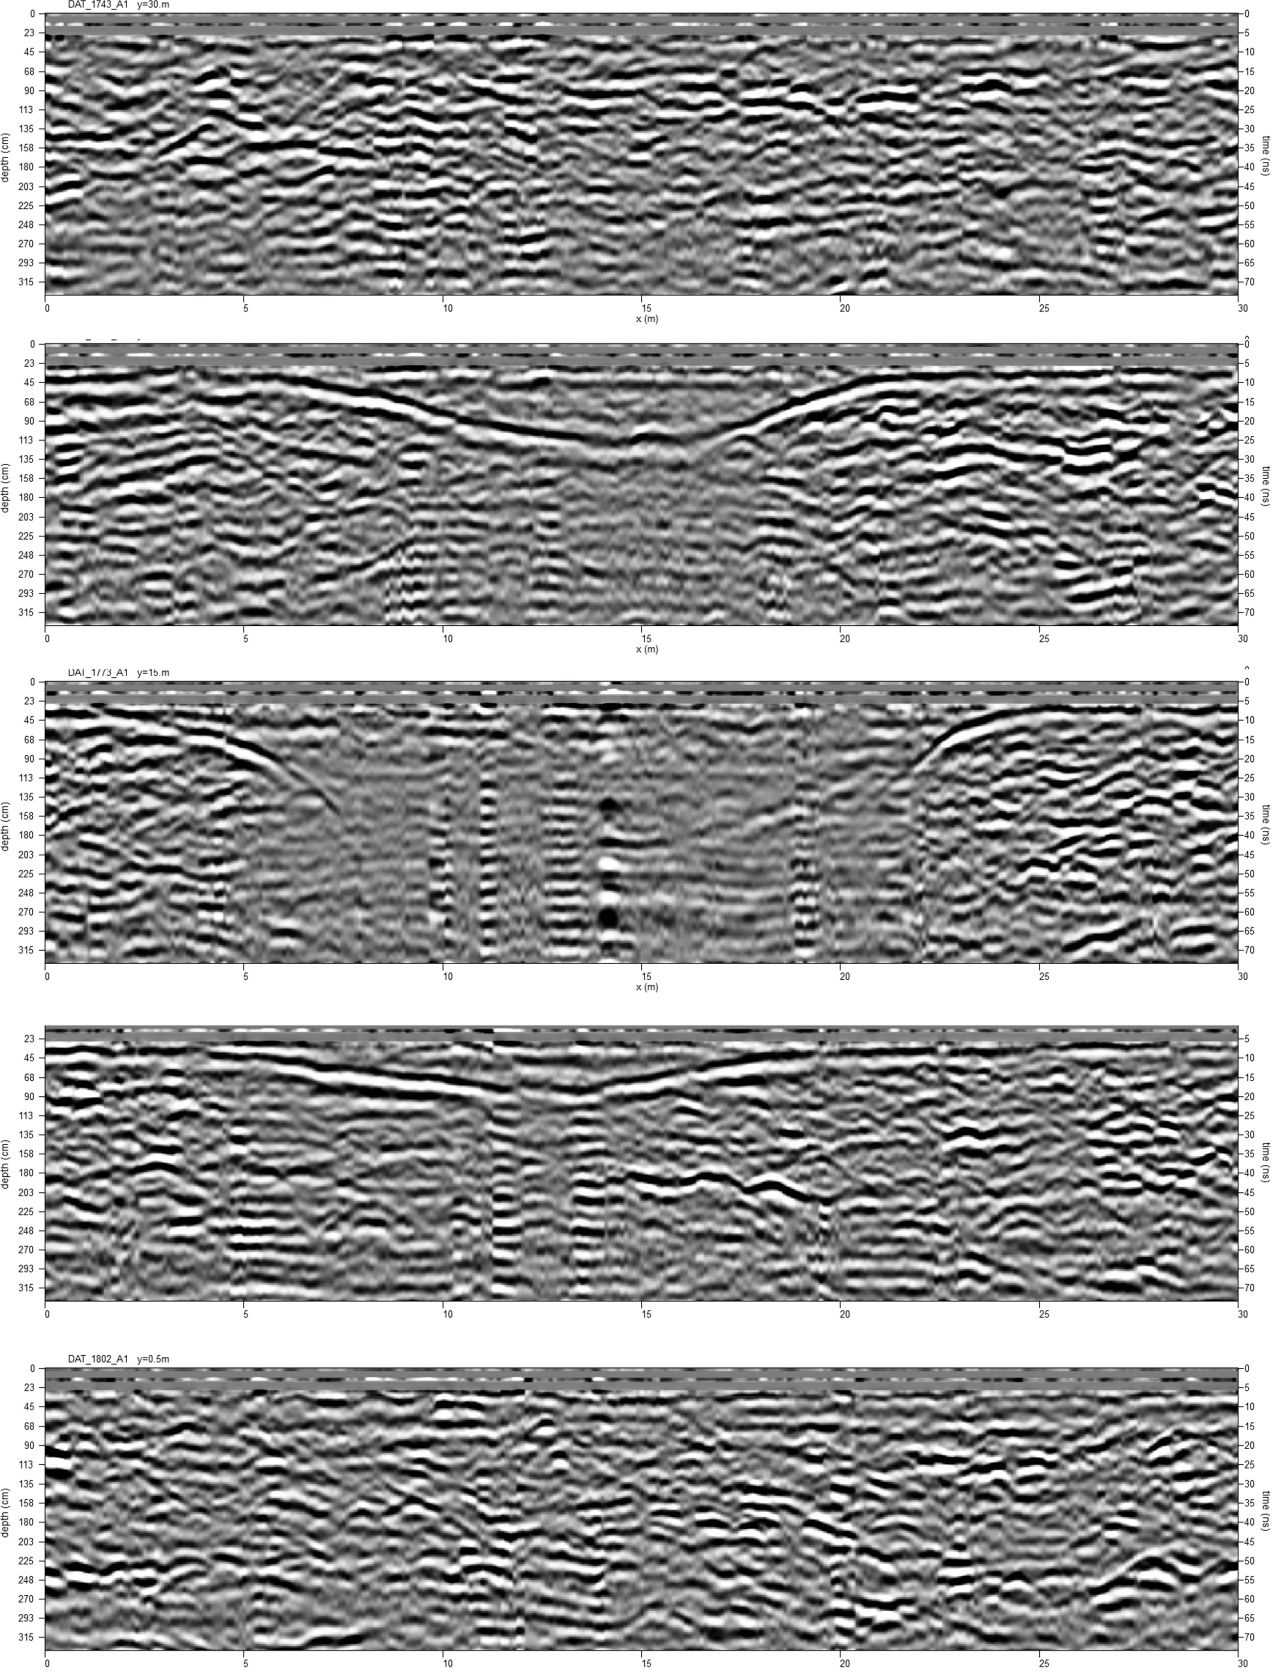
Velocity was set to 0.09m/ns as calculated from hyperbola testing. The central radargram, 1773, clearly reveals a c.20m long feature within the chalk bedrock at a depth of c.30cm. The feature decreases in diameter steadily to a depth of c.2.00m (Table 2.5 and Figure 2.11). The high amplitude chalk response is evident beyond the feature, with a homogenised response in the centre identified to a depth of c.3.3m (Figure 2.11). The 'ringing' in the centre of the image is a result of bounce over the surface, which resulted from collecting data at, approximately, right angles to the modern ploughing. Radargrams 1743 and 1802 show a strong response from the underlying chalk background.
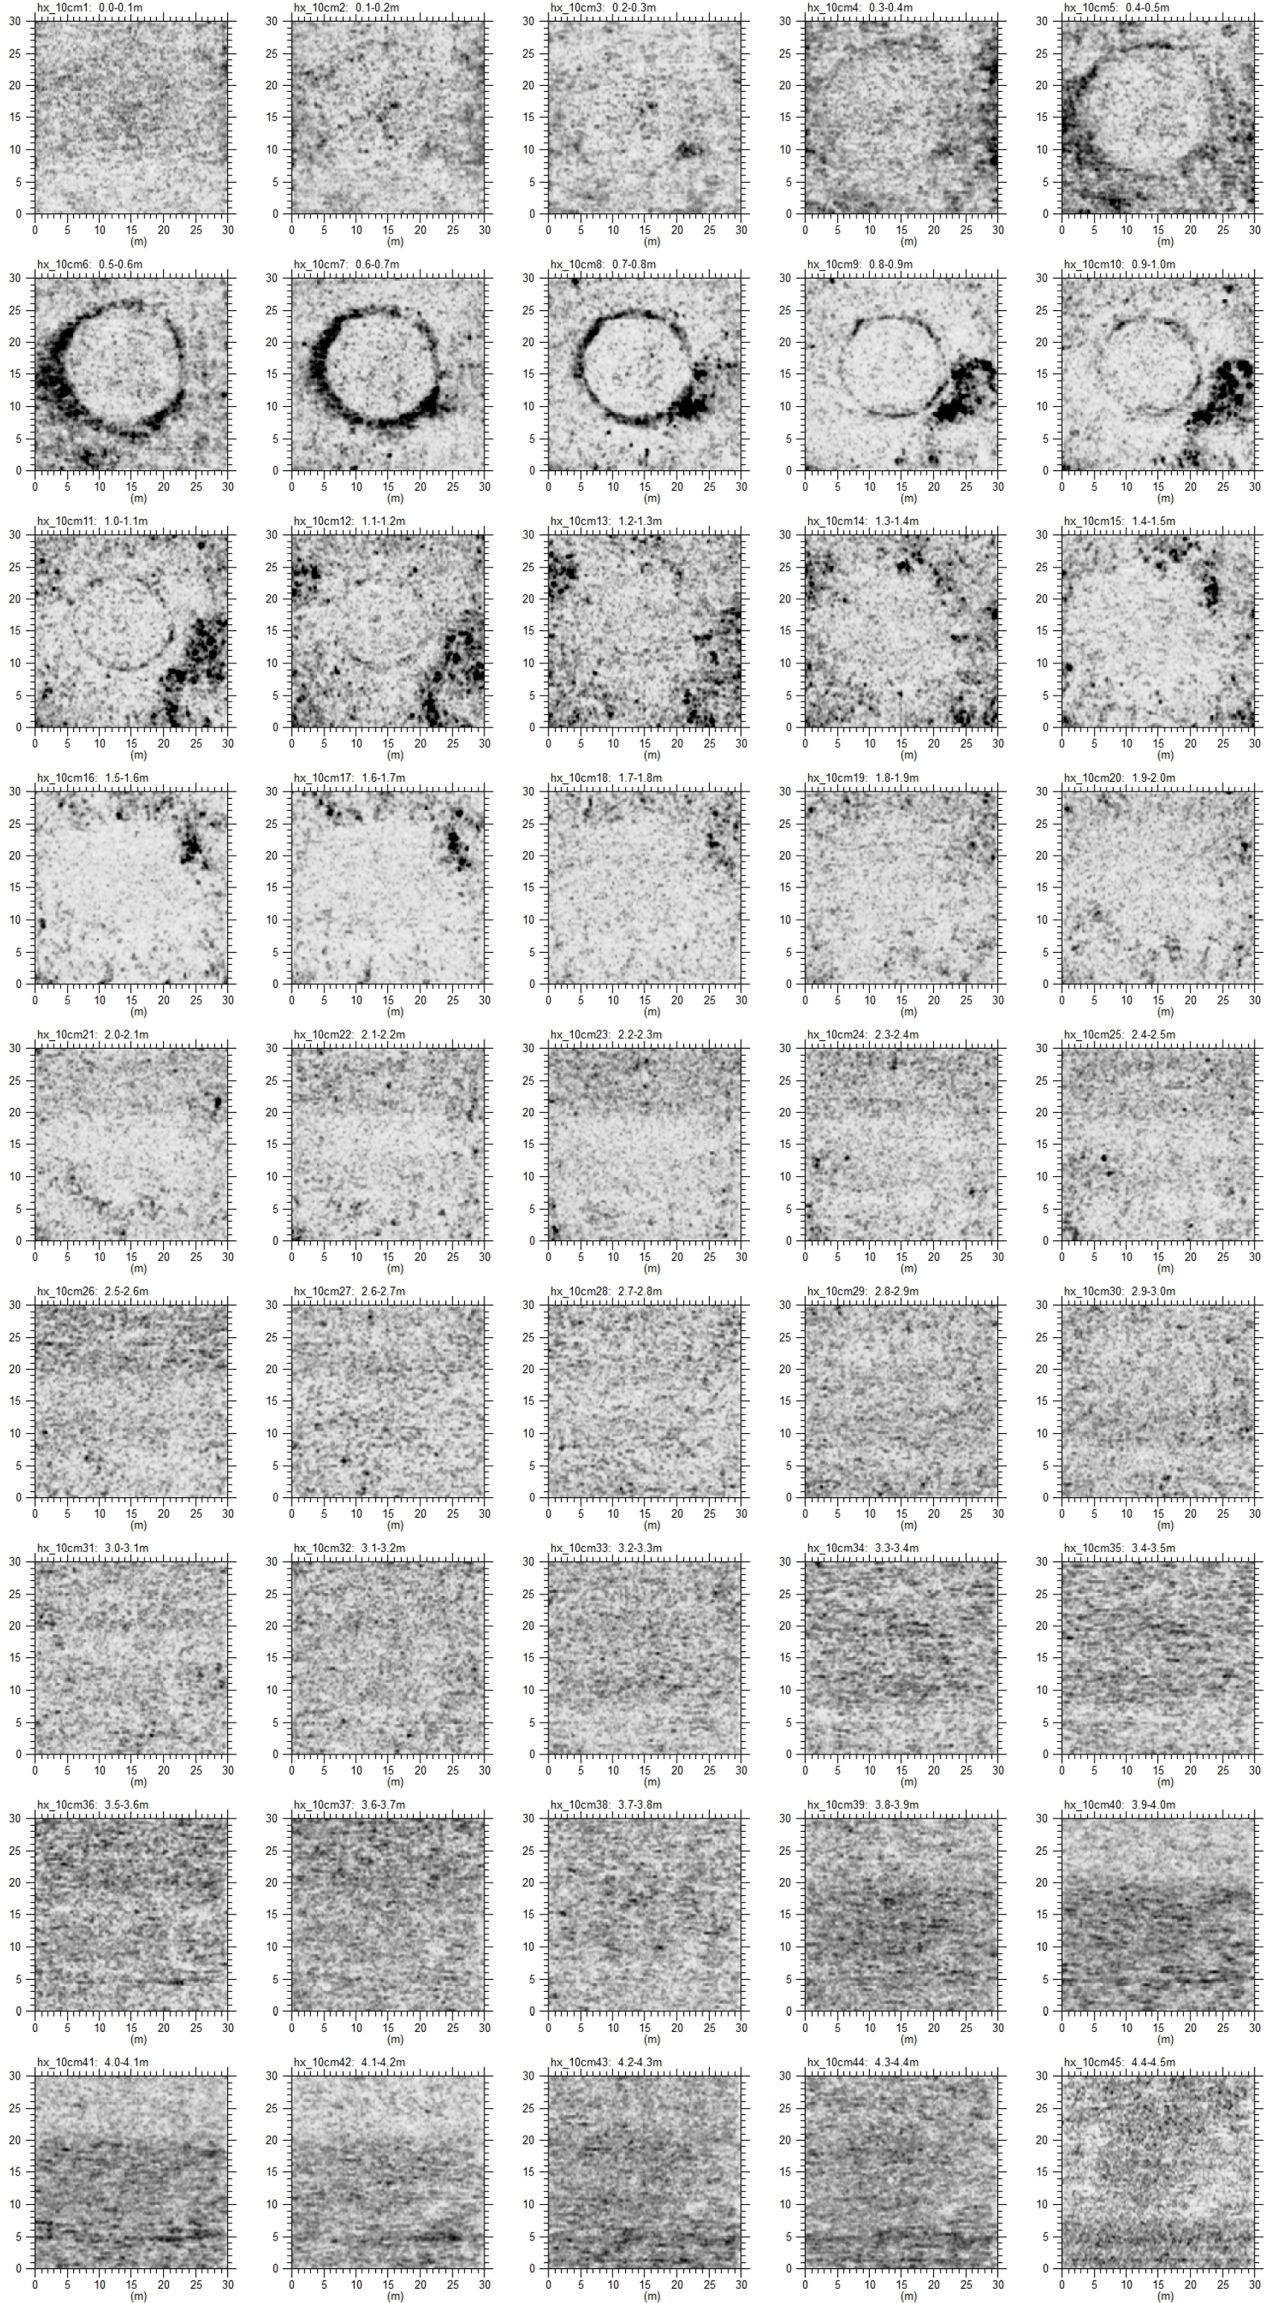
Time slices at 10cm intervals demonstrate the circular form of the anomaly which decreases steadily in diameter until c.1.3m, after which the data indicate a consistent vertical edge to c.3m (Figure 2.12). The approximate dimensions of anomaly 8A, based on the GPR 250MHz data, are summarised in Table 2.5. The cut of the modern water pipe is evident in the upper slices (40–90cm) with the surface features continuing to show throughout. This results from de-coupling as the antenna bounces.
| Anomaly 8A | 250MHz Antenna | ||||||
|---|---|---|---|---|---|---|---|
| Time-Slice | Raw | Processed | |||||
| Depth (cm) | l (m) | b (m) | (m²) | l (m) | b (m) | (m²) | Comment |
| 30-40 | 23 | 20 | 361 | outer extremity | |||
| 40-50 | 20 | 18 | 283 | 20 | 17 | 267 | inner edge |
| 90-100 | 16 | 15 | 188 | 17 | 15 | 200 | inner edge |
| 140-150 | 18 | 17 | 240 | 19 | 17 | 254 | inner edge |
| 190-200 | 17.5 | 17.5 | 241 | 17 | 16 | 214 | inner edge |
| 240-250 | 17 | 18 | 240 | 17 | 17 | 227 | inner edge |
| 290-300 | 18 | 18 | 254 | inner edge | |||
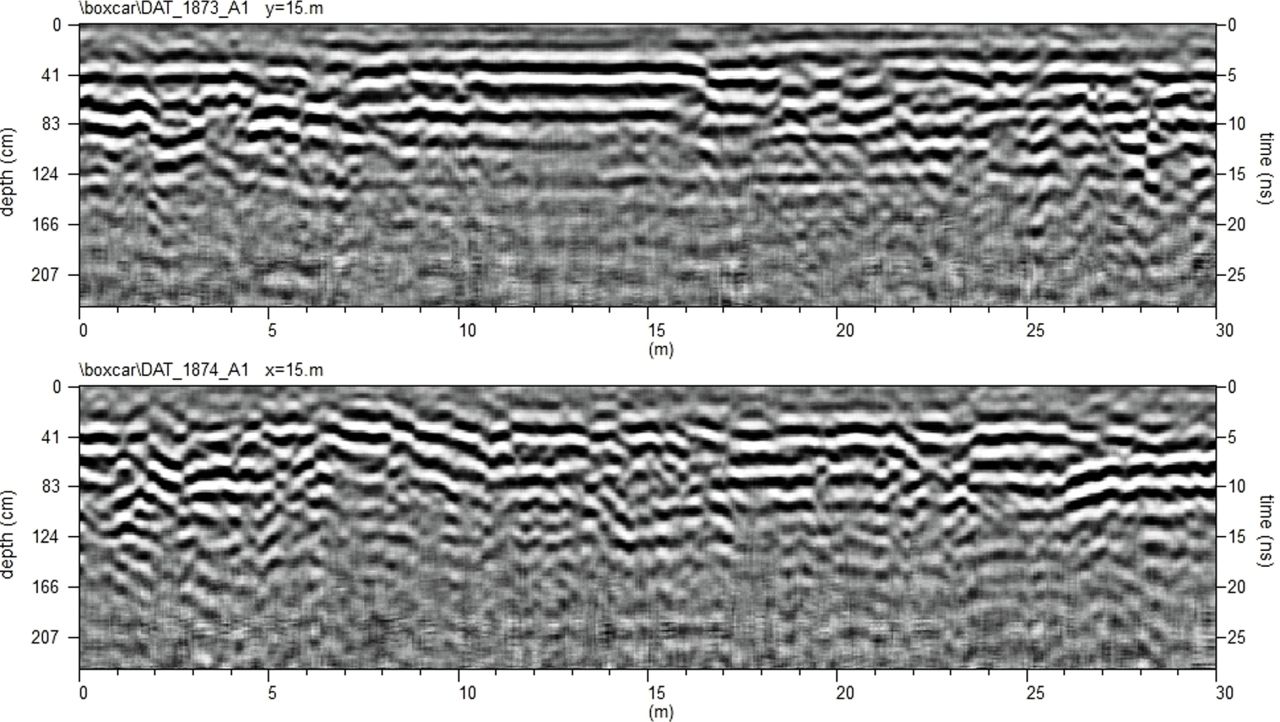
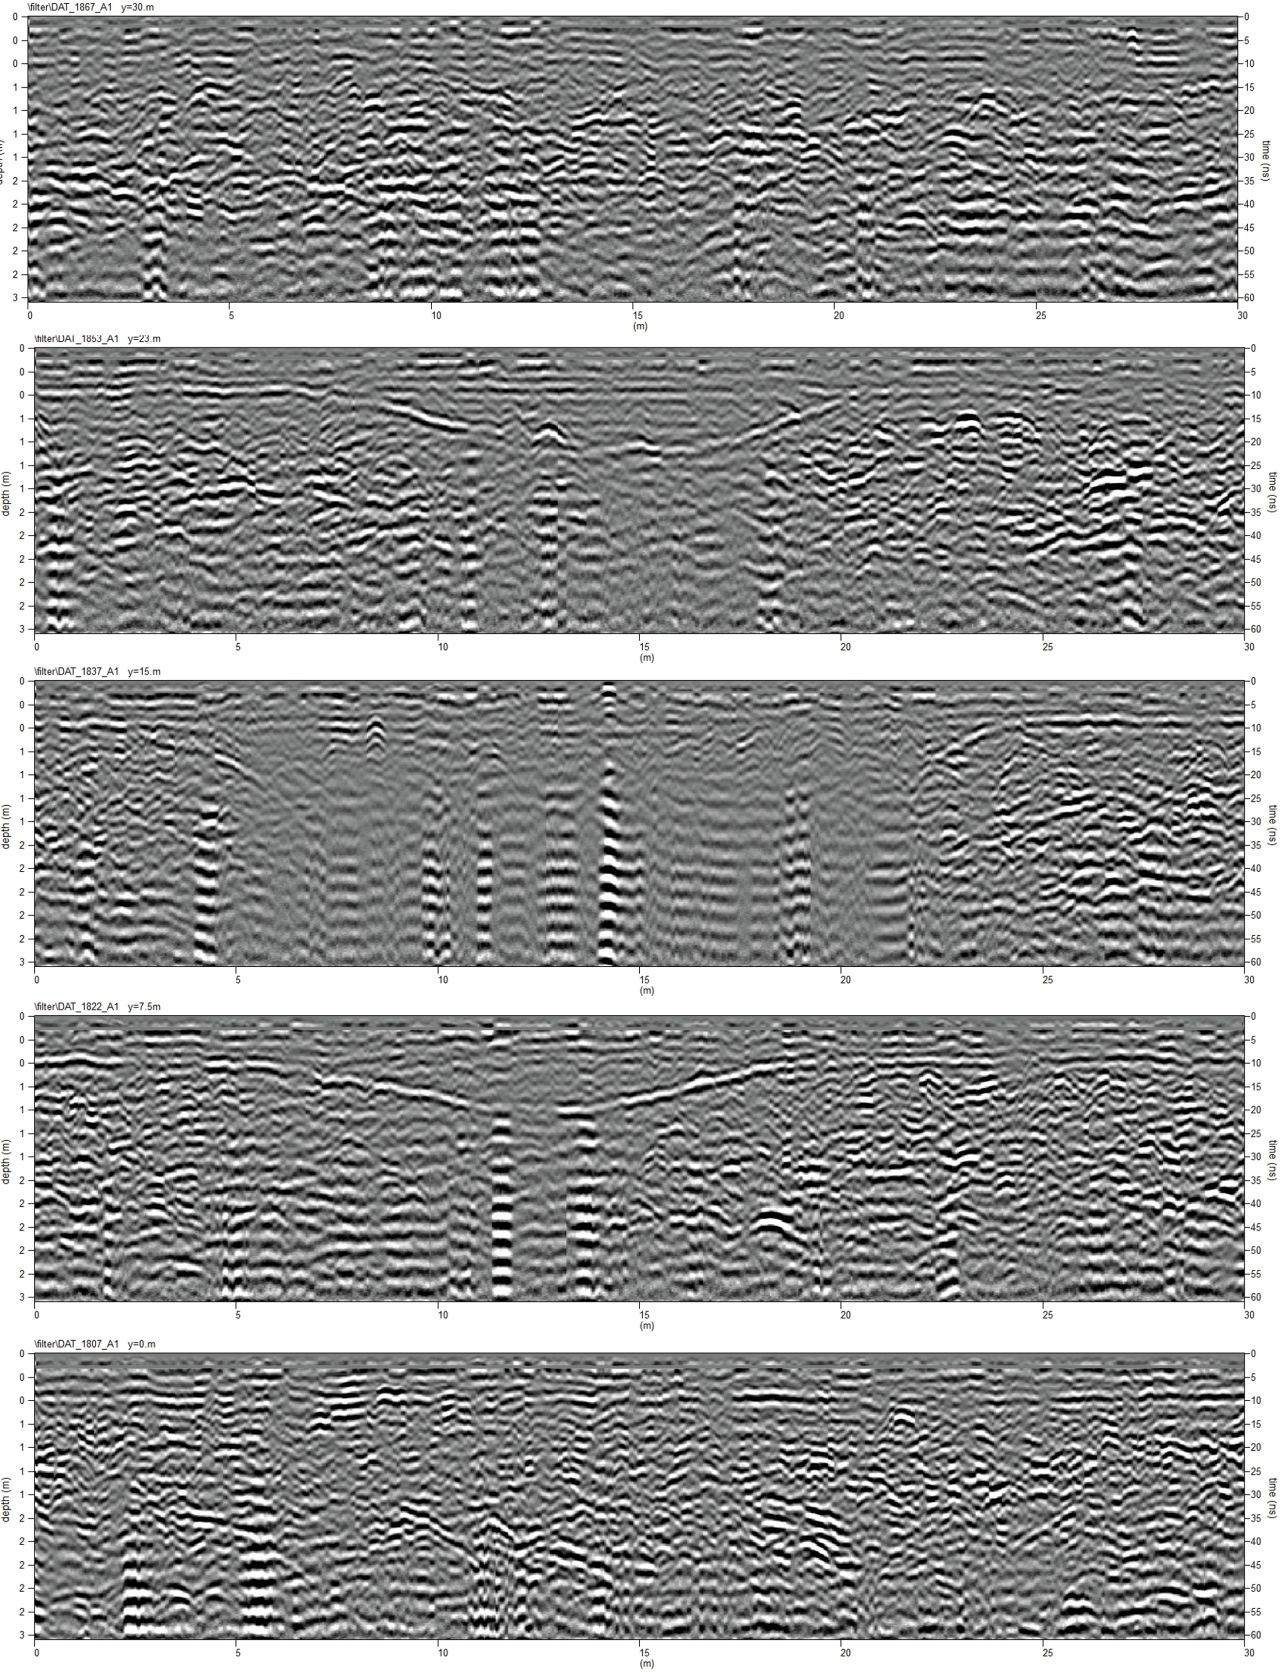
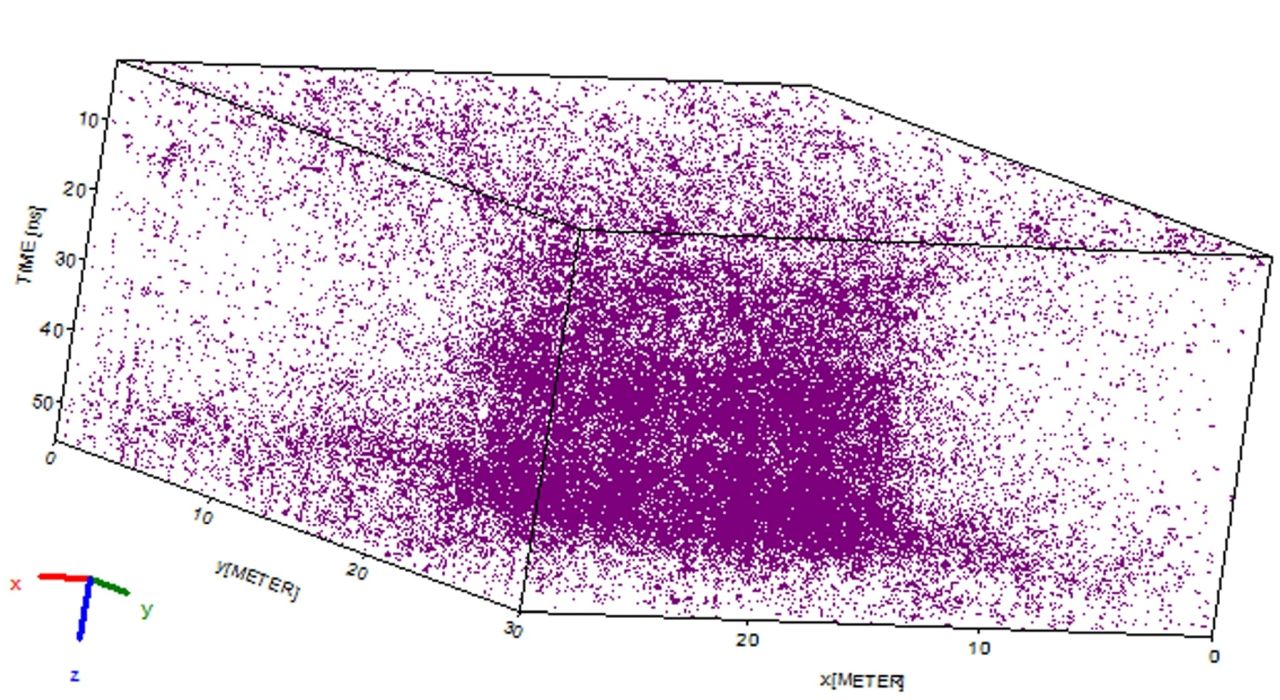
Velocity was set to 0.09m/ns as calculated from hyperbola testing. The central radargram 1837 reveals a feature c.20m diameter within the chalk bedrock at a depth of c.30cm. This decreases in diameter before disappearing at approximately 1.6m depth. The high amplitude chalk response is evident at the sides of the feature, with a homogeneous response in the centre. This continues vertically until at least 2.75m. Vertical ringing is due to bounce. Radargrams 1867 and 1807, which are outside the feature, display a strong chalk response throughout.
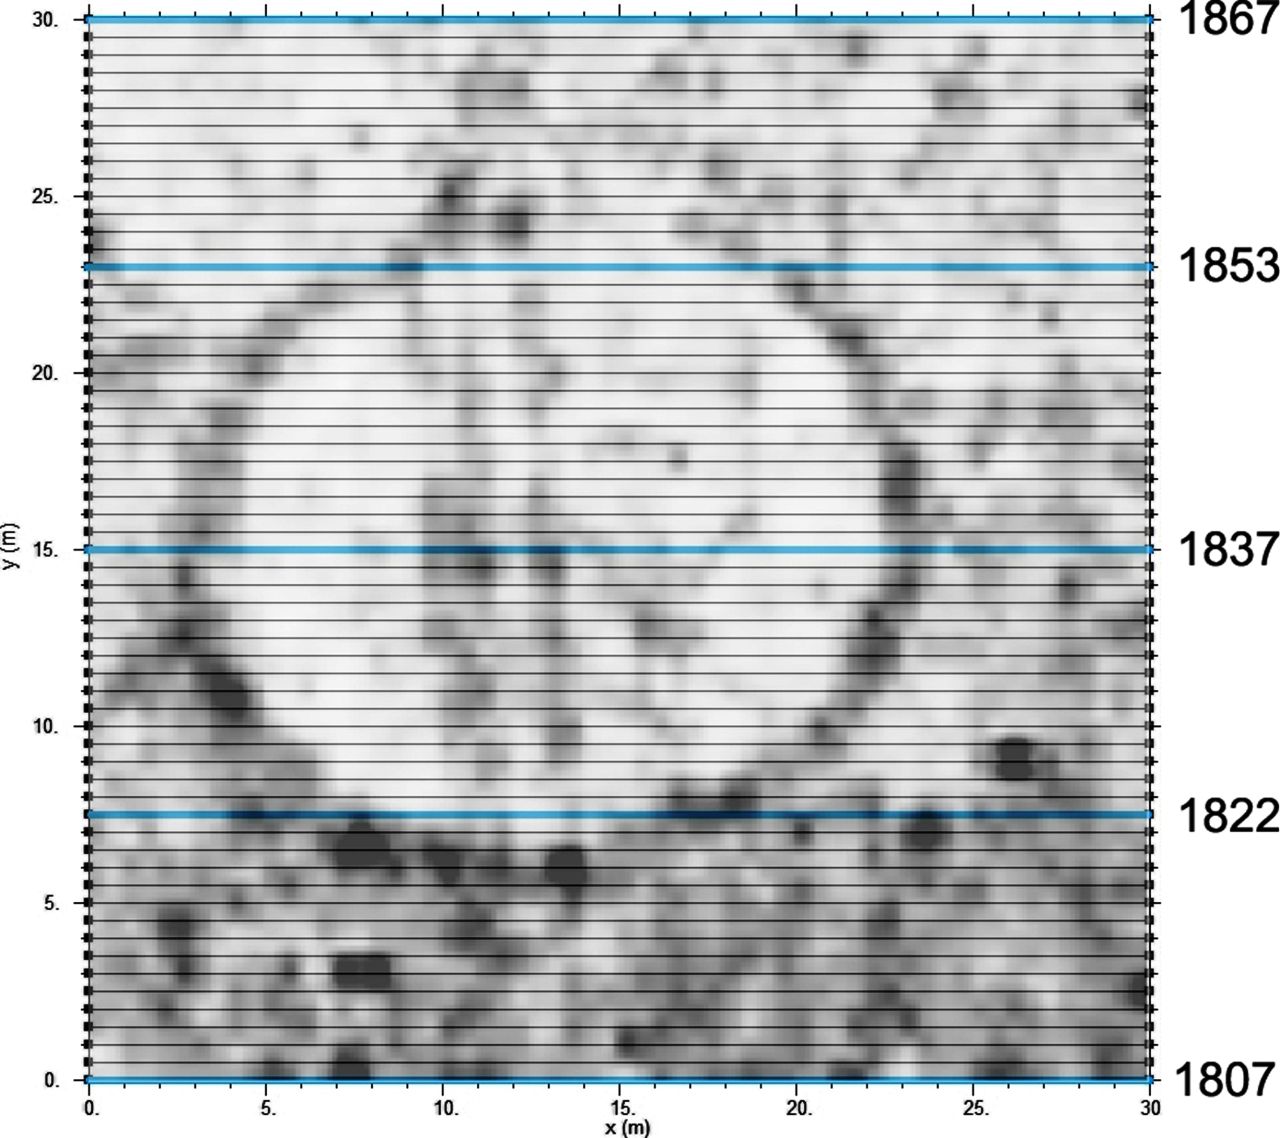
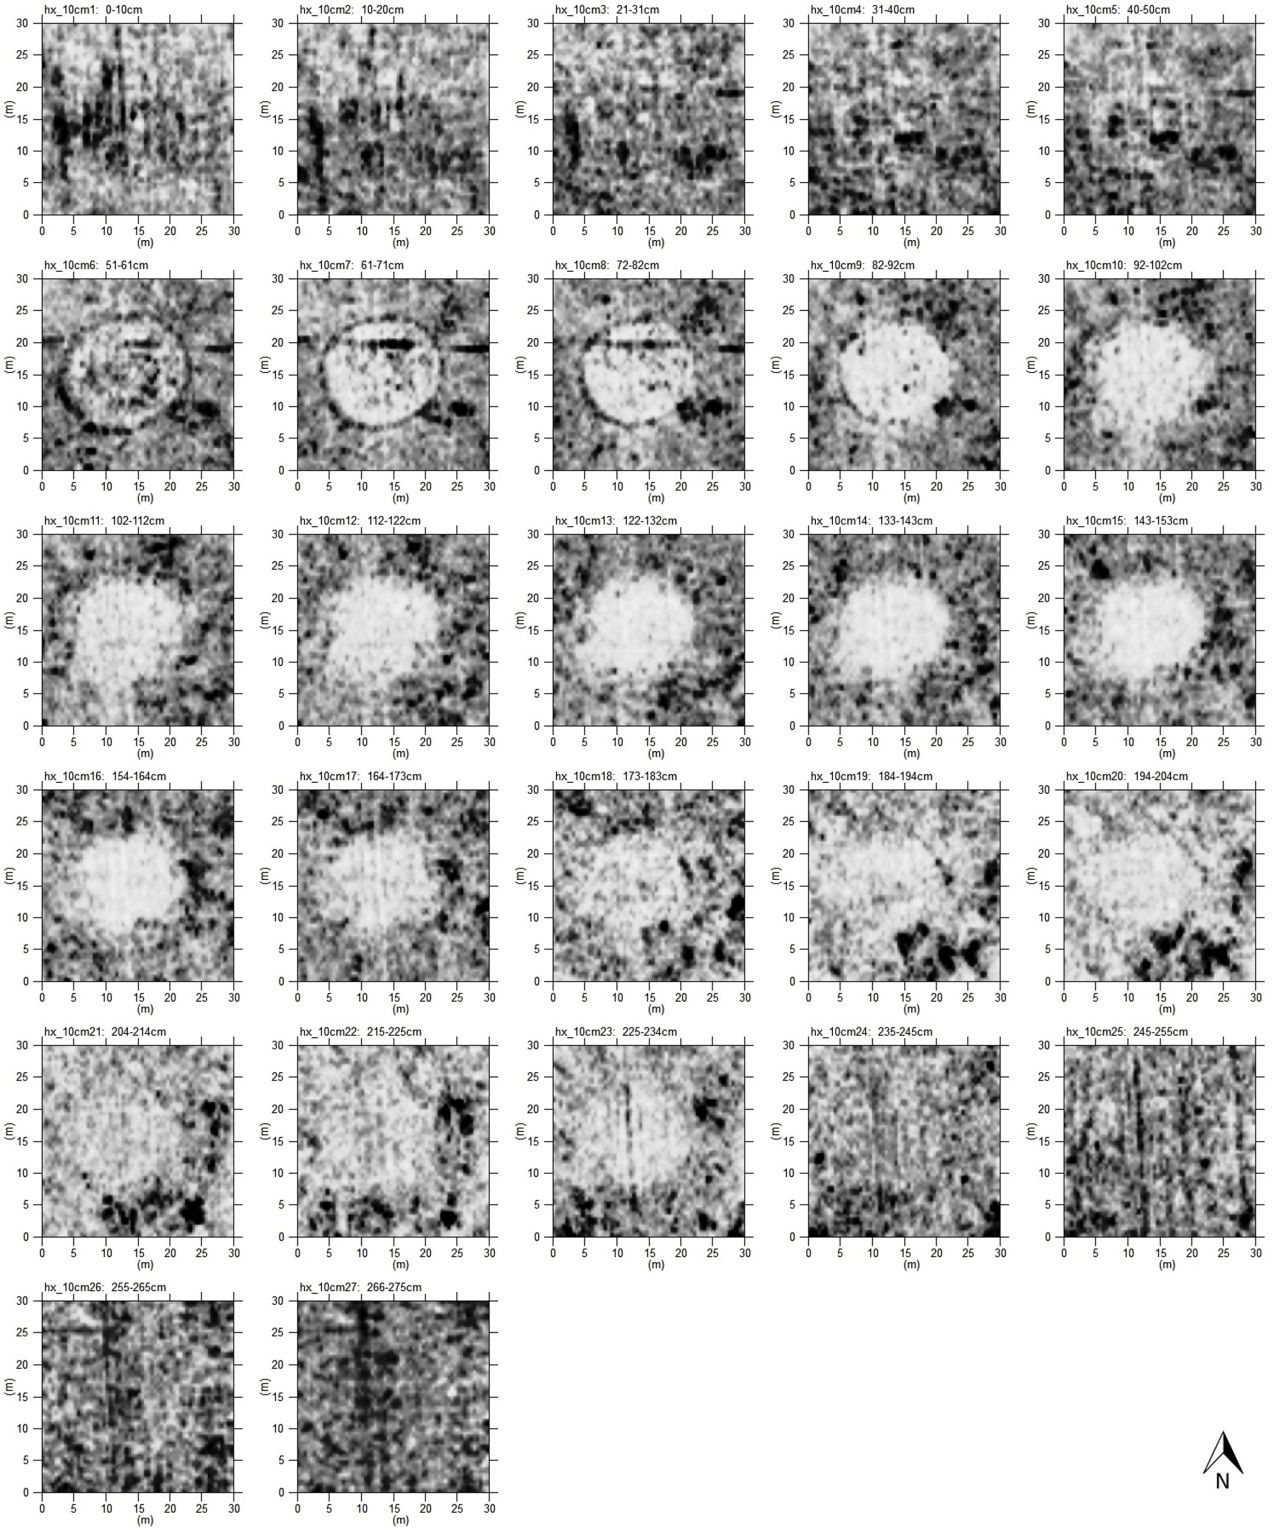
Time slices at 10cm intervals demonstrate the elliptical, bowl-like form of the anomaly (Figure 2.15). This decreases in diameter with depth until c.80cm. After this the feature maintains a consistently vertical profile to at least c.2.45m. The cut of the modern water pipe is evident in the upper slices (40–90cm) and surface features continue to show throughout as a consequence of de-coupling as the antenna bounces.
Internet Archaeology is an open access journal based in the Department of Archaeology, University of York. Except where otherwise noted, content from this work may be used under the terms of the Creative Commons Attribution 3.0 (CC BY) Unported licence, which permits unrestricted use, distribution, and reproduction in any medium, provided that attribution to the author(s), the title of the work, the Internet Archaeology journal and the relevant URL/DOI are given.
Terms and Conditions | Legal Statements | Privacy Policy | Cookies Policy | Citing Internet Archaeology
Internet Archaeology content is preserved for the long term with the Archaeology Data Service (ROR). Help sustain and support open access publication by donating to our Open Access Archaeology Fund.
 Home
Home