Cite this as: Gaffney, V. et al. 2020 A Massive, Late Neolithic Pit Structure associated with Durrington Walls Henge, Internet Archaeology 55. https://doi.org/10.11141/ia.55.4
| CMD Explorer | |
|---|---|
| Sampling | Zigzag lines with 3Hz sampling |
| Locational detail | Differential dGNSS control at 1Hz |
| Coverage | 9.25ha. |
| Instrument | CMD Explorer |
| Configuration | 1.48, 2.82, 4.49m Vertical Dipole coils. |
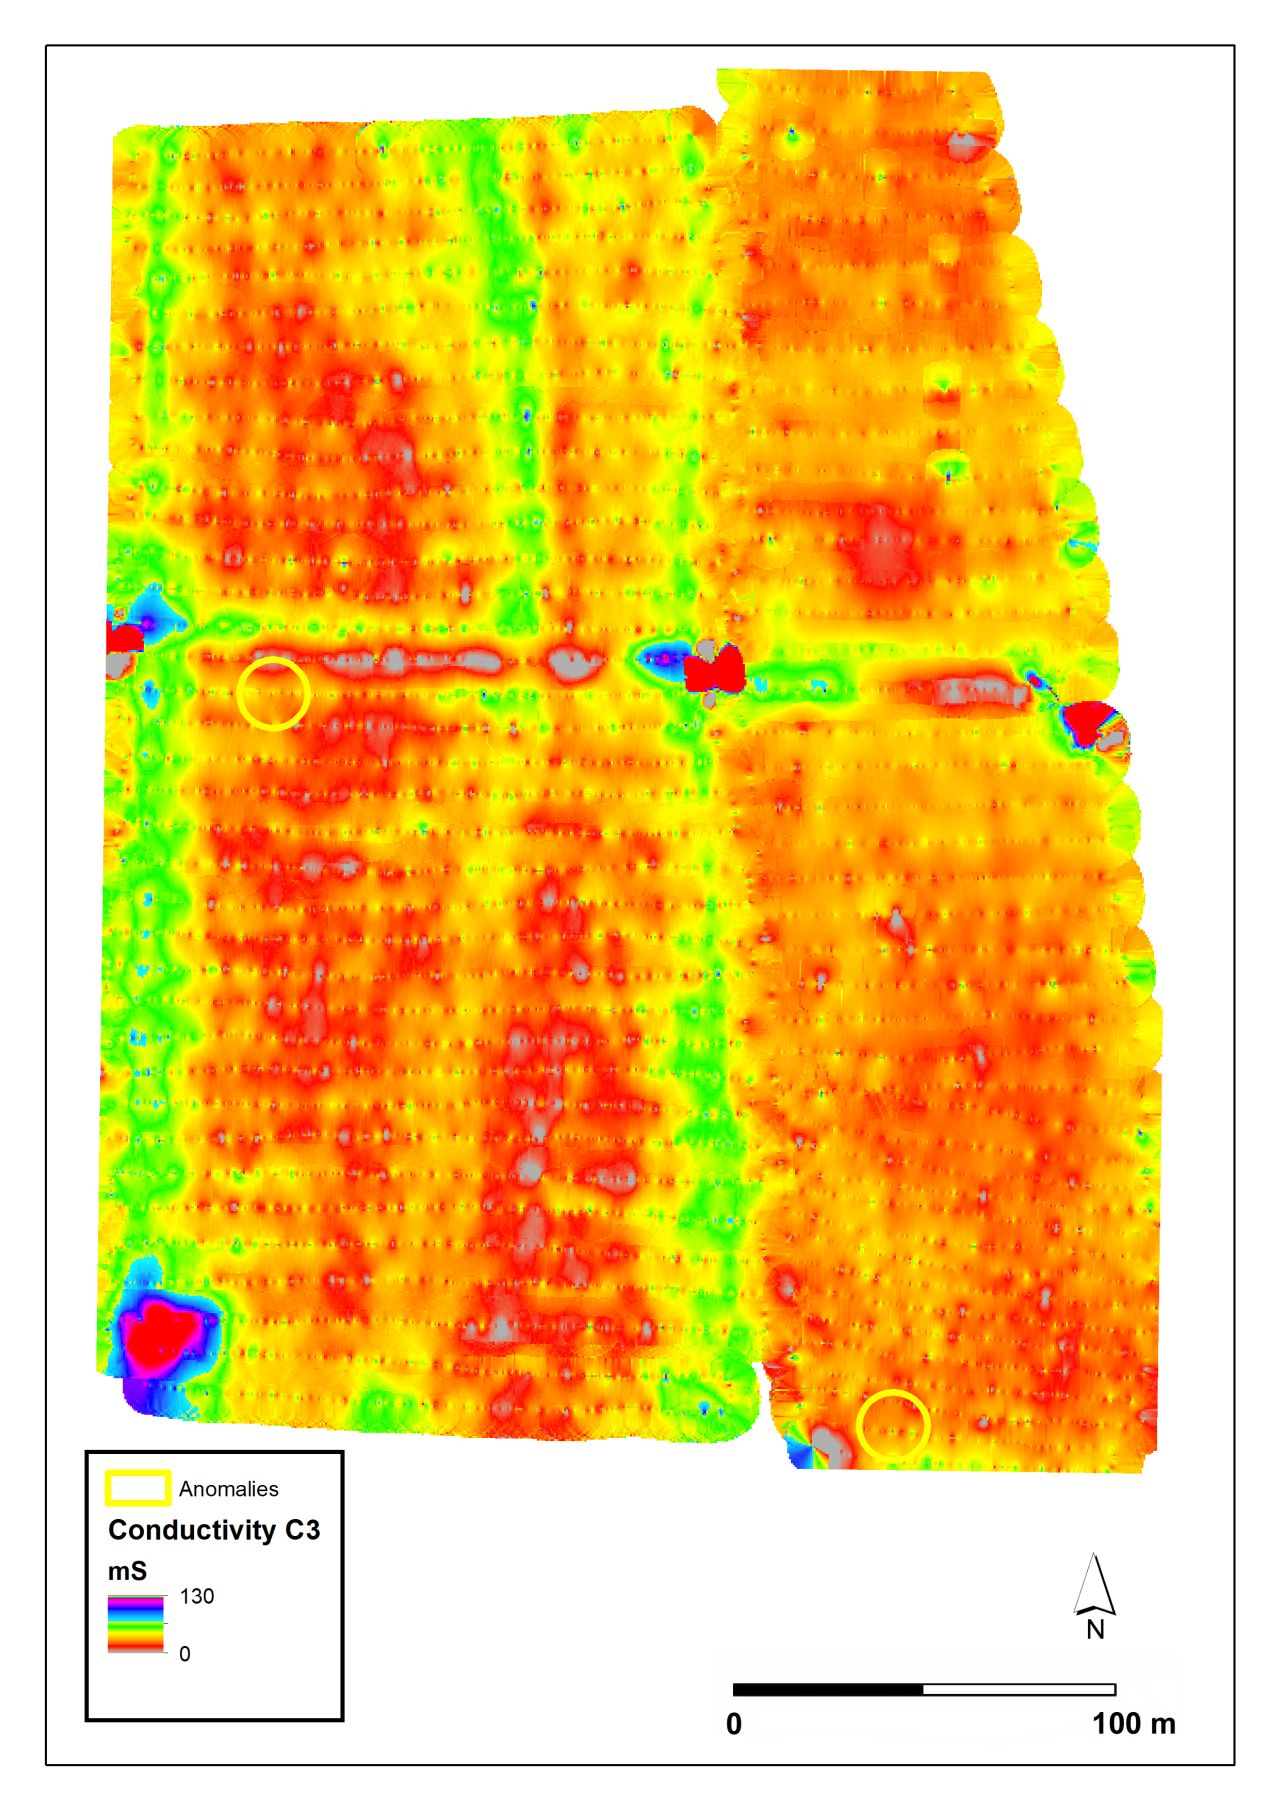
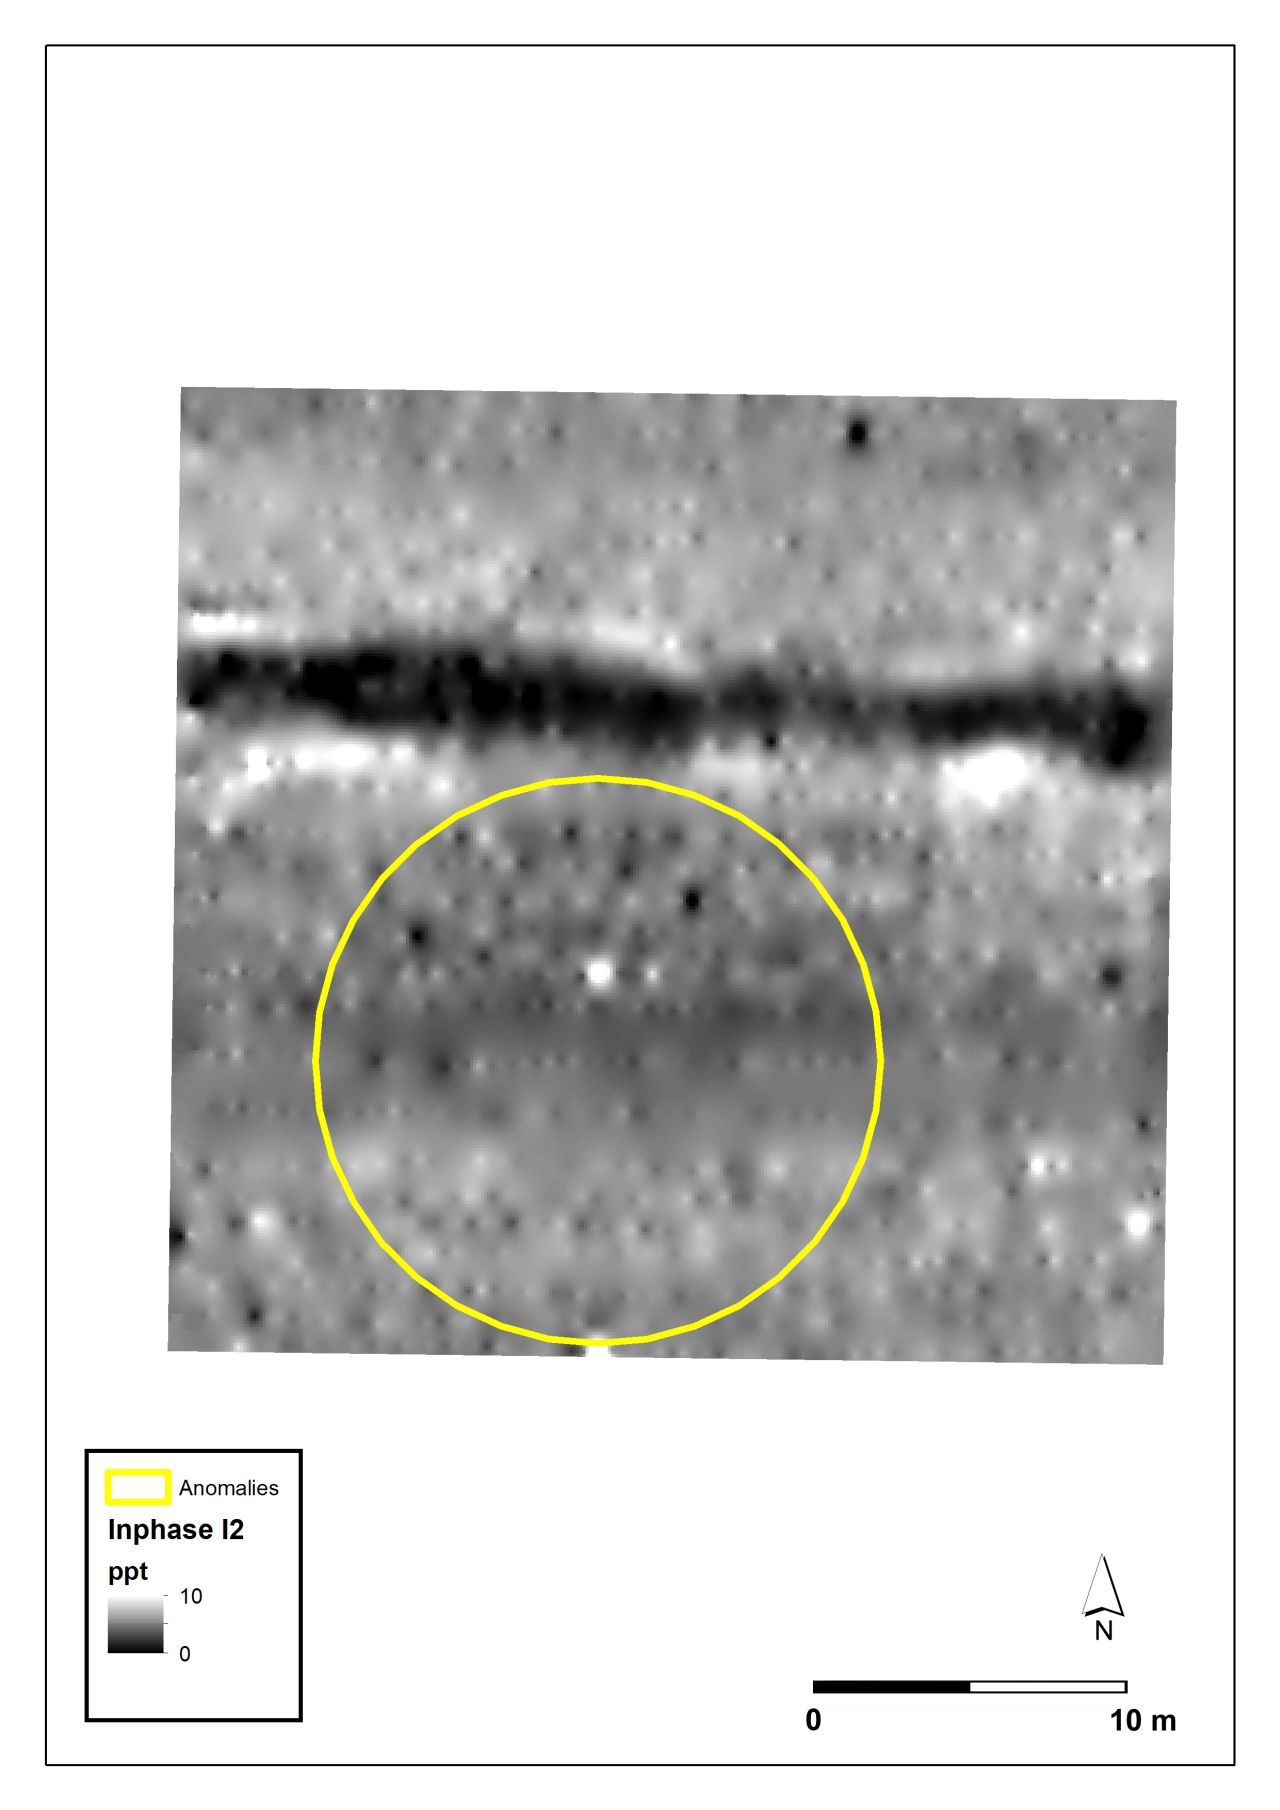
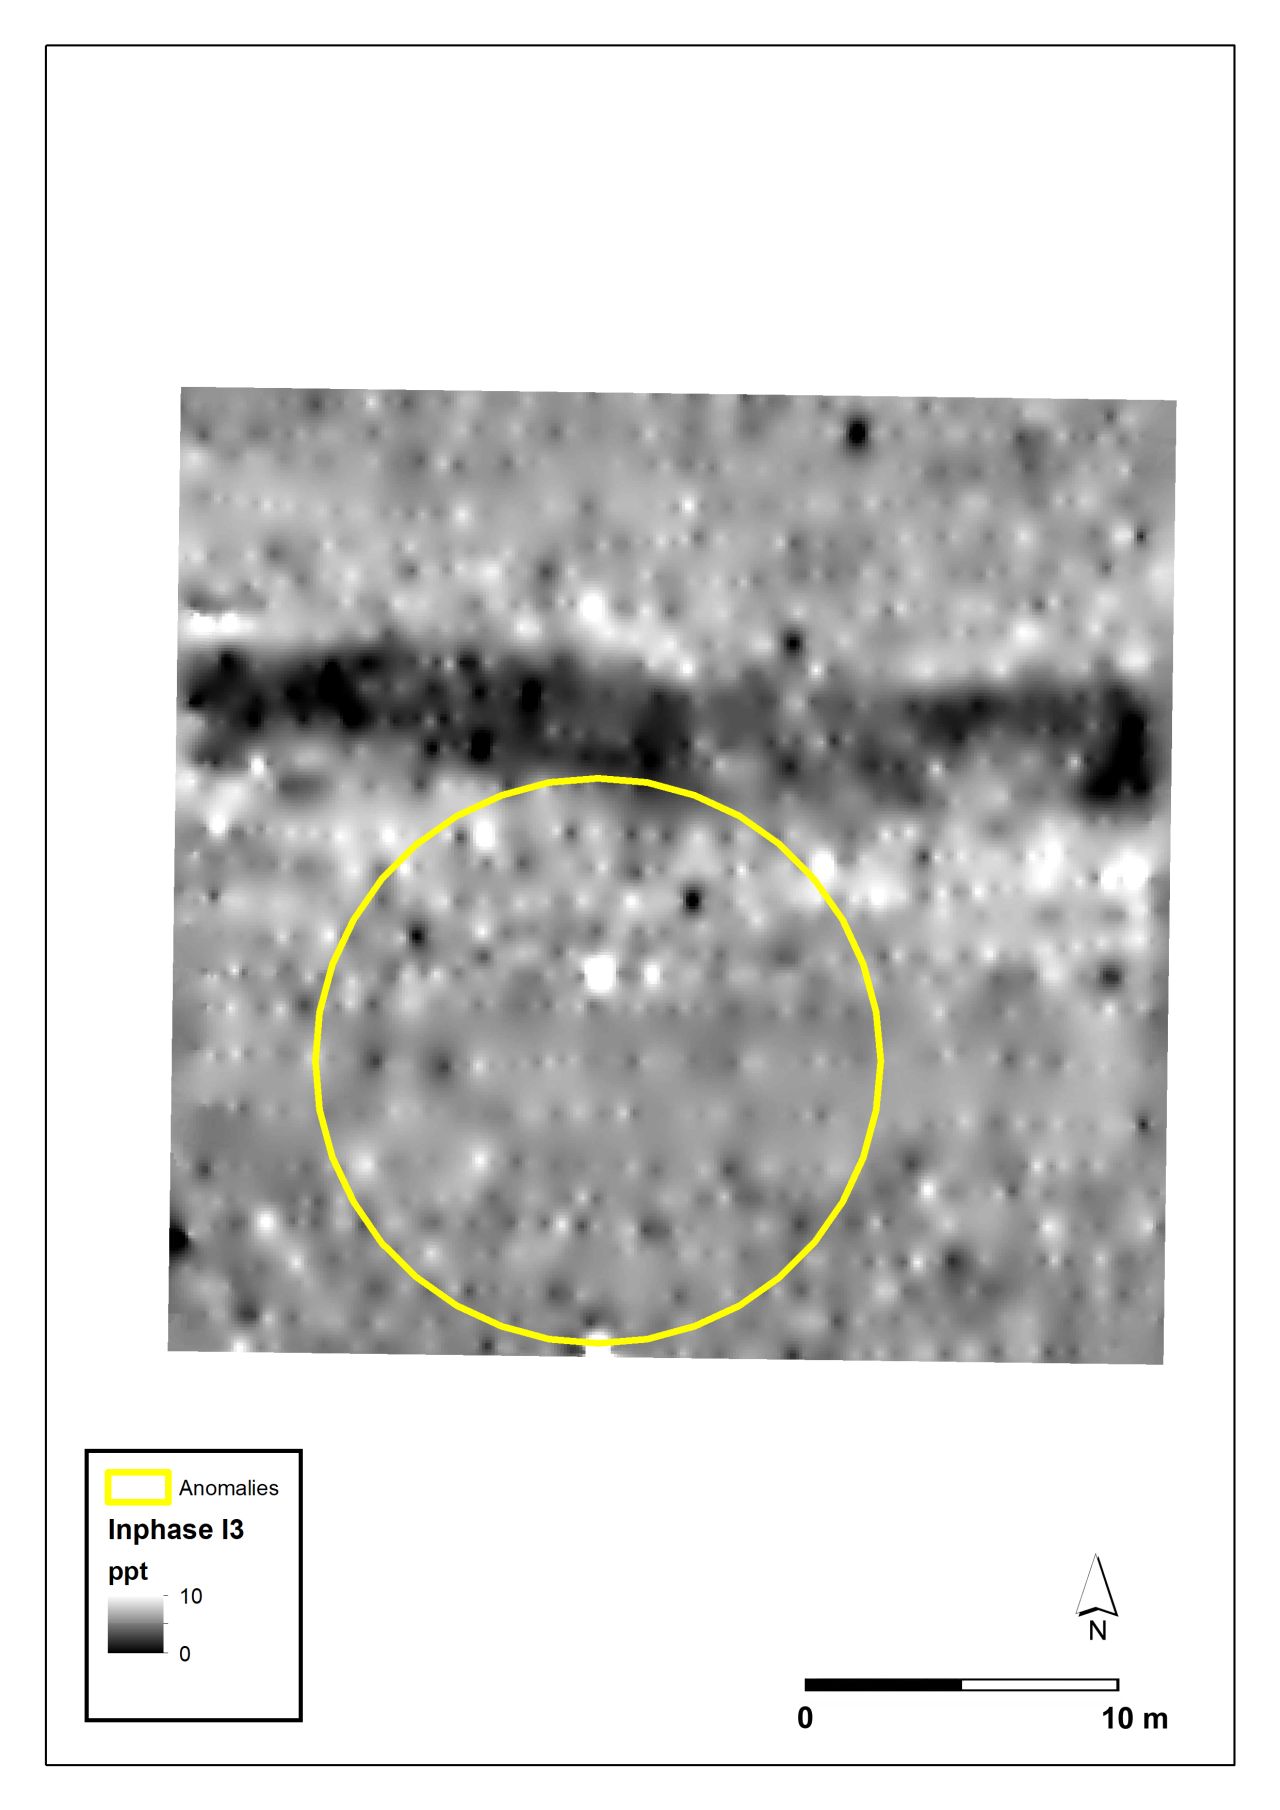
Landscape-scale electromagnetic measurements were made across the areas associated with anomalies 7A and 8A, using a CMD Explorer (CF Instruments) operated in vertical coil orientation. This instrument simultaneously measures both ground conductivity and inphase (magnetic susceptibility) values for three coil separations and allows exploration depth ranges of approximately 2, 4 and 6m depth. The Explorer was deployed along with positional information provided by a Trimble G6 GNSS. Line spacings of approximately 5m were acquired across the site using the Explorer in order to map landscape changes, and with a line spacing of approximately 1m across known features for greater detail. A sample interval of 0.3sec was used giving in-line recording at c.30cm intervals. The results were downloaded and analysed by extrapolation into contiguous surfaces using gridding routines in a geographic information system (ESRI ArcMap).
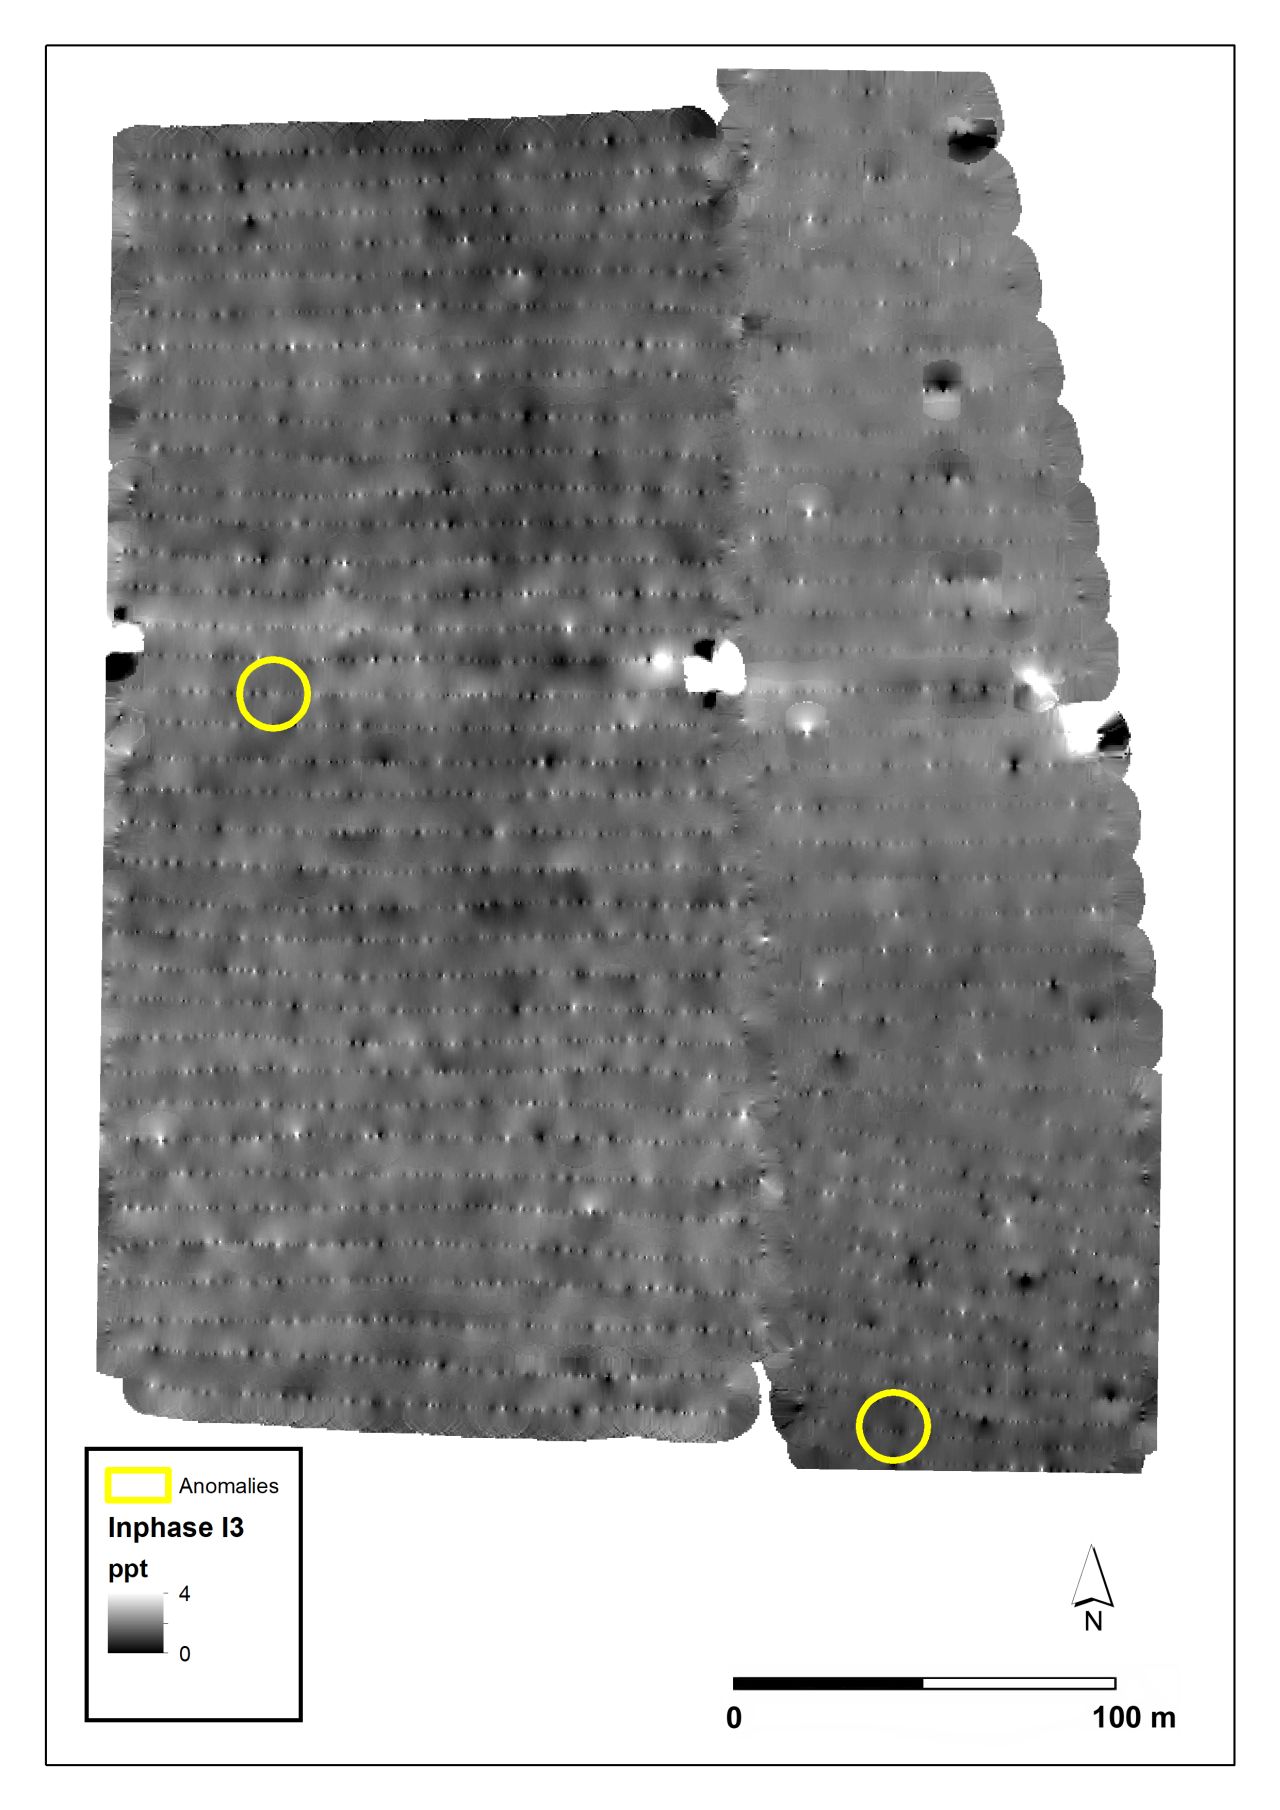
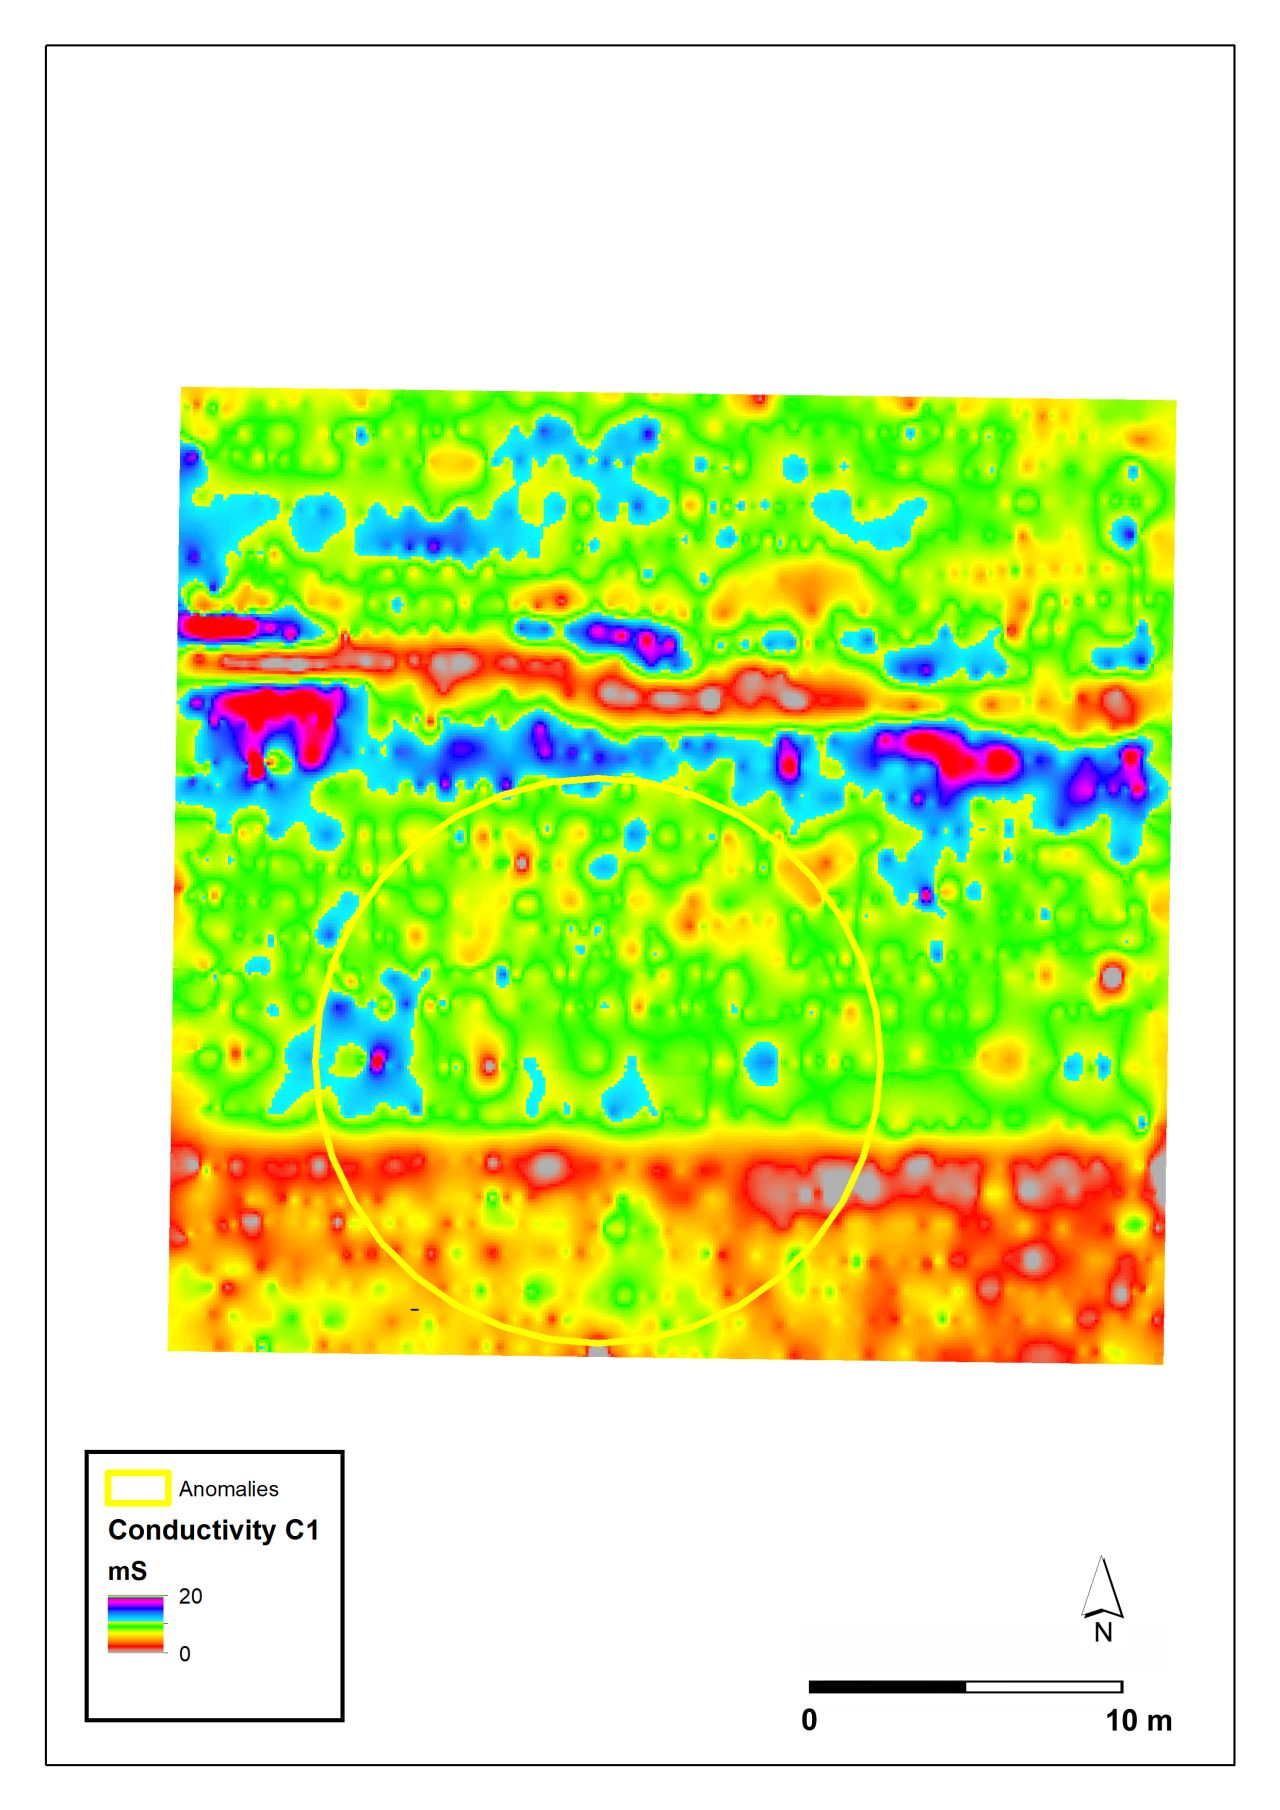
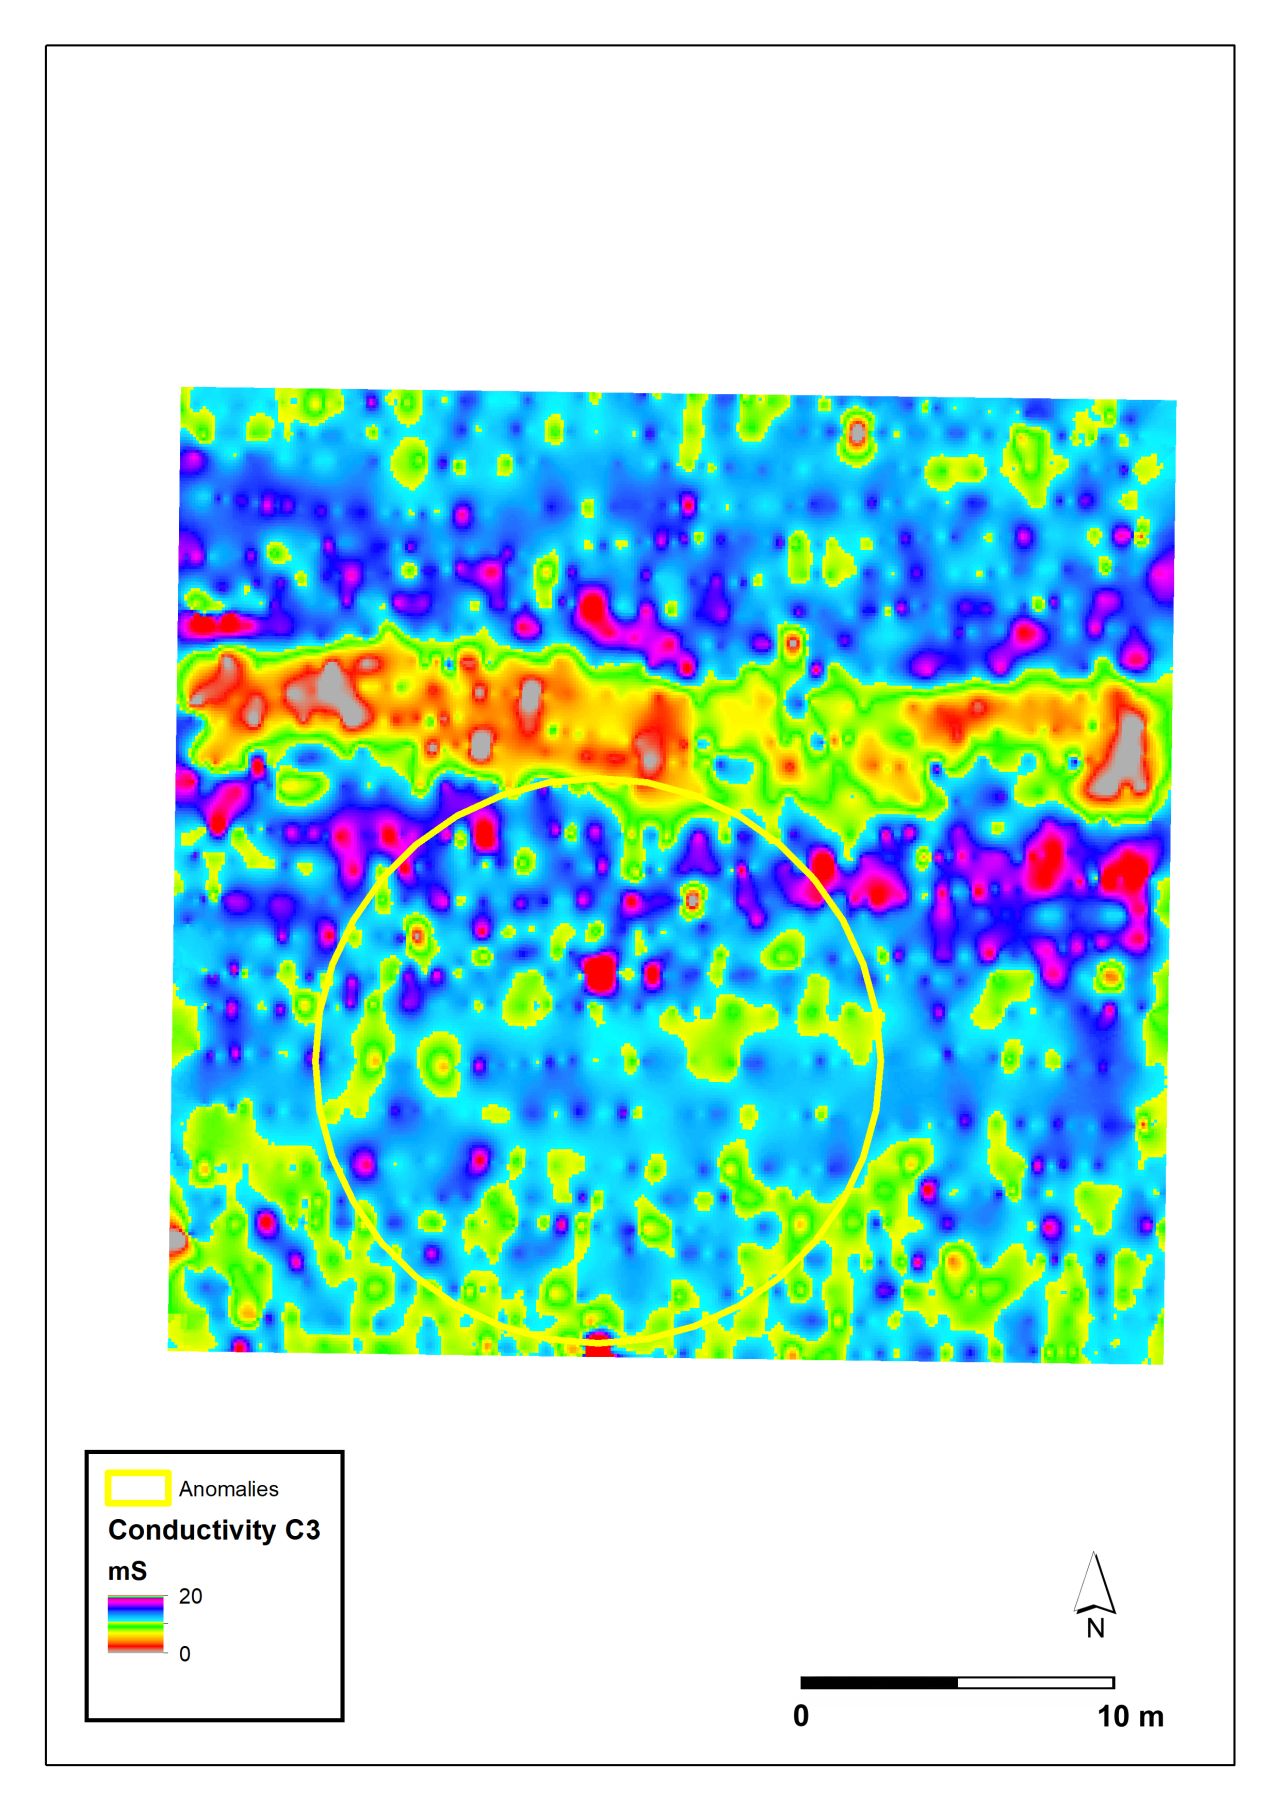
The results are illustrated in Figures 3.1 to 3.12 for conductivity and inphase measurements across all three coil separations over the whole site. Conductivity maxima, of approximately 120mS, was recorded on the site mainly around the perimeter of the survey, and along an approximate east-west line through the site (Figures 3.1–3.6). No clear signature was associated with features 7A and 8A, implying that the fill material was of similar conductivity to the surrounding soils and bedrock. Inphase values showed a consistent pattern for all three coil separations but again did not show any clear feature associated with the magnetometry features. The high-resolution survey showed similar results over feature 8A with conductivity values ranging up to approximately 40mS (Figures 3.7–3.12). The large east-west anomaly seen in the main survey data was also clear in the high-resolution data. It is likely this is associated with the pipe that is known to cross the site


Internet Archaeology is an open access journal based in the Department of Archaeology, University of York. Except where otherwise noted, content from this work may be used under the terms of the Creative Commons Attribution 3.0 (CC BY) Unported licence, which permits unrestricted use, distribution, and reproduction in any medium, provided that attribution to the author(s), the title of the work, the Internet Archaeology journal and the relevant URL/DOI are given.
Terms and Conditions | Legal Statements | Privacy Policy | Cookies Policy | Citing Internet Archaeology
Internet Archaeology content is preserved for the long term with the Archaeology Data Service (ROR). Help sustain and support open access publication by donating to our Open Access Archaeology Fund.
 Home
Home