Cite this as: Gaffney, V. et al. 2020 A Massive, Late Neolithic Pit Structure associated with Durrington Walls Henge, Internet Archaeology 55. https://doi.org/10.11141/ia.55.4
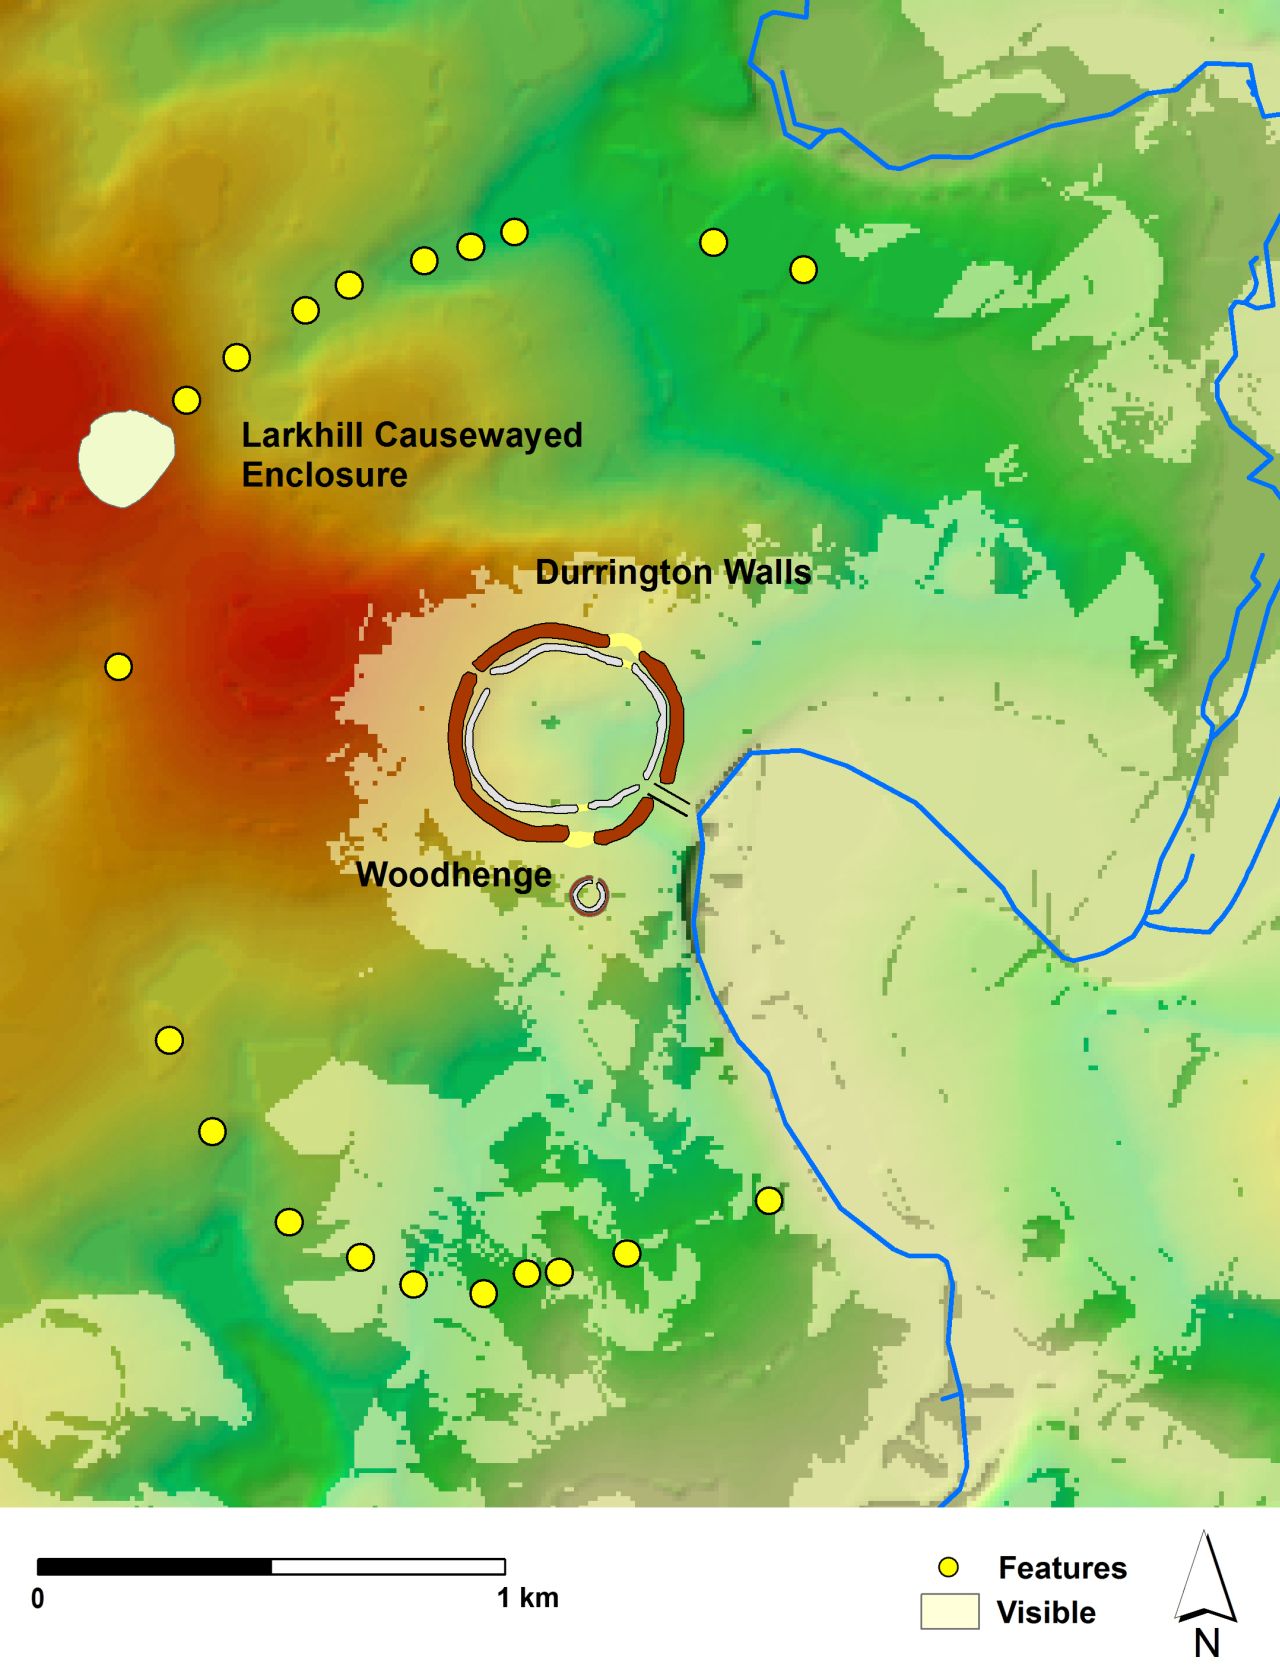
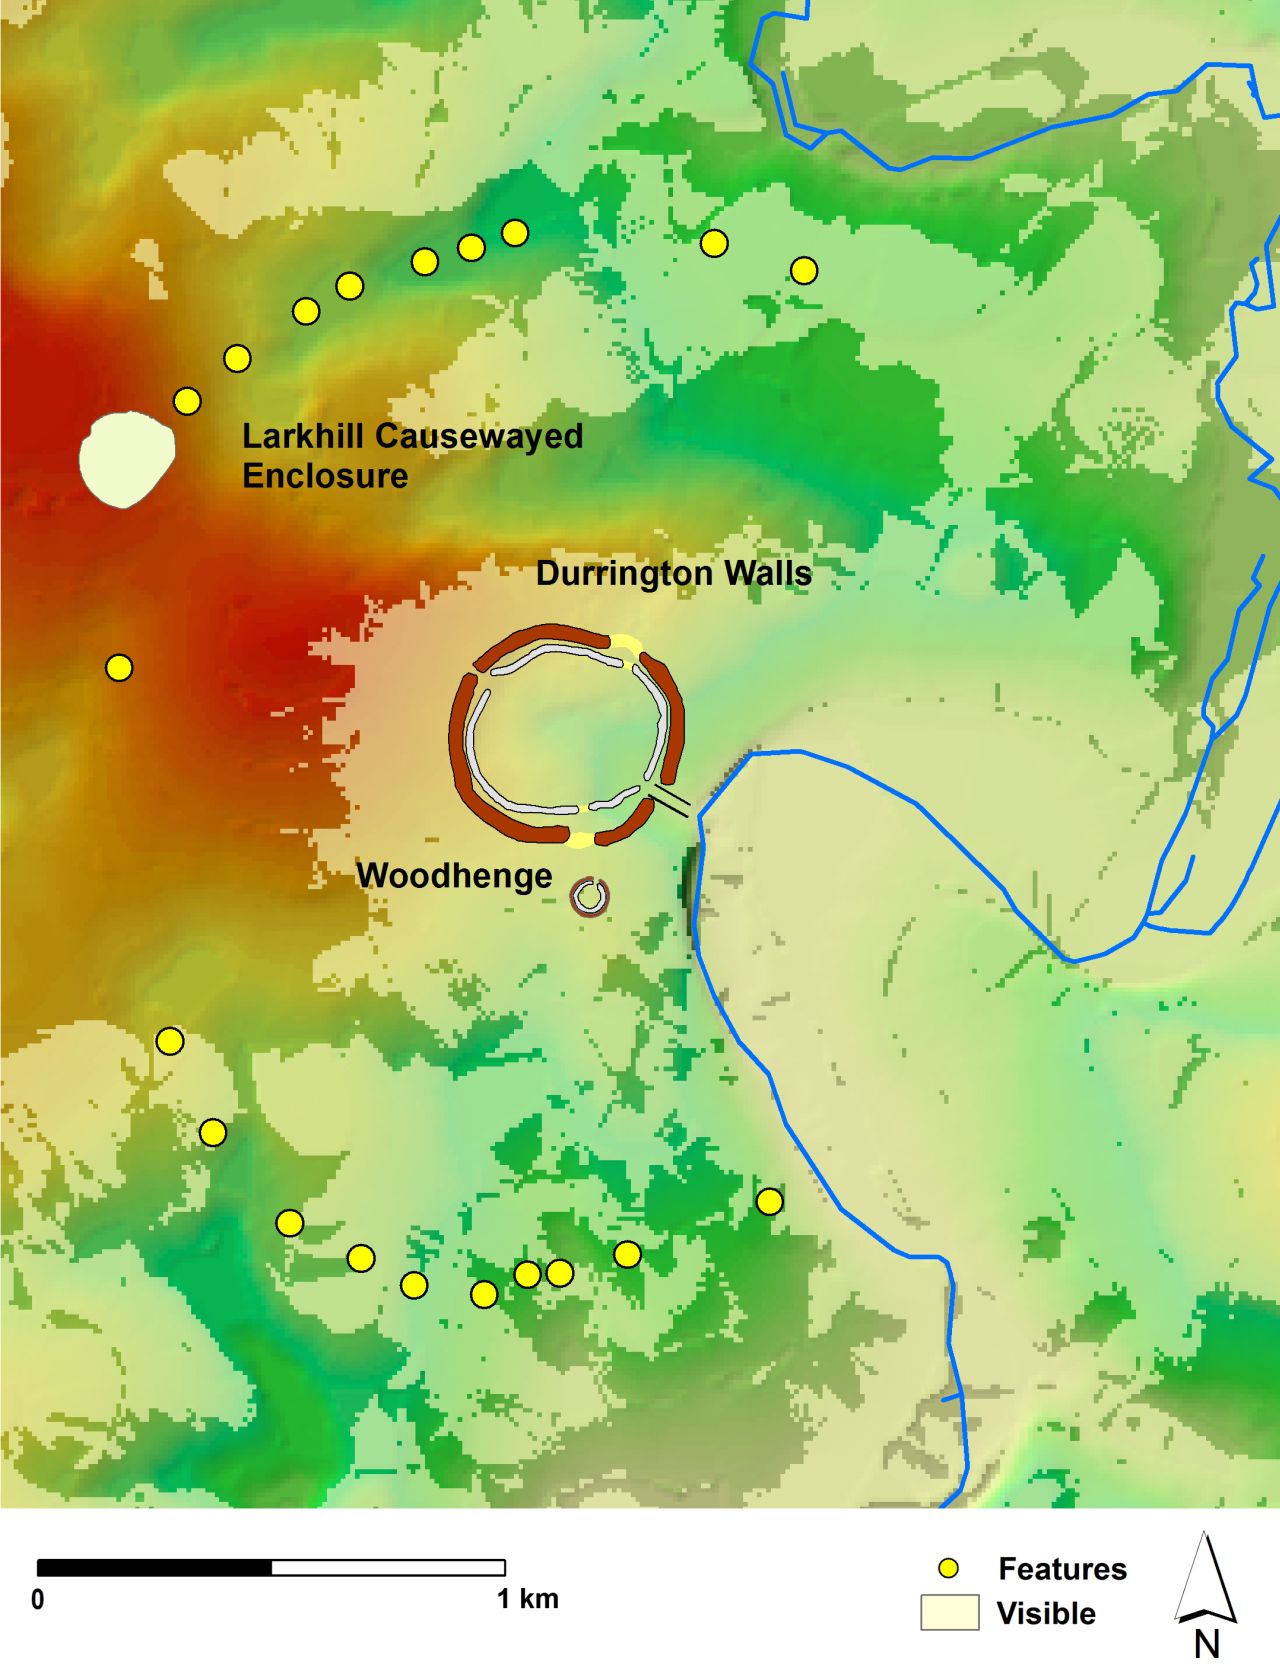
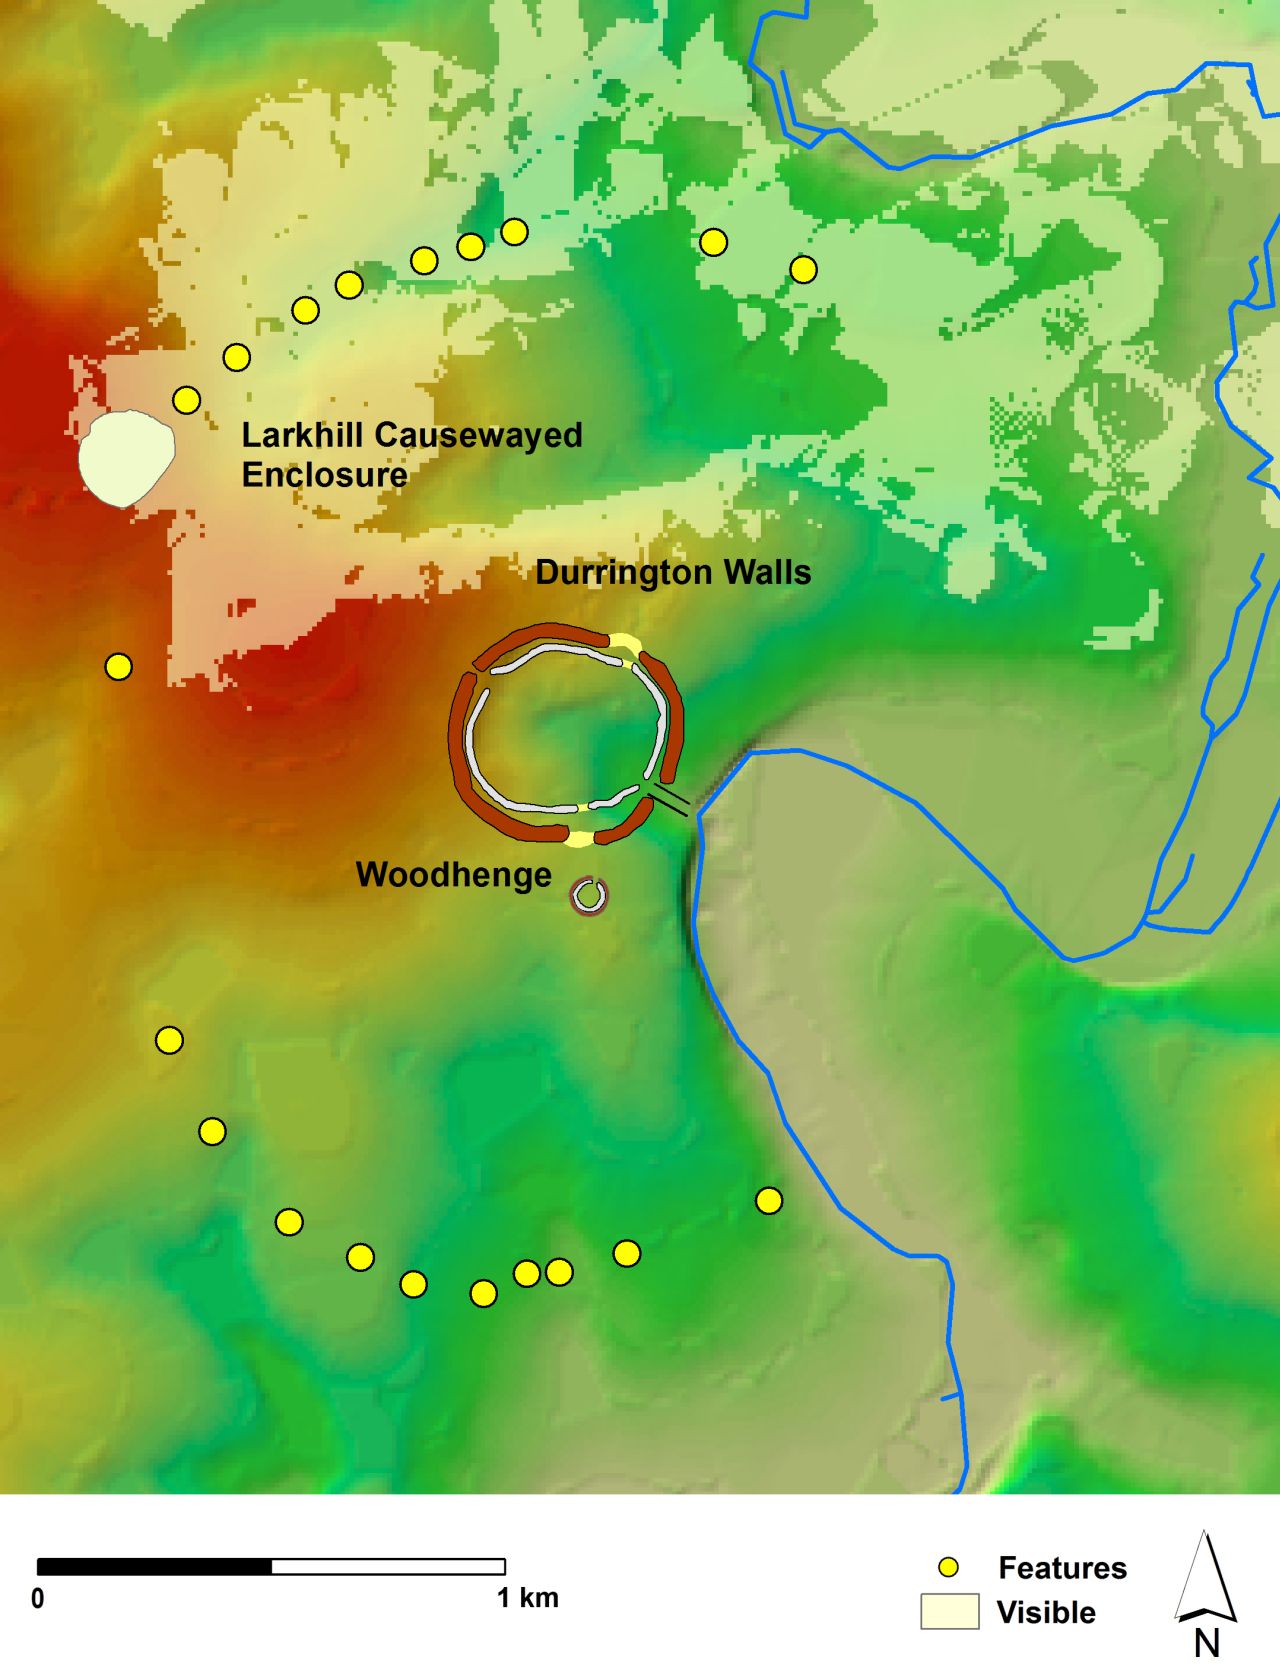
The arrangement of features surrounding Durrington Walls gives the impression of an area intermittently delineated by a series of massive pits. The tendency for some types of monuments, notably round barrows, to cluster at the edges of viewsheds of major monuments has been demonstrated as a significant phenomenon elsewhere in the Stonehenge landscape (Exon et al. 2000). To explore whether such a factor underlay the distribution of these features, a series of viewsheds have been generated from the outline of the henge. Figure 7.1 provides a view standing at ground level. As Wainwright and Longworth (1971, 196) estimate the bank height as c.3-3.3m, Figure 7.2 provides a view from the level of the bank at 3m. Figure 7.3 provides a view from the maximum likely height of a viewer from the top of the bank. None of these viewsheds provides a clear relationship with all recorded positions of these features. For the first two viewsheds (Figures 7.1. and 7.2), none of the features to the north-west appear to be located within sight of the monument. Those to the south and north-east are variably placed in relation to views of the henge. However, if a viewer were placed on the bank itself, pits 1A to 9A to the south as well as 14D and 15D and areas further east, are in view. There is no visual link to the area of the causewayed enclosure at Larkhill. Although the actual extent of the causewayed enclosure is not known (Leivers 2017), a view from the known ditch segments indicates that the Larkhill enclosure possesses viewsheds to the north and east (Figure 7.4). Taken together, these data suggest that only features 14D and 15D, and perhaps any features further to the east, are likely to have been visible from both the Larkhill causewayed enclosure and Durrington Walls henge.

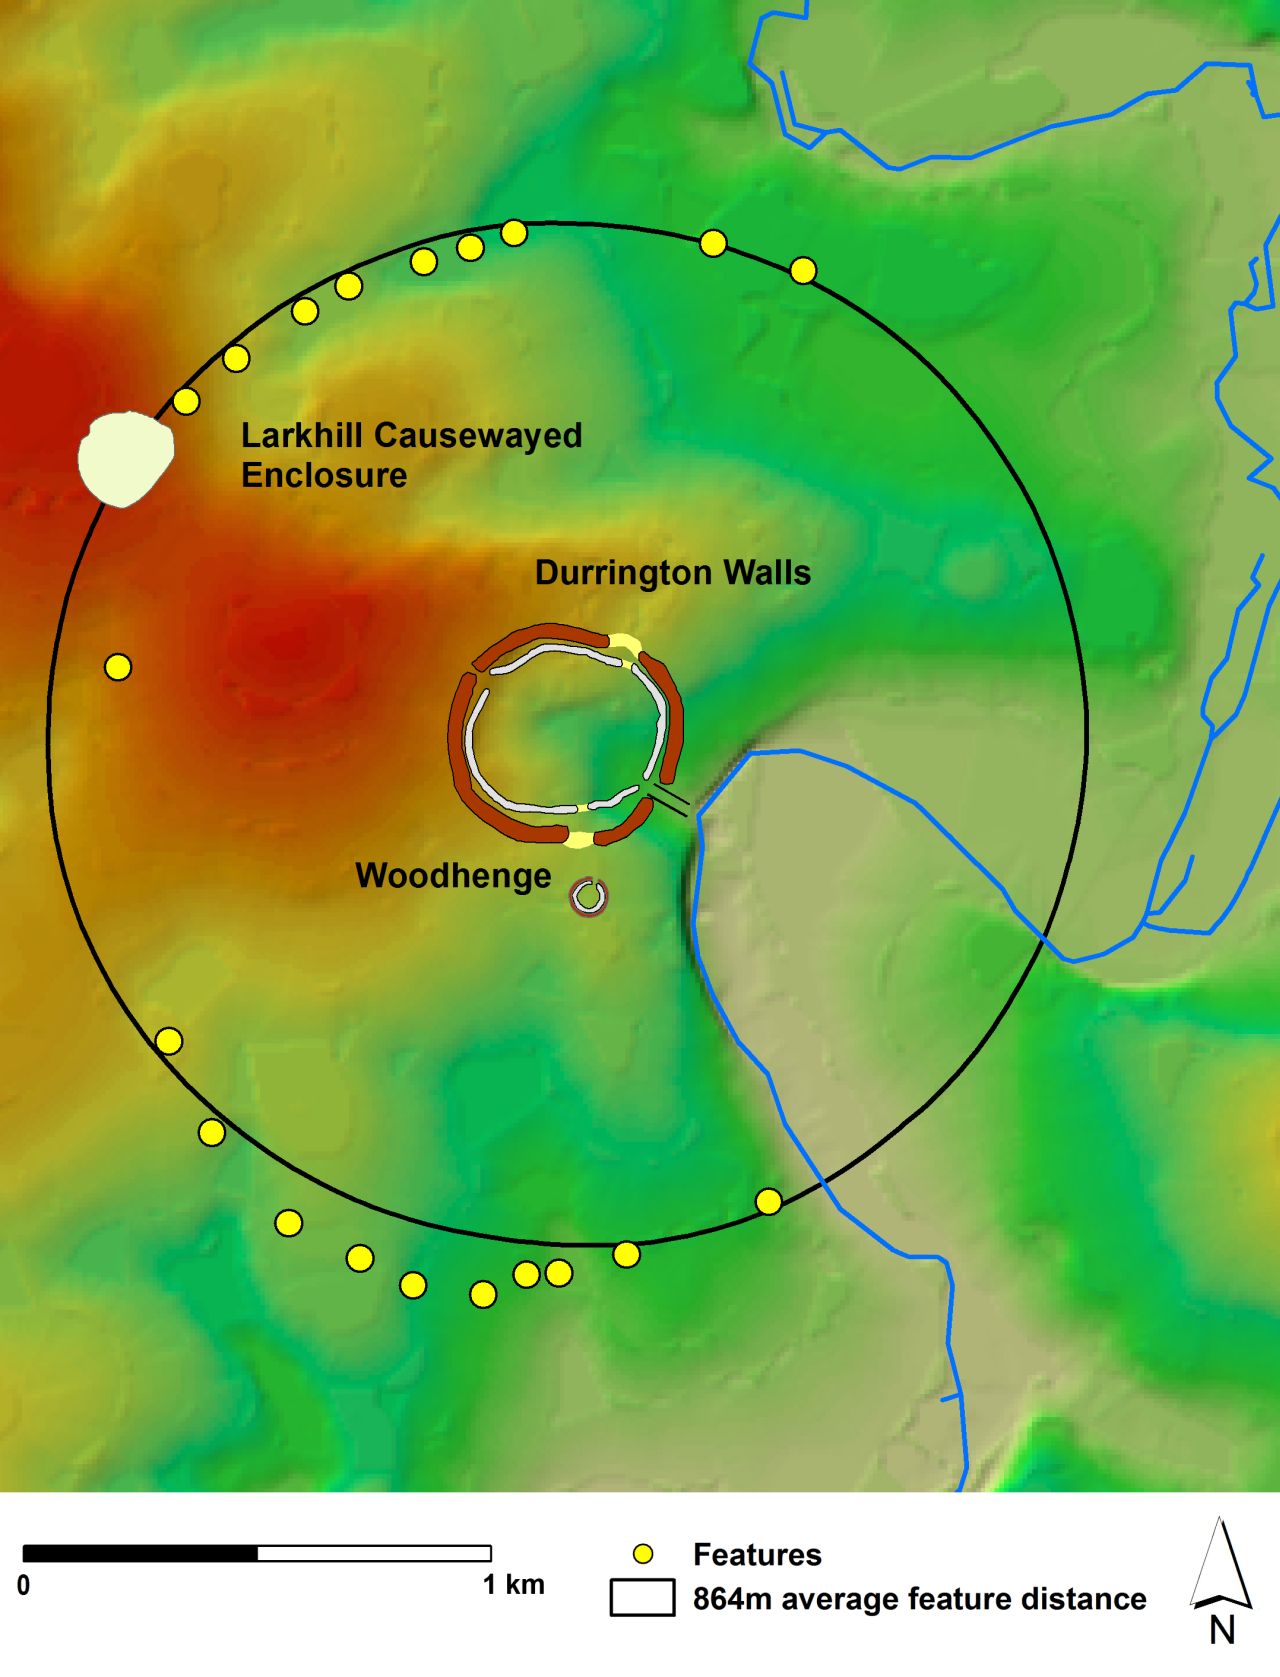
The arrangement of the pits is visually striking and appears to be centred on the henge monument at Durrington. However, it is also notable that the northern group of pits is orientated towards the Larkhill causewayed enclosure as it trends to the south-east. The distribution suggests that those who excavated these pits required the circuit to include the earlier enclosure. Graphing shows that most pits lie within 66m of the average pit distance from the henge – a distance of 864m (Figure 7.5 and Table 7.1). That distance was used to create a notional circular boundary against which the variation of pit placement was assessed. The northern pits align along a circuit based on that average distance. The southern pits (1A-9A) notably arc away from the average distance from Durrington Walls.
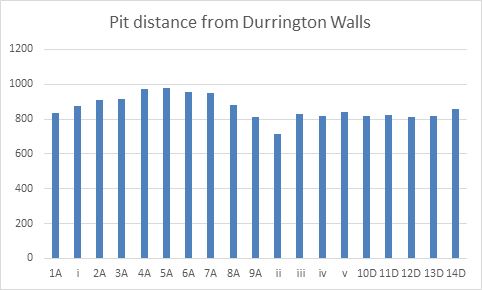
| 1A | 837 |
| i | 874 |
| 2A | 908 |
| 3A | 918 |
| 4A | 972 |
| 5A | 979 |
| 6A | 955 |
| 7A | 950 |
| 8A | 883 |
| 9A | 812 |
| ii | 716 |
| iii | 829 |
| iv | 820 |
| v | 839 |
| 10D | 817 |
| 11D | 821 |
| 12D | 813 |
| 13D | 819 |
| 14D | 856 |
| 15D | 862 |
| Average | 864 |
| St deviation | 66 |
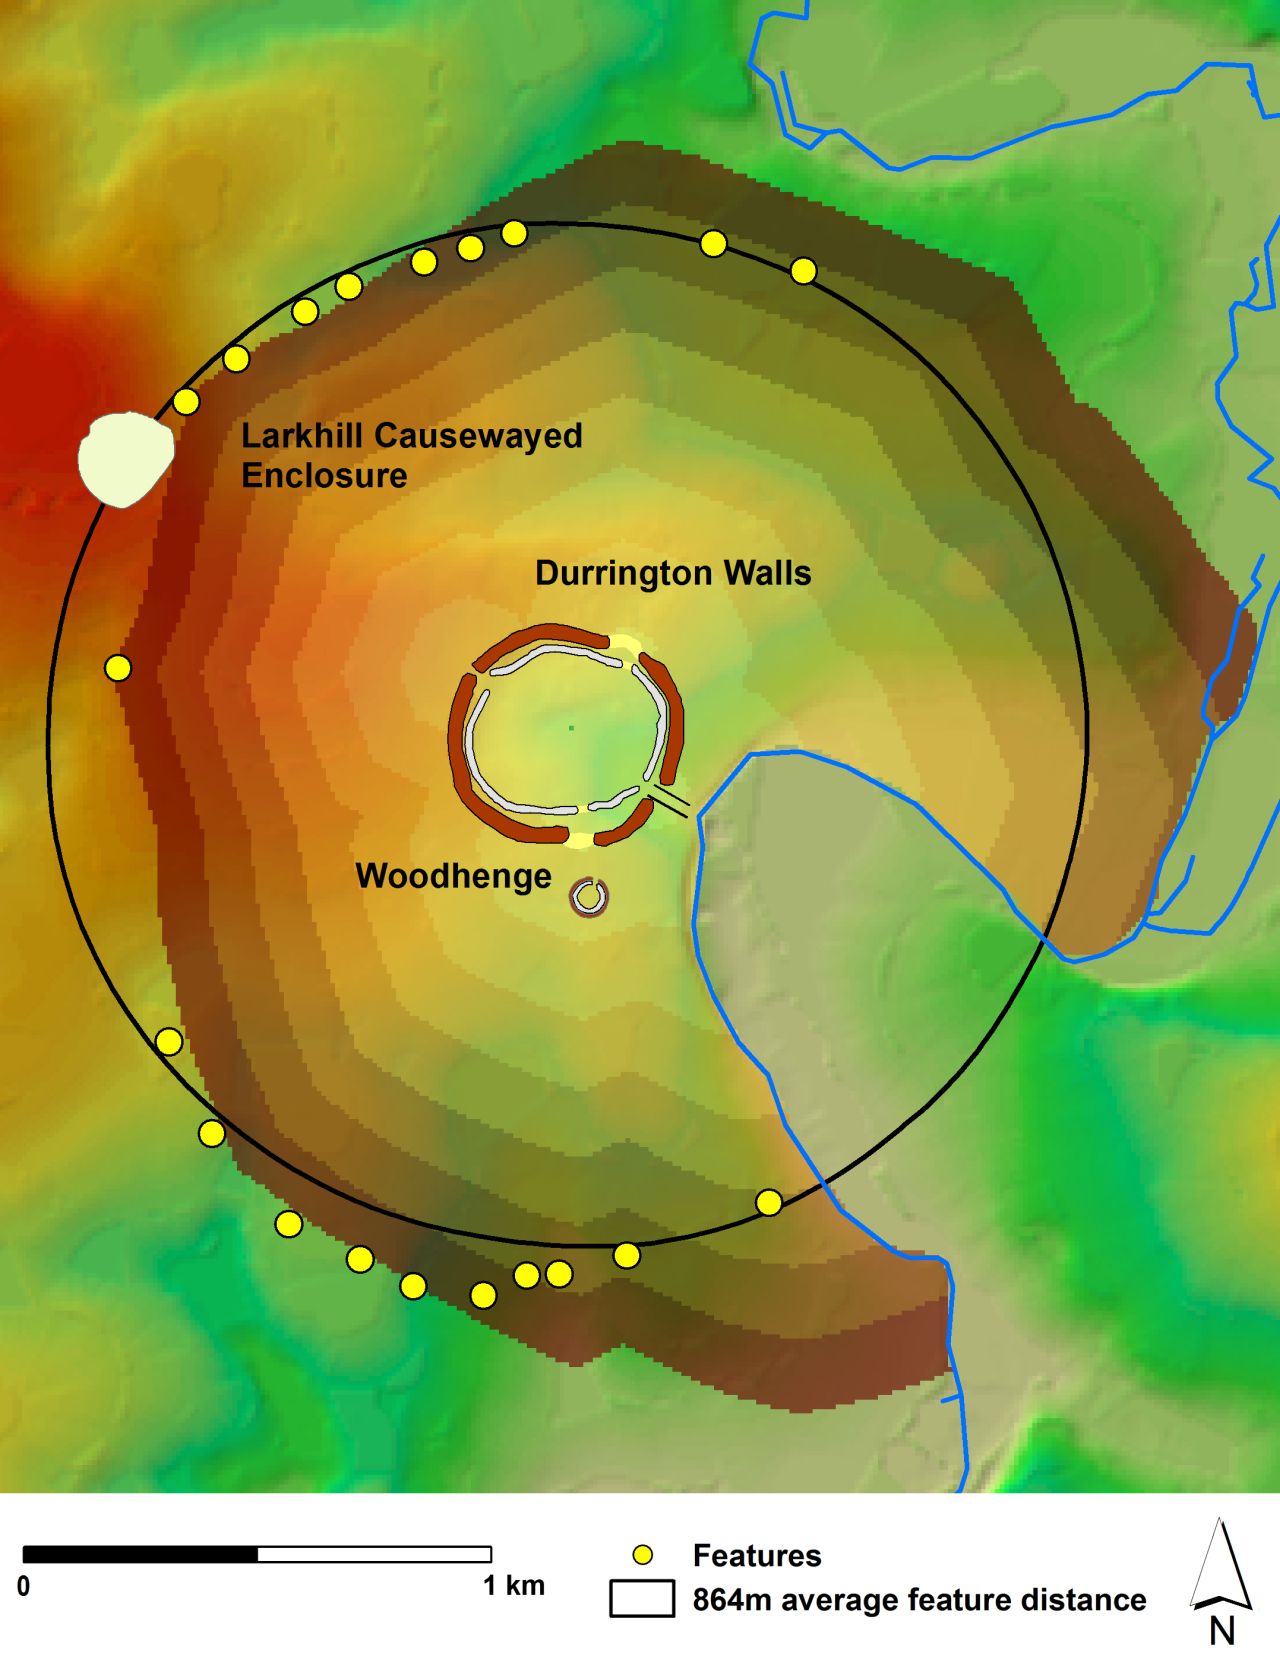
This variation was explored by creating a simple cost distance map within ArcGIS from the centre of Durrington Walls and generated from Ordnance Survey digital elevation model. This is illustrated in Figure 7.7 (ESRI nd). Many of the recorded features cluster at the cost distance boundary approximating the energy cost derived from moving between Durrington Walls to the Larkhill causewayed enclosure. The data suggest that the placing of the pits, whether in distance or energy cost terms, was strongly influenced by a desire or need to record a boundary approximating the distance between Durrington Walls and the Larkhill causewayed enclosure
The pattern of pit placement around the circuit deserves further comment. In the northern group both the Euclidean distance and the cost distance boundary are similar, and the pit distribution north of Durrington Walls reflects this. The correlation appears less good in the central and eastern sector of the southern group. Here the land is relatively flat and the relative cost of moving the same distance is lower. The fact that the pit circuit is distended here may well result from errors caused by pacing over large distances and the tendency to take longer steps across level land (FAO 2016; DoA 2005) . It is notable that there is a major correction to the east of pit 4. If correct, this could suggest that pits may have been dug moving away from Larkhill and that both the terrain and visibility links in the north allowed the excavators of the pits to keep, relatively, to the ideal route of the pit circuit. The lack of visibility to the south, and the differing terrain led to an increasing divergence from the ideal route up until the point the deviation was corrected, and the pit orientation changed to conform to the ideal circuit.
Internet Archaeology is an open access journal based in the Department of Archaeology, University of York. Except where otherwise noted, content from this work may be used under the terms of the Creative Commons Attribution 3.0 (CC BY) Unported licence, which permits unrestricted use, distribution, and reproduction in any medium, provided that attribution to the author(s), the title of the work, the Internet Archaeology journal and the relevant URL/DOI are given.
Terms and Conditions | Legal Statements | Privacy Policy | Cookies Policy | Citing Internet Archaeology
Internet Archaeology content is preserved for the long term with the Archaeology Data Service (ROR). Help sustain and support open access publication by donating to our Open Access Archaeology Fund.
 Home
Home