The simulation of Neolithic economic activities and their subsequently linked landscapes within the chosen area of southern Calabria followed a series of straightforward steps. First, a potential Neolithic landscape was created on the basis of topographical, geological and river data (the environmental niches map; see 3.1). This environment, the physical background to the intended visualisation of Neolithic economic impacts, was evaluated in terms of yield for farming, herding and foraging practices (yield values, see 3.2). Secondly, a number of Neolithic sites were located in this landscape. Based on details of house and site sizes, it was argued that settlements in Calabria were probably substantially smaller than Neolithic villages elsewhere in southern Italy (Robb and Van Hove 2003, 245). The notional value of 50 people was chosen as a reasonable estimate for people living in Neolithic settlements in Calabria. Each GIS simulation then positioned 50 people at a given site, and defined an area for each specific land use within a chosen economical structure large enough for their survival (per year). Based on simulations of Neolithic land needs per person per specific land use by Gregg (1988), the necessary land area for each modelled land use and economy was calculated in hectares (Table 2).
| No. | Economy Model | Hectares of crops | Hectares of herds | Hectares of wild plants | Hectares of game | Hectares of wild resources | Hectares of domesticated resources |
|---|---|---|---|---|---|---|---|
| 1 | Forager 1 | 0 | 0 | 106.68 | 7666 | 7772.68 | 0 |
| 2 | Forager 2 | 0 | 0 | 266.70 | 4791.25 | 5057.95 | 0 |
| 3 | Forager 3 | 0 | 0 | 346.71 | 3353.88 | 3700.59 | 0 |
| 4 | Forager-Farmer 1 | 6.21 | 514.68 | 186.69 | 3353.88 | 3540.57 | 520.89 |
| 5 | Forager-Farmer 2 | 16.56 | 343.12 | 133.35 | 2395.63 | 2528.98 | 359.68 |
| 6 | Forager-Farmer 3 | 27.57 | 113.23 | 34.14 | 2271.05 | 2305.19 | 140.80 |
| 7 | Farmer 1 | 41.4 | 0 | 0 | 0 | 0 | 41.4 |
| 8 | Farmer 2 | 26.04 | 789.18 | 14.94 | 1082.82 | 1097.76 | 815.22 |
| 9 | Farmer 3 | 33.12 | 686.24 | 0 | 0 | 0 | 719.36 |
| 10 | Pastoralist 1 | 0 | 3431.2 | 0 | 0 | 0 | 3431.2 |
| 11 | Pastoralist 2 | 20.7 | 1715.6 | 0 | 0 | 0 | 1736.3 |
| 12 | Pastoralist 3 | 12.42 | 2401.84 | 0 | 0 | 0 | 2414.26 |
| 13 | Pastoralist 4 | 6.21 | 2401.84 | 40.01 | 718.69 | 758.69 | 2408.05 |
| 14 | Pastoralist 5 | 0 | 1715.6 | 133.35 | 2395.63 | 2528.98 | 1715.6 |
| 15 | Mixed | 13.87 | 1149.45 | 88.01 | 1581.11 | 1669.12 | 1163.32 |
Table 2: Range of economic models incorporated into the synchronic GIS analysis and their respective constituent land use needs in hectares
The analysis incorporated a selection of 15 economic models (Table 3), incorporating three land uses: farming, herding and foraging. Each model assumes a different combination of these land-use strategies, expressed as a percentage of the average calorific intake within the modelled communities (cf. Table 3). The chosen economic structures include an optimal farming model, resulting from an extensive simulation experiment involving data from Central Europe (Gregg 1988, 178), and an ethnographic data model (Kelly 1995, 65). The relative position of all 15 models within the spectrum of possibilities for economic structures using farming, herding and foraging shows that these present a broad range (cf. Fig. 4).
| No. | Economy Model | Crops, % of total calories | Herds, % of total calories | Wild plants, % of total calories | Game, % of total calories | Foraged resources, % of total calories |
|---|---|---|---|---|---|---|
| 1 | Forager 1 | 0 | 0 | 20 | 80 | 100 |
| 2 | Forager 2 | 0 | 0 | 50 | 50 | 100 |
| 3 | Forager 3 | 0 | 0 | 65 | 35 | 100 |
| 4 | Forager-Farmer 1 | 15 | 15 | 35 | 35 | 70 |
| 5 | Forager-Farmer 2 | 40 | 10 | 25 | 25 | 50 |
| 6 | Forager-Farmer 3 | 66.6 | 3.3 | 6.4 | 23.7 | 30.1 |
| 7 | Farmer 1 | 100 | 0 | 0 | 0 | 0 |
| 8 | Farmer 2 | 62.9 | 23 | 2.8 | 11.3 | 14.1 |
| 9 | Farmer 3 | 80 | 20 | 0 | 0 | 0 |
| 10 | Pastoralist 1 | 0 | 100 | 0 | 0 | 0 |
| 11 | Pastoralist 2 | 50 | 50 | 0 | 0 | 0 |
| 12 | Pastoralist 3 | 30 | 70 | 0 | 0 | 0 |
| 13 | Pastoralist 4 | 15 | 70 | 7.5 | 7.5 | 15 |
| 14 | Pastoralist 5 | 0 | 50 | 25 | 25 | 50 |
| 15 | Mixed | 33.5 | 33.5 | 16.5 | 16.5 | 33 |
Table 3: Range of economic models incorporated into the synchronic GIS analysis and their respective land-use strategies
Figure 4: Relative variety of economic choices within synchronic analysis (after Robb and Van Hove 2003, fig. 3)
These initial, synchronic land use models (see example in Fig. 5) were used as a basis for a diachronic simulation accumulating areas of use through time. An exploratory attempt was made to integrate the idea of time within land-use simulations through the use of iterative procedures within shell script programming. More details on the specific modelling procedure can be found in Van Hove 2003, chapter 7. By generating land-use patterns as a result of a conscious economic choice and feeding the resulting landscapes into a cumulative sequence of land use, land exhaustion and land recuperation, this 'frequentation' of landscapes and intensity of use could be shown through time (see 3.5 and 3.6).
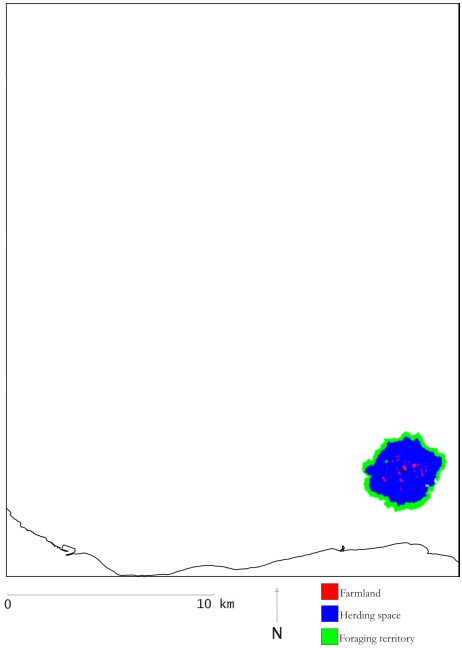
Figure 5: Example of synchronic simulation output: farmland, herding space and foraging territory around Penitenzeria (Gregg's optimal farmer model – 62.90% farming, 23% herding, 14.10% foraging; Gregg 1988, 178)
© Internet Archaeology
URL: http://intarch.ac.uk/journal/issue16/5/3.4.html
Last updated: Thur Nov 11 2004